
Should You T-Bill and Chill?
The pros and cons of taking refuge in cash now that yields are hovering above 5%.
/s3.amazonaws.com/arc-authors/morningstar/360a595b-3706-41f3-862d-b9d4d069160e.jpg)
Cash investors haven’t had it this good in years. After a long period of near-zero yields, yields on the three-month Treasury bill have been as high as 5.5% so far in 2023—their highest level since December 2000. That’s not only decent in absolute terms but also well ahead of inflation, which has been running at about 3.2% year over year based on the most recent data reported on Nov. 14, 2023.
Current cash yields are also attractive because of the unusual state of the yield curve. Longer-term bonds typically offer more generous yields to compensate investors for the time-based risk of locking up their money for a longer period. Over the past year or so, the yield curve has been inverted, which means there’s no yield incentive for investors to venture out into longer bond maturities. Investors can earn better yields on the short end of the curve without courting any interest-rate risk.
The unusually generous yields on cash have led many investors to ask: If you can earn a positive real return on Treasury bills and other short-term instruments without taking any risk (aka the “T-bill and chill” strategy), why not? This line of reasoning has led to a flood of cash in money market funds, totaling nearly $900 billion for the 12 months through Oct. 31, 2023. But are investors making the right decision by scooping up these funds? In this article, I’ll look at the pros and cons of keeping money in cash.
Arguments in Favor of T-Bill and Chill
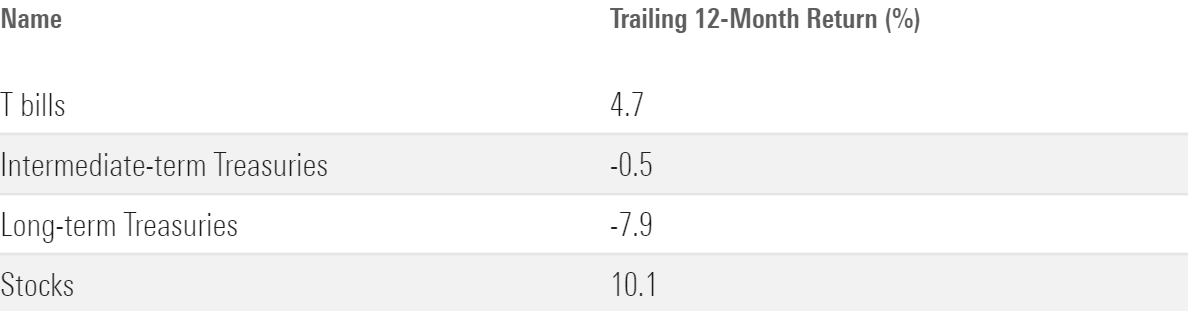
An environment where interest rates continue to remain higher for longer—as many economists have been expecting for the past few months—would be favorable for this strategy. Since the yield curve first started inverting in November 2022, Treasury bills have outperformed longer-duration bonds by a healthy margin, as shown in the table below. Cash returns have fallen behind those on stocks as the market has staged a recovery, though.
A Partial Win for T-Bill and Chill
Continued moderation in inflation would also be positive. One of the main reasons for investing is to preserve purchasing power over time, and a more temperate inflation rate makes it easier to do that.
The Potential Downside
However, there are a few other things to consider.
Taxes: Treasury bills are exempt from state and local taxes but still subject to federal income taxes. That makes them less attractive holdings for taxable accounts. Investors in higher tax brackets might want to consider short-term municipal securities instead.
Inflation Risk: In addition, there’s no guarantee that cash yields will remain ahead of inflation. There’s often an opportunity cost for holding cash, and when cash does yield more than inflation, the gap tends to be relatively small. On average, cash edged out inflation by an annualized 0.64% over all the rolling 36-month periods from 1954 through Oct. 31, 2023. In other words, cash might stay ahead of inflation over the long term but not by a large amount.
Reinvestment Risk: Any investment in short-term securities involves reinvestment risk. For example, if you bought a three-month Treasury bill with a yield of 5.5%, you’d benefit from that annualized yield until the maturity date. But if interest rates drop to 4.0%, you’d be reinvesting at a lower rate. Market interest rates can quickly reverse course at times, which amplifies the impact of reinvestment risk. For example, yields on three-month Treasury bills dropped from about 5.0% in February 2007 to less than 1.3% in March 2008. Investors holding T-bills during that period would have had to reinvest at lower and lower rates.
Opportunity Cost: The biggest issue, though, is that investing in cash doesn’t really build long-term wealth. That’s true even during periods when T-bills appear to offer attractive yields. To quantify this, I looked at subsequent returns (starting in 1982) over 12-month, three-year, five-year, and 10-year periods starting with months when Treasury bills looked attractive based on either a positive spread versus 10-year Treasuries (the inverted yield curve mentioned above) or a positive spread versus year-over-year inflation.
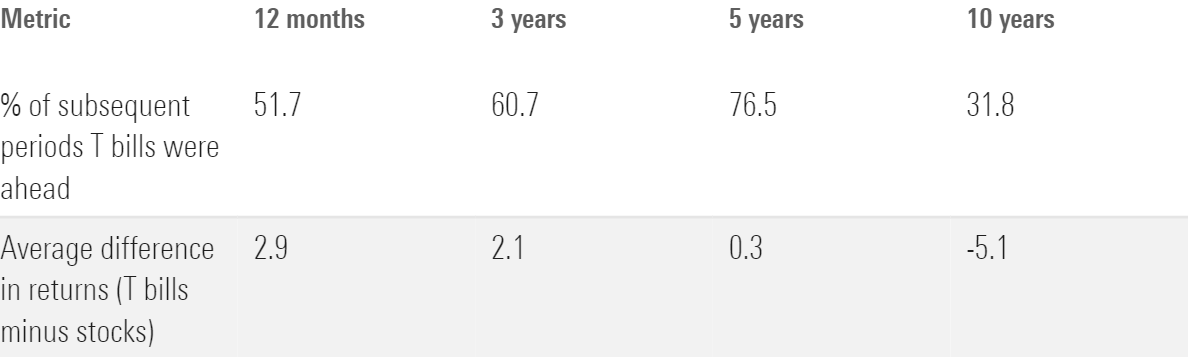
On the equity side, the most convincing results were for subsequent periods when T-bills offered a positive yield spread compared with 10-year Treasuries. Because an inverted yield curve often portends a recession, T-bills had fairly decent odds of outperforming stocks over the following one-, three-, and five-year periods. For long-term investors, though, the odds of success were much lower. On average, annualized returns for T-bills lagged stocks by about 5 percentage points over the 10-year period following a month with an inverted yield curve.
Subsequent Returns Following Positive Yield-Curve Spread (T-Bills vs. Stocks)
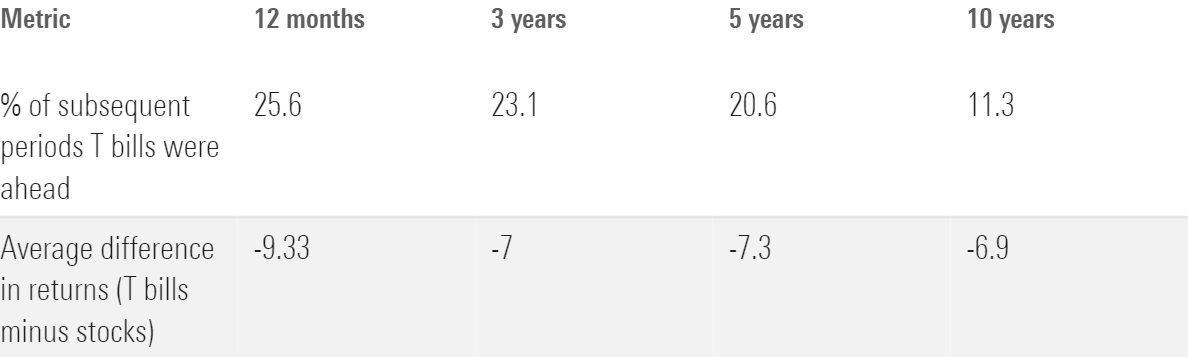
A positive inflation spread offered much lower odds for beating stocks. As shown in the table below, cash has historically lagged stocks over most of the subsequent periods based on months when T-bills offered a positive yield compared with inflation, and by a fairly wide margin.
Subsequent Returns Following Positive Inflation Spread (T-Bills vs. Stocks)
Taking refuge in cash within a portfolio’s bond allocation also typically involves an opportunity cost.
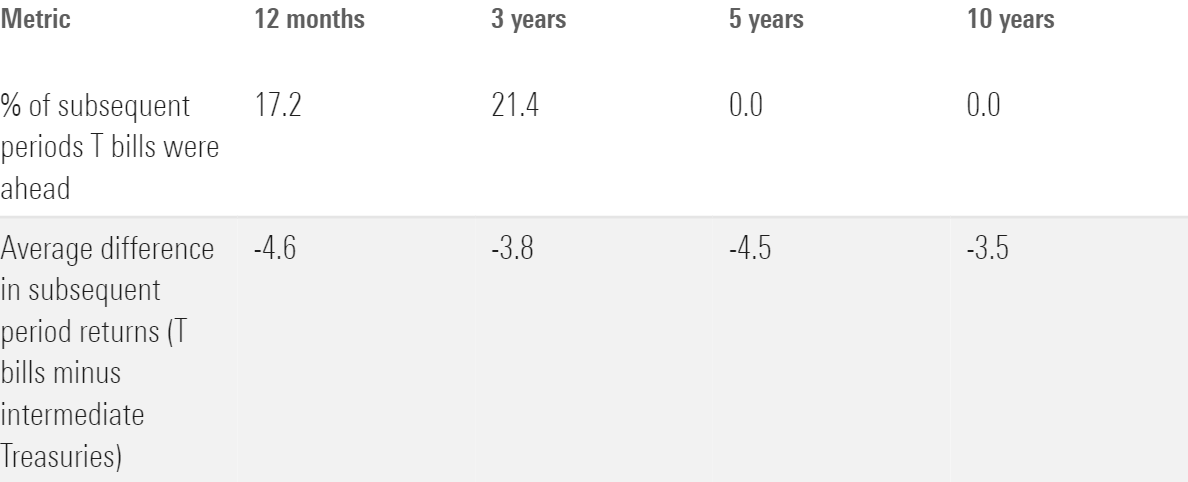
The odds of T-bills outperforming intermediate-term Treasuries following a positive yield-curve spread were relatively low, especially over longer periods. And investors holding cash gave up at least 3.5 percentage points in annualized returns, on average, over each of the four periods.
Subsequent Returns Following Positive Yield-Curve Spread (T-Bills vs. Intermediate Treasuries)
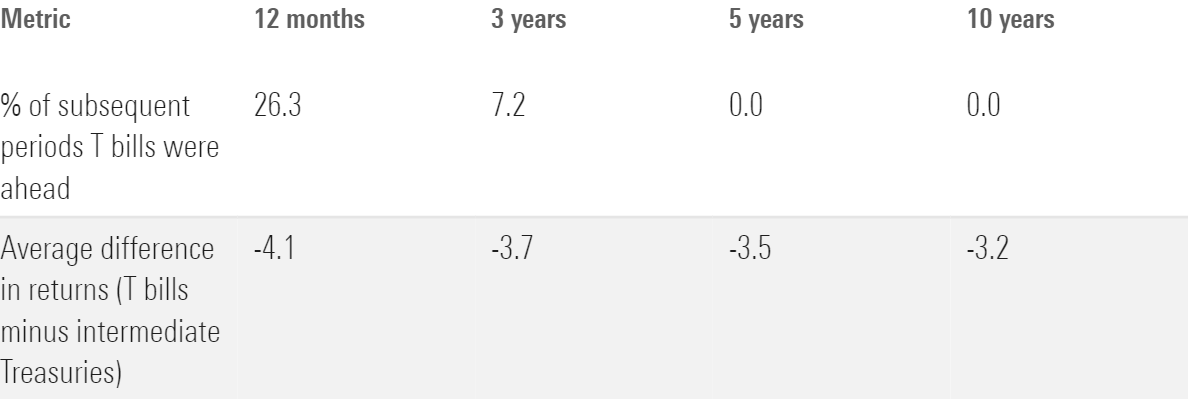
The odds were worse for periods following a positive inflation spread, as shown in the table below.
Subsequent Returns Following Positive Inflation Spread (T-Bills vs. Intermediate Treasuries)
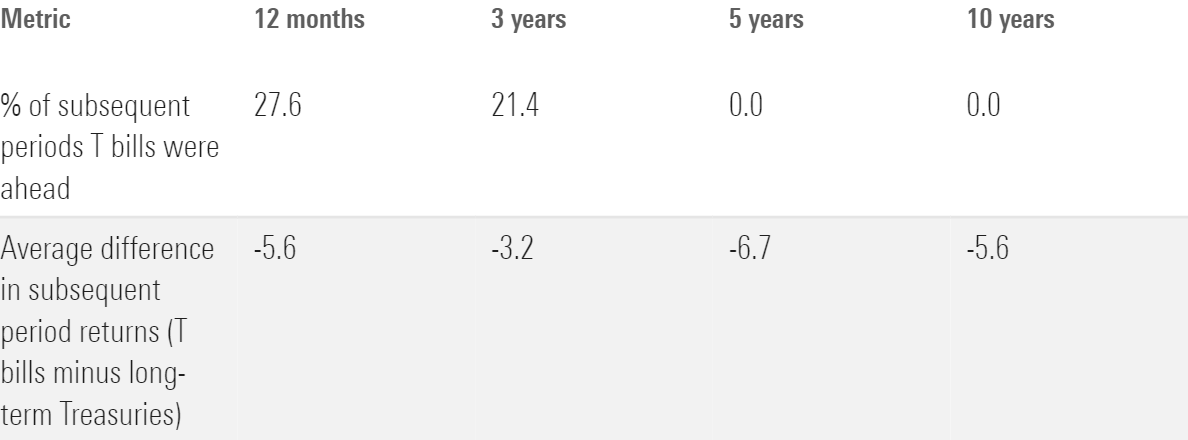
The success rate of cash compared with long-term Treasuries was similarly poor. T-bills outperformed long-term Treasuries over roughly one fifth of the subsequent 12-month and three-year periods, but none of the five- and 10-year periods.
Subsequent Returns Following Positive Yield-Curve Spread (T-Bills vs. Long-Term Treasuries)
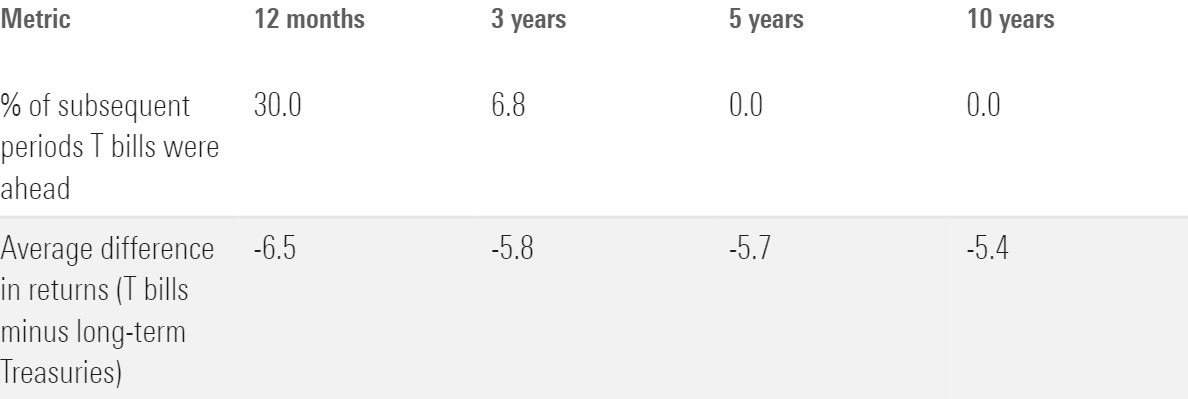
That was also true for periods following a positive inflation spread. T-bills outperformed long-term Treasuries in close to one third of the subsequent 12-month periods but had low to zero odds of success over longer periods.
Subsequent Returns Following Positive Inflation Spread (T-Bills vs. Long-Term Treasuries)
Conclusion
In the end, the fact that T-bills don’t typically produce strong long-term returns—even at times when they offer relatively attractive yields—probably seems like an obvious point. As safe assets, they’re not expected to generate strong returns. (My colleague Adam Fleck came to a similar conclusion in a recent article.) The “T-bill and chill” strategy might pay off over some shorter-term periods (as it has over the past 12 months), but it’s not a reliable way to build long-term wealth.
The author or authors do not own shares in any securities mentioned in this article. Find out about Morningstar’s editorial policies.
/cloudfront-us-east-1.images.arcpublishing.com/morningstar/MNPB4CP64NCNLA3MTELE3ISLRY.jpg)
/cloudfront-us-east-1.images.arcpublishing.com/morningstar/SIEYCNPDTNDRTJFNF6DJZ32HOI.png)
/cloudfront-us-east-1.images.arcpublishing.com/morningstar/ZHTKX3QAYCHPXKWRA6SEOUGCK4.png)
:quality(80)/s3.amazonaws.com/arc-authors/morningstar/360a595b-3706-41f3-862d-b9d4d069160e.jpg)