
What the Yield Curve Says About a Recession
And what to do about it.
/s3.amazonaws.com/arc-authors/morningstar/78665e5a-2da4-4dff-bdfd-3d8248d5ae4d.jpg)

Much has been made about an impending recession. The reasons, however, are seldom discussed, are even less understood, and do little to inform what actions investors should take (if any).
Economists often use historical information to form opinions about the direction of the economy. Those opinions aren’t built around perfect information. Markets and the economy are uncertain, so nothing is guaranteed. With history as a guide, several key signs indicate that a recession is more likely than not in the near future.
An Economic Crystal Ball
One harbinger was the return of inflation, which started ticking higher in early 2021. Prices tend to rise as demand outstrips supply. After some hesitation, the Federal Reserve started increasing its short-term policy rate. Theoretically, that makes money more expensive to borrow, a tactic that’s intended to cool down the economy and tamp down inflation. Those signs tend to align with the peak of an economic cycle, meaning economic growth should slow.
The rise in short-term interest rates created an unusual, though not unprecedented, situation in the bond market. The yield curve—which measures the yield to maturity of bonds across various maturities—sloped down at the end of July, as shown in Exhibit 1, meaning bonds with shorter maturities had a higher yield than those with longer maturities. The curve normally slopes up and to the right as investors usually demand a higher yield to bear incremental risks that occur over longer time horizons.
U.S. Treasury Par Yield Curve
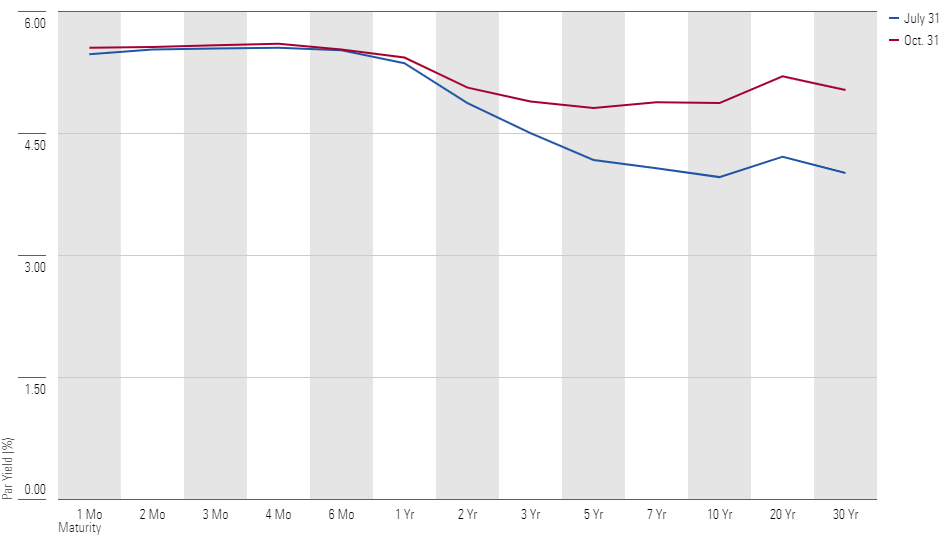
The forces behind an inverted curve come from a mix of theory and practice. Yields at the short end are closely tied to the Fed’s short-term policy rate, while those at the longer end of the curve are thought to come from the additional yield investors demand for bearing long-term risks. In today’s environment, the Fed has increased its short-term policy rate to fight inflation, and the yields on short-term Treasury bills have followed suit.
Until recently, long-term investors didn’t appear to be demanding additional yield for holding longer-term bonds; presumably, they thought inflation was a short-term phenomenon. But long-term rates have risen over the past three months, indicating an expectation that inflation will be higher for longer. The curve remains inverted, but Exhibit 1 shows it was closer to being flat at the end of October than it was three months prior.
Calculating the difference in yield, or spread, between Treasuries of different maturities is a simpler way to quantify the shape of the curve. The spread between 10-year and three-month Treasury yields is a common metric. A negative spread indicates the curve is inverted because the 10-year issue has a lower yield than its three-month counterpart.
Why do spreads, or the shape of the curve, matter? Historically, negative spreads have predicted an impending recession. The observation is credited to Duke professor Campbell Harvey, whose doctoral thesis outlined the relationship. As a predictive tool, the 10-year minus three-month Treasury spread has been nearly flawless over the past four decades (Harvey’s work goes back to the late 1960s). Exhibit 2 confirms that a recession (highlighted with gray bars) followed shortly after the spread turned negative.
10-year minus 3-month Treasury Spread
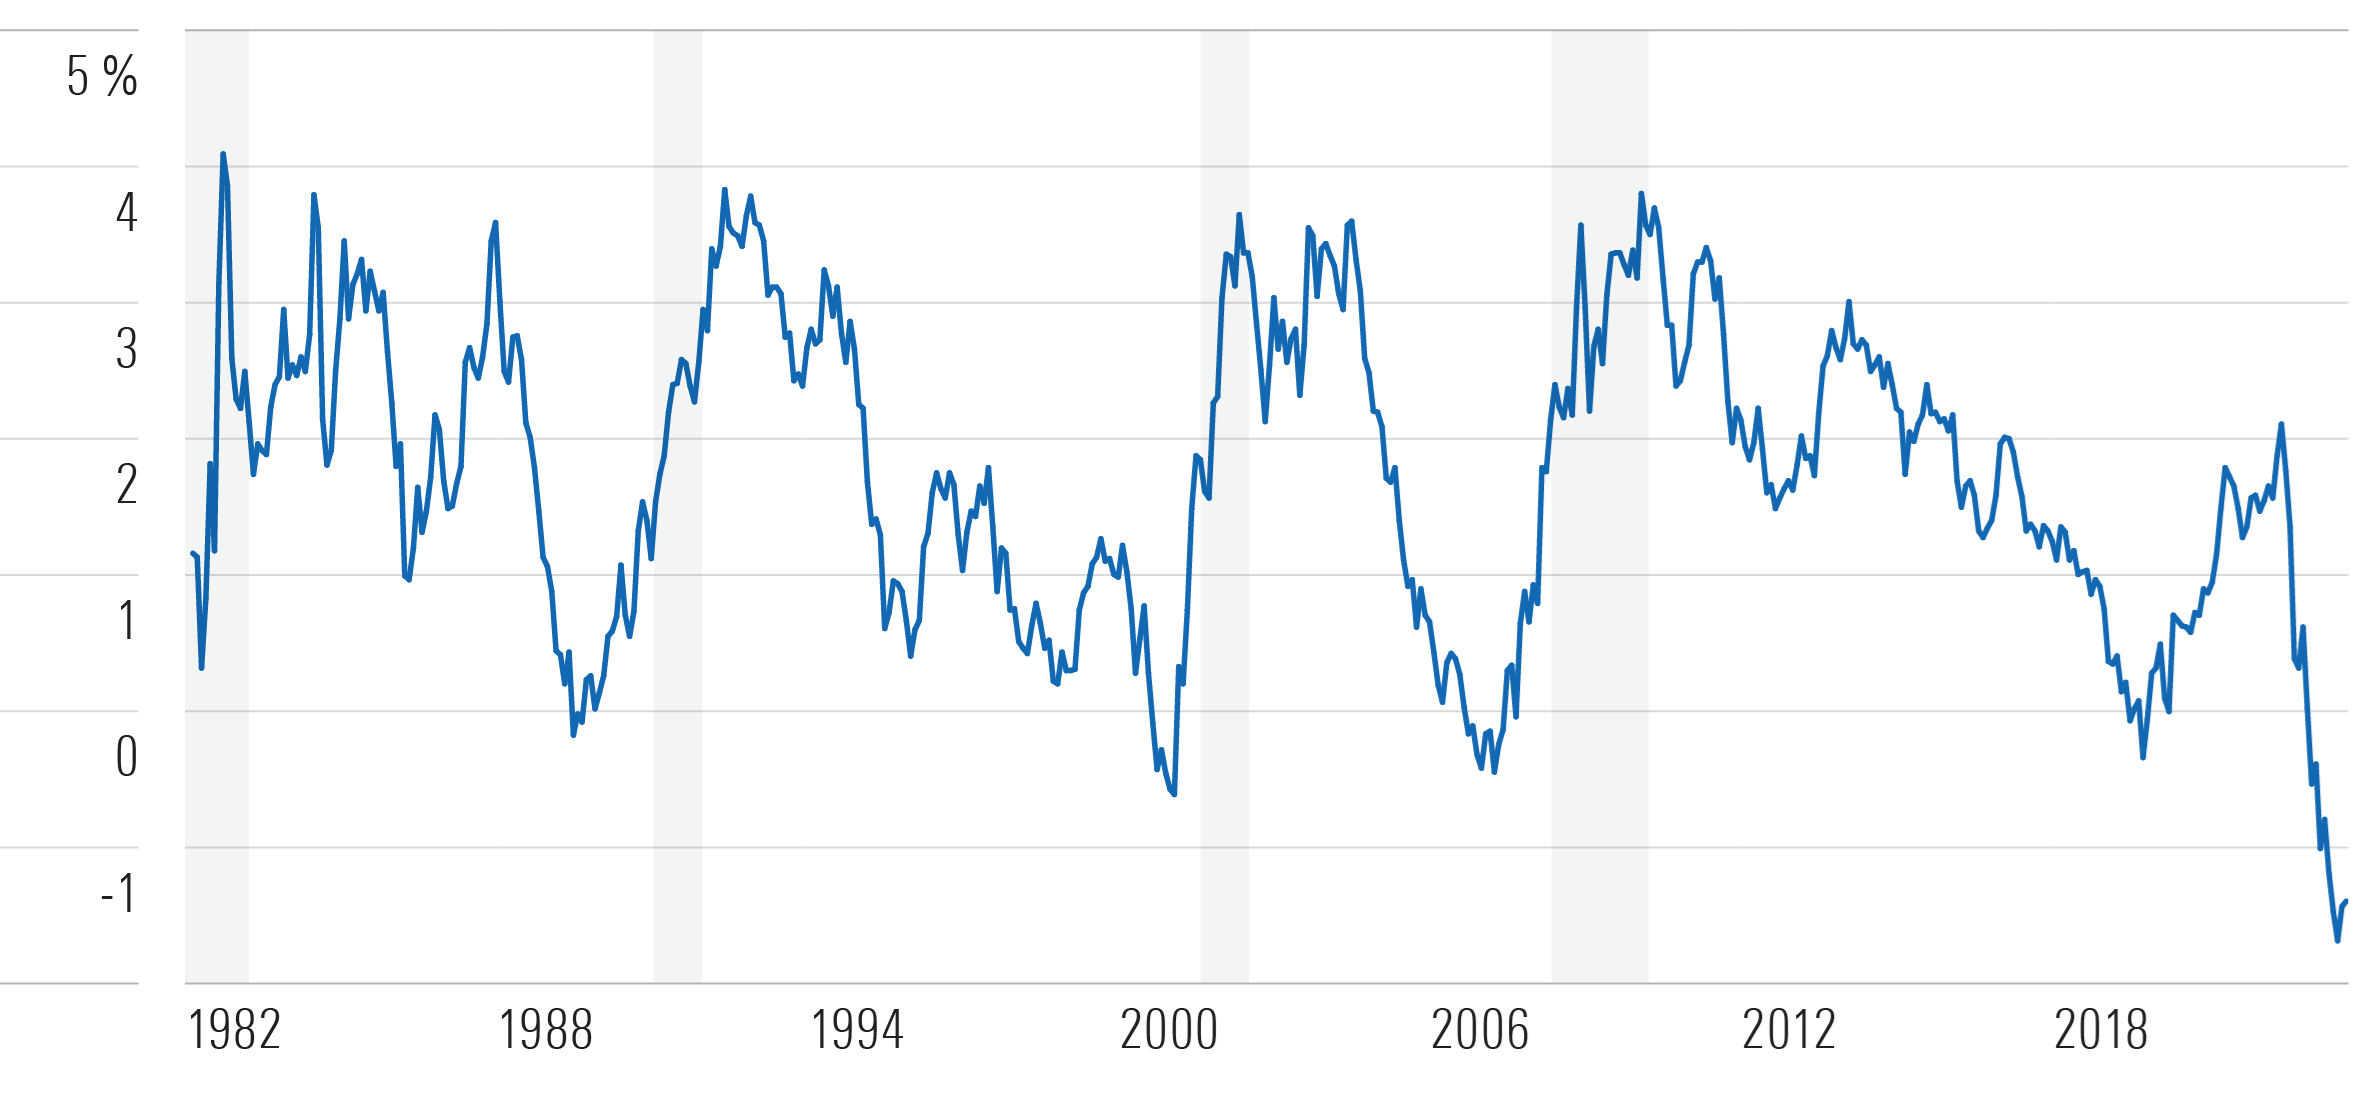
Despite its historical reliability, the 10-year minus three-month spread has its shortcomings. It’s anything but precise: The length of time from the spread turning negative to the onset of a recession varied between eight months and two years. Furthermore, the National Bureau of Economic Research typically adjusts a recession’s start date after the fact, meaning we often don’t know a recession is occurring until it’s already well underway. And an inverted curve says nothing about the length or magnitude of the ensuing recession. Some lasted more than a year, others only a few months. Some massively disrupted the economy, others made less of a dent.
Then there are unforeseen circumstances that are easily overlooked but play a major role in the economy’s short-term health. Economists were screaming about an inverted yield curve in early 2019, and the economy dipped into recession about one year later. But few, if any, saw a pandemic instigating the downturn rather than the economic cycle reaching its natural peak and subsequent decline.
Is a downturn on the horizon? Today’s yield curve and its historical record say “yes.” But that question doesn’t necessarily need to be answered to inform investment decisions.
Trading the Curve
Tactically shifting to the higher-yielding segments of the curve, or timing the curve, is one option for investors to take advantage of an inverted yield curve. And initially, that appears a logical move to make. A bond’s yield is closely tied to its expected return, so steering toward higher-yielding maturities should improve performance. In today’s environment, that means overweighting bonds at the short end of the curve and avoiding those at the long end.
What appears smart in the near term may not be prudent in the long term. Tactical trades are often dangerous because every market-timing exercise involves two decisions: Investors have to determine when to get into a trade and when to get out. In between, the market could move against the trade. In the context of shifting toward short-term bonds, the Fed could cut rates if the economy enters a recession, a move that would benefit long-term bonds more than those at the short end of the curve, creating an opportunity cost.
Instead, using an exchange-traded fund like Dimensional Core Fixed Income ETF DFCF would be the better way to go. It holds a diverse collection of investment-grade bonds from across the yield curve. The managers intentionally tilt it toward those with higher expected returns. With regards to the yield curve, that means it will typically overweight long-term bonds when the curve slopes upward and shift toward those at the lower end of the maturity spectrum as the curve flattens and inverts. At the end of October, its average maturity stood at 8.0 years, about 0.7 years lower than Vanguard Total Bond Market ETF BND, while its yield to maturity was around 0.7 percentage points higher.
On the surface, that sounds reasonable. The managers also operate within a set of constraints designed to keep risks from interest-rate changes close to the Bloomberg US Aggregate Bond Index—the benchmark underpinning BND—so it won’t make extreme bets that compromise its billing as a core long-term holding.
Tilting toward bonds with shorter maturities paid off in 2022 when the Fed began raising rates. Long-term Treasuries are more sensitive to interest-rate changes than those maturing in the near term and suffered greater declines over the past 20 months. DFCF should begin moving toward long-term bonds as their yields increase and the curve gets steeper.
Do Nothing?
Exhibit 2 contains an important observation. Bond yields and their subsequent prices go through ups and downs just like stocks, though they don’t always move in lockstep. Investors should expect the slope of the yield curve to change over time as it advances through the economic cycle. Most of the time the curve slopes up, with longer-maturity bonds providing a higher yield and expected return than those with shorter maturities.
Ideally, those tendencies should be accounted for when determining a portfolio’s long-term allocations to stocks and bonds, meaning no short-term changes to allocations should be required. Overall, bonds are far less volatile than stocks, so they primarily serve to fine-tune a portfolio’s overall volatility, not necessarily improve its total return.
The simpler way to earn higher rates of return over the long run is to revisit a portfolio’s mix between stocks and bonds. Overweighting a diversified portfolio of stocks, with their higher long-term expected returns, is a much easier path to higher returns than trying to squeeze a modestly higher rate of return from the bond market.
The author or authors do not own shares in any securities mentioned in this article. Find out about Morningstar’s editorial policies.
/cloudfront-us-east-1.images.arcpublishing.com/morningstar/G3DCA6SF2FAR5PKHPEXOIB6CWQ.jpg)
/cloudfront-us-east-1.images.arcpublishing.com/morningstar/6ZMXY4RCRNEADPDWYQVTTWALWM.jpg)
:quality(80)/s3.amazonaws.com/arc-authors/morningstar/78665e5a-2da4-4dff-bdfd-3d8248d5ae4d.jpg)