
Why We Expect Inflation to Fall in 2023
Wondering when inflation will go down? Help is on the way.
/s3.amazonaws.com/arc-authors/morningstar/010b102c-b598-40b8-9642-c4f9552b403a.jpg)
Inflation in 2022 reached the highest level in over 40 years. But we expect inflation to fall dramatically over the next year.
Understanding why inflation will fall requires understanding why inflation became so bad in the first place. Over 2021 and 2022, strong consumer demand ran into a brick wall of supply constraints, causing prices to explode in many industries, especially food, energy, and durable goods.
But demand is cooling off, thanks greatly to the Federal Reserve’s interest-rate hikes. Just as importantly, supply constraints are disappearing. With the main causes of high inflation now running in reverse gear, the economy is set to receive a large deflationary impulse.
After peaking at 6.2% in 2022, we expect inflation to fall to 3.7% for 2023. Over 2024 to 2027, we expect inflation to average just 1.8%—below the Fed’s 2.0% target.
PCE Inflation (%)
Inflation Still Heavily Driven by a Few Categories
The postpandemic inflationary surge began with only a handful of spending categories. Excess inflation (the cumulative difference versus prepandemic trend) was 6.8% in the second quarter of 2022. Durable goods, energy, and food at home accounted for 70% of excess inflation at that stage, despite being only 20% of total consumption.
Durable goods prices were driven up by the semiconductor shortage and other supply constraints, along with a surge in demand. Energy prices were driven upward by the unexpectedly strong postpandemic recovery in oil demand, along with sanctions on Russia because of the war in Ukraine. Food prices were heavily influenced by energy (owing to transport costs).
PCE Excess Inflation by Category
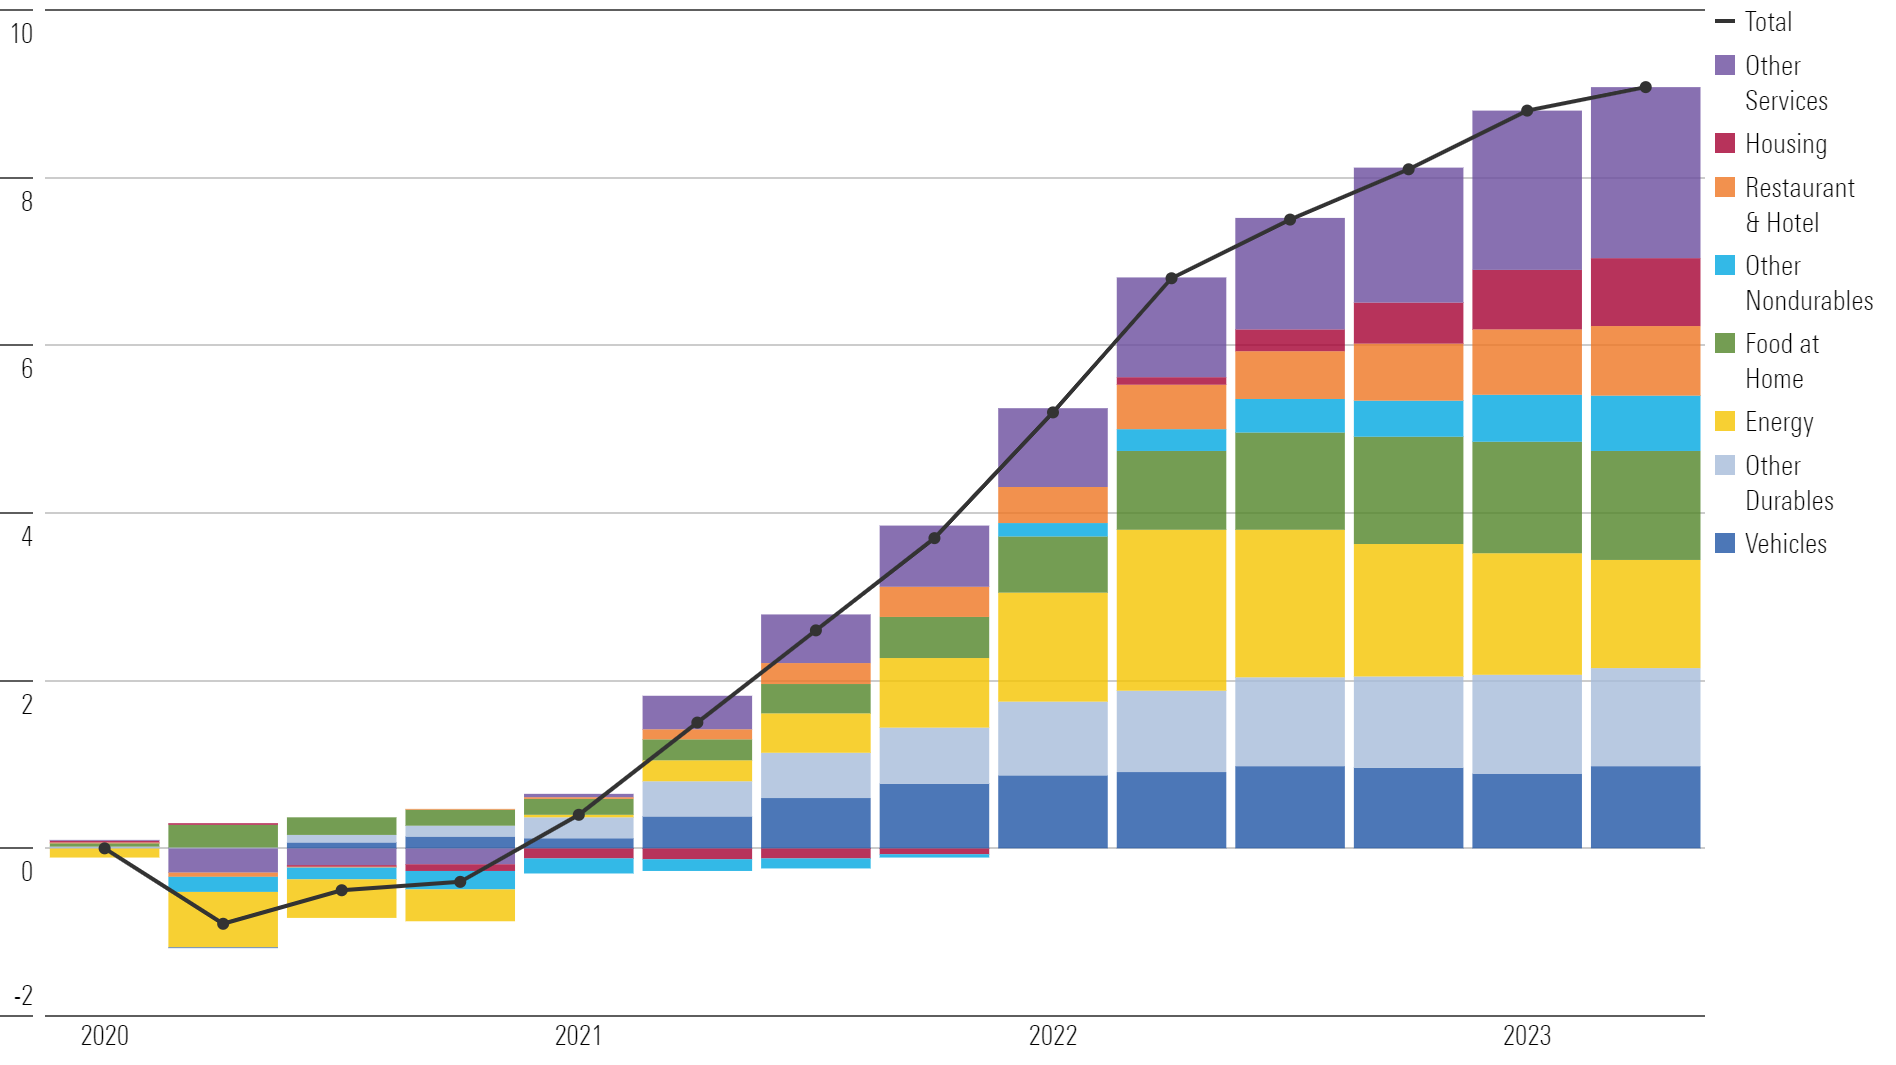
The very same categories that drove the inflationary surge in 2022 have helped to drive inflation back down in 2023. As supply constraints have alleviated, price spikes for various goods have unwound, generating deflation. This has occurred most dramatically with energy prices, but it’s starting to play out in food and durable goods prices as well.
Inflation has broadened into other spending categories in 2023, somewhat offsetting the deflationary impulse from lower energy prices. We think this likely represents a one-time “catch-up” in pricing for industries that missed the initial inflationary surge in 2022 (and, hence, have seen their costs rise in excess of revenue). But we don’t think that this will become persistent, broad-based inflation as seen in the “Great Inflation” of the 1970s.
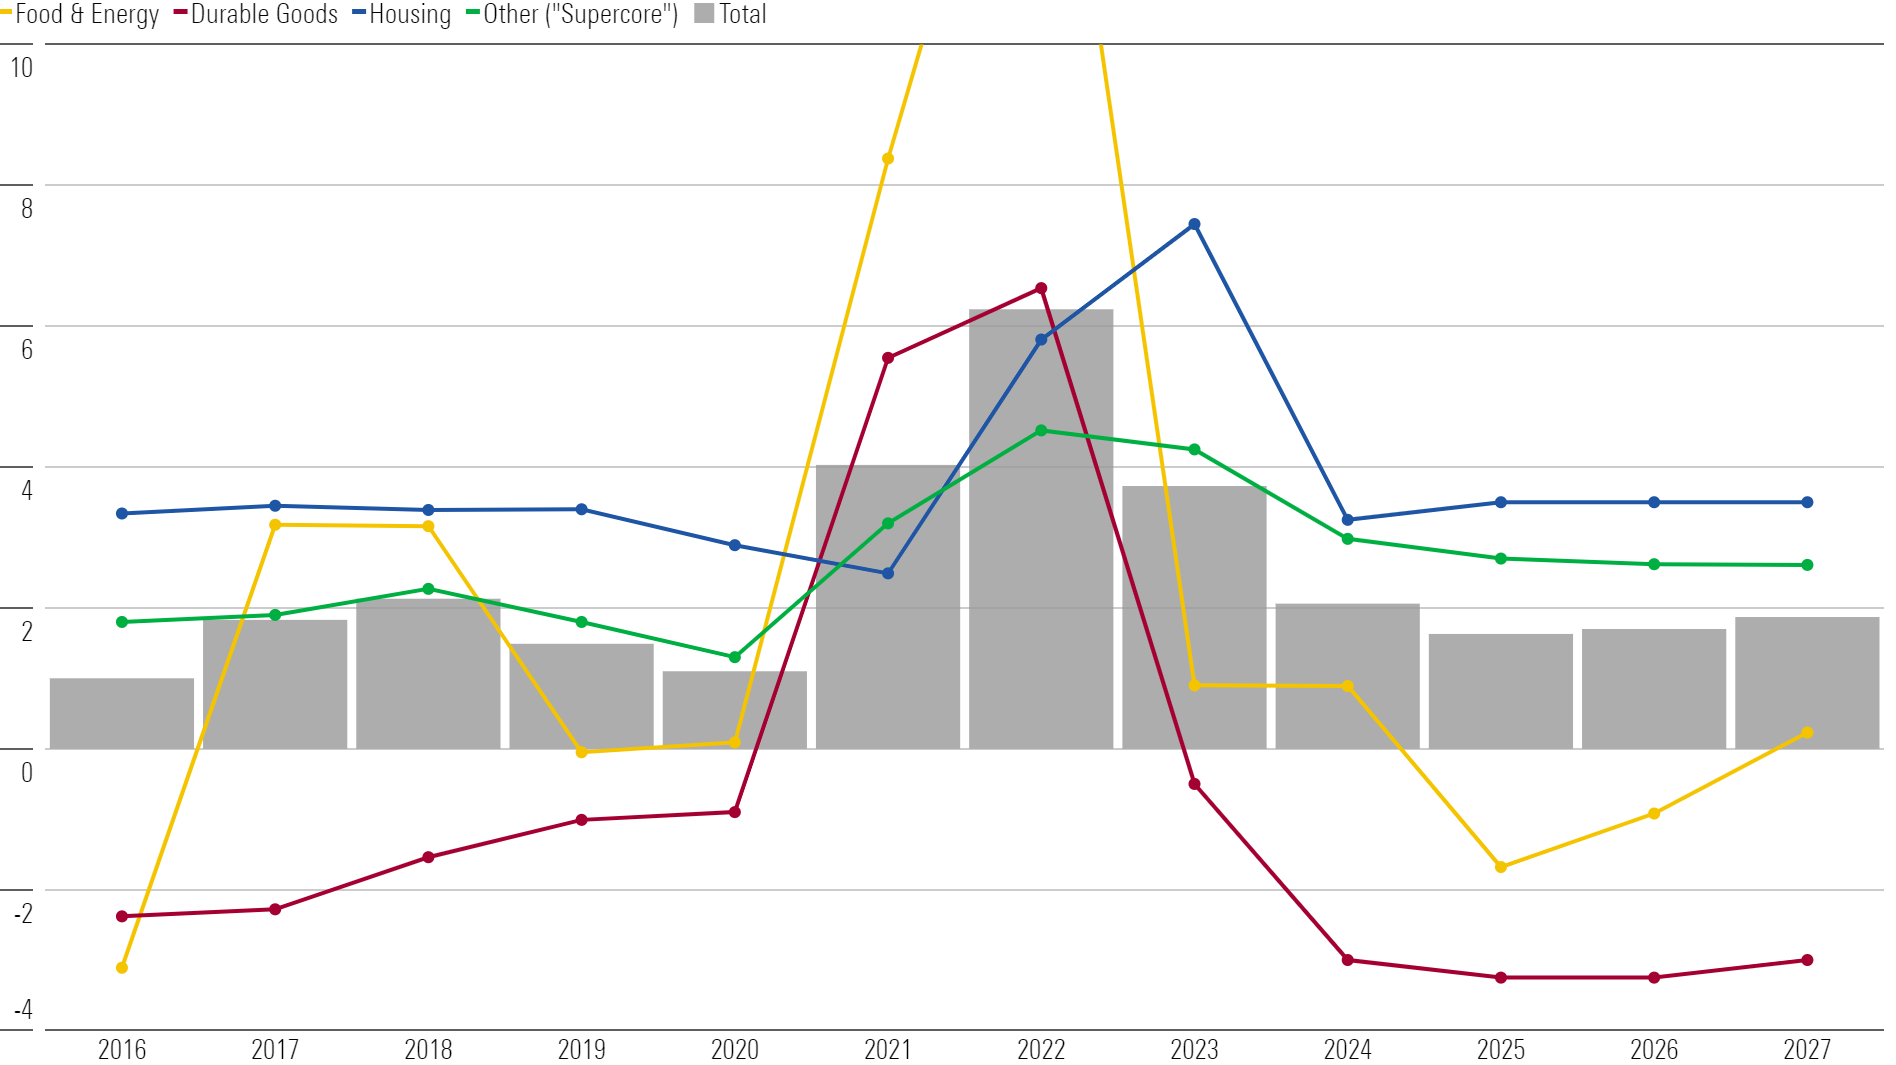
We Forecast Inflation for 2023-27 From a Bottom-Up Perspective
Given the role of industry-specific shocks, we forecast inflation using a bottom-up methodology.
We’re projecting large deflation in prices for durable goods, food, and energy over 2023-27.
- For durable goods, the resolution of the semiconductor shortage should play a large role in expanding supply. A normalization of consumer spending mix will also shift demand away from durables (and other goods) and back into services.
- For food and energy, prices should subside as these industries adjust to disruption from the Russia-Ukraine conflict and other factors.
We don’t expect the price spikes in energy and durables to be replaced by new problems elsewhere in the economy. We expect moderate wage growth and the absence of any long-lasting supply disruptions to keep general inflation at restrained levels. Inflation expectations (which can fuel high inflation in a self-fulfilling prophecy) also look restrained.
Fed tightening will cool off the overall economy substantially in 2023 and 2024, extinguishing the inflationary fire before it gets out of control.
PCE Inflation Forecast: Key Components (% Growth)
Supply Chains Are Healing as Demand Normalizes and Capacity Expands
A broad array of production and logistical disruptions have contributed to inflation in durables and other parts of the economy. But supply chains are healing as demand normalizes and capacity catches up. The Federal Reserve Bank of New York’s Global Supply Chain Pressure Index (which captures ocean shipping costs and delivery times, among other indicators) is now, stunningly, showing looser supply chain conditions than before the pandemic.
Global Supply Chain Pressure Index (NY Fed)
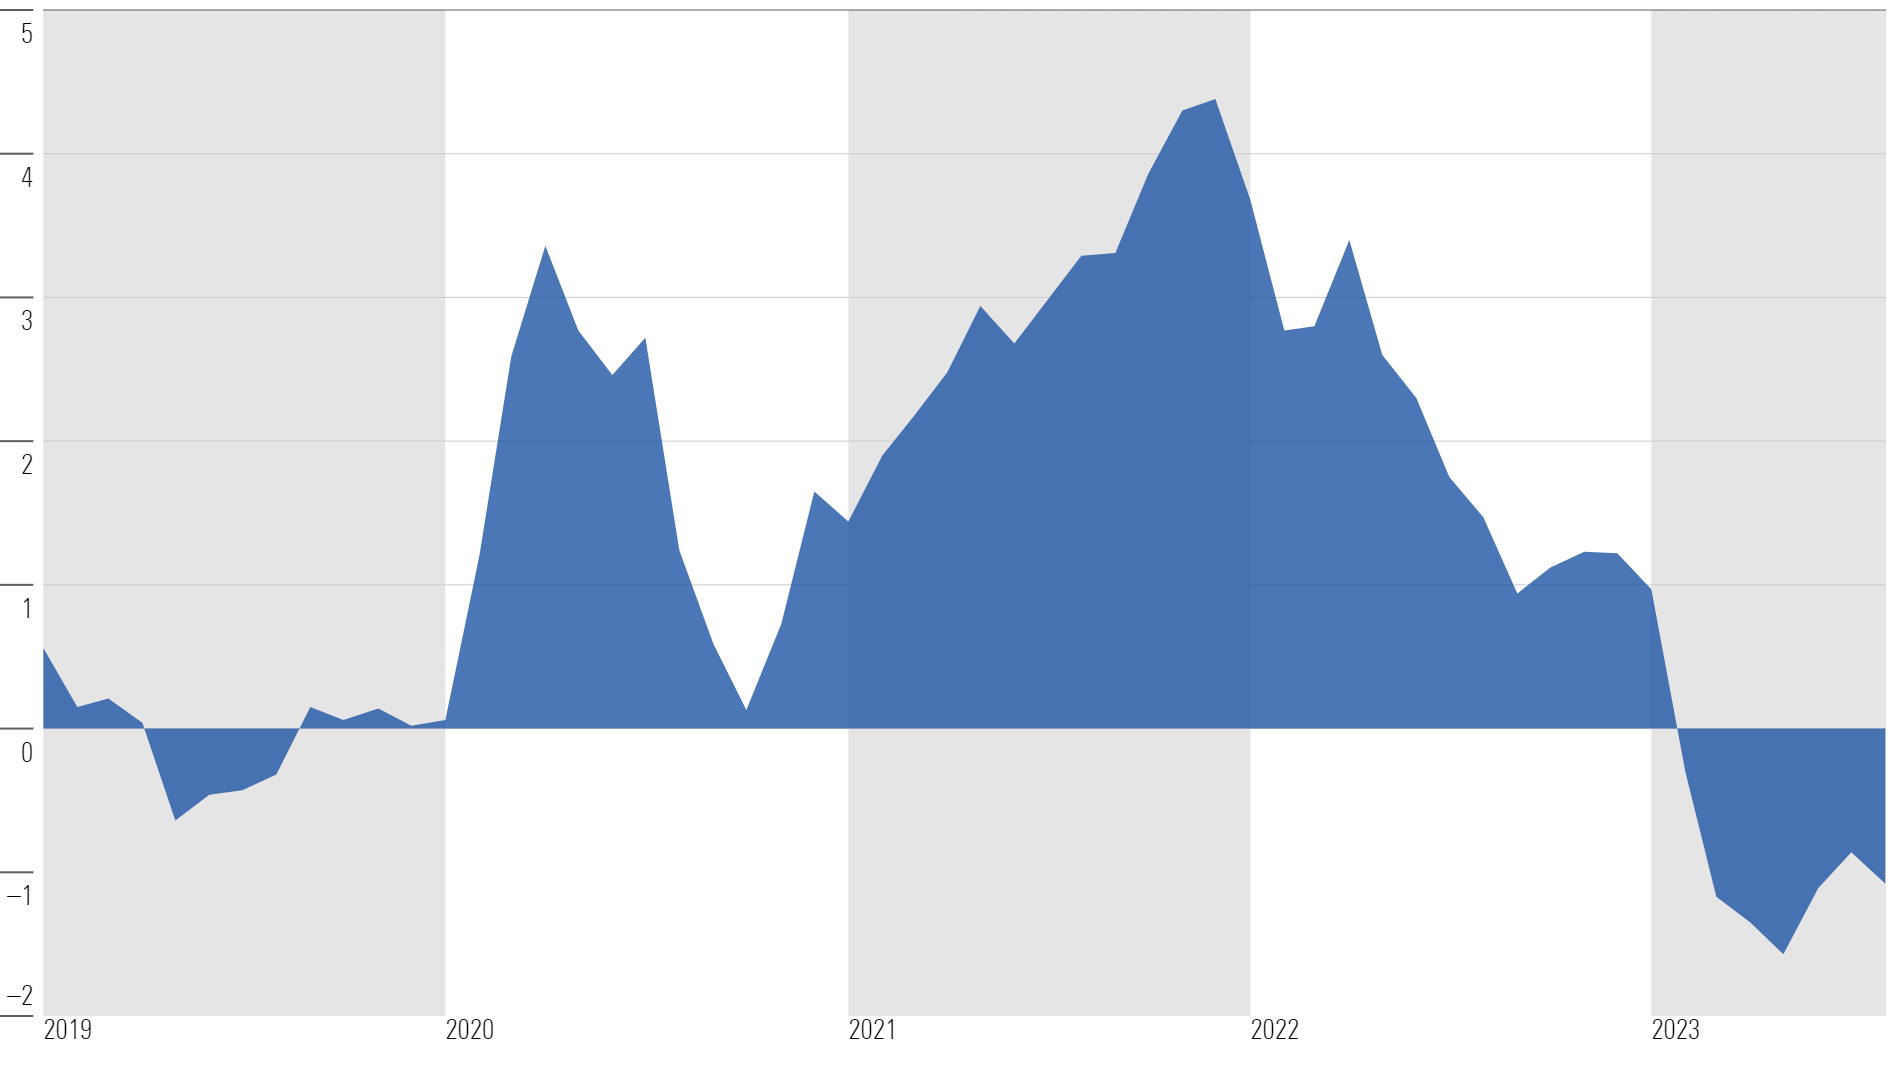
There’s more help on the way. As one indicator on the logistics side, there are enough container ships set to be delivered over the next several years to expand the current fleet by 30%. On the manufacturing side, capacity is also expanding in the United States and other major economies (most notably China).
Beyond these broad supply chain disruptions, perhaps one half of the runup in durable goods prices looks to be a result of the semiconductor shortage alone. Semiconductor manufacturing capacity is frantically expanding, with 2022 capital expenditures having soared 90% above prepandemic levels. It takes a while to ramp up capacity, but it is now a question of when—not if—the semiconductor shortage will be cleared.
Inflation in 2023: This Is Not the 1970s’ Oil Price Shock
With inflation in 2022 reaching its highest since 1981, many have drawn an analogy to the inflation of the 1970s, suggesting inflation will remain stubbornly high for the next decade. But not all bouts of high inflation were as long-lasting as in the 1970s.
One critical difference between today’s episode and the 1970s is the nature of the supply shocks, particularly regarding energy prices. Morningstar’s energy team forecasts oil prices to fall to $55 per barrel in 2026 (West Texas Intermediate)—about where prices were in 2019 before the pandemic. That’s down from an average of $78 per barrel in 2023 for the year to date.
Oil prices have jumped owing to sanctions on Russia, and global suppliers have been caught off-guard by the strength of the postpandemic recovery. But we expect producers to steadily ramp up production until prices fall back to the marginal cost of production, which we assess at $55.
Additionally, the recent plunge in natural gas prices will steadily roll over into lower household utility bills over the next year or so.
The contrast with the 1970s’ oil price shock could not be greater. Oil prices first tripled in 1973 and ended the decade up 11 times versus 1970 levels. There were short-run disruptions that contributed to that surge, but the long-term story was the awakening of OPEC’s market power, which never returned to the rapid production growth exhibited in the 1960s. Also, other cheap sources of crude had been tapped out by this time, necessitating a shift to offshore drilling and other, more expensive sources.
These kinds of secular forces driving higher prices explain why the 1970s’ oil shock never fully receded—but secular forces aren’t the main drivers in today’s oil price surge.
Housing Market Inflation Will Cool Off
We expect housing’s contribution to inflation to peak in 2023 and fade away entirely over the next year or so.
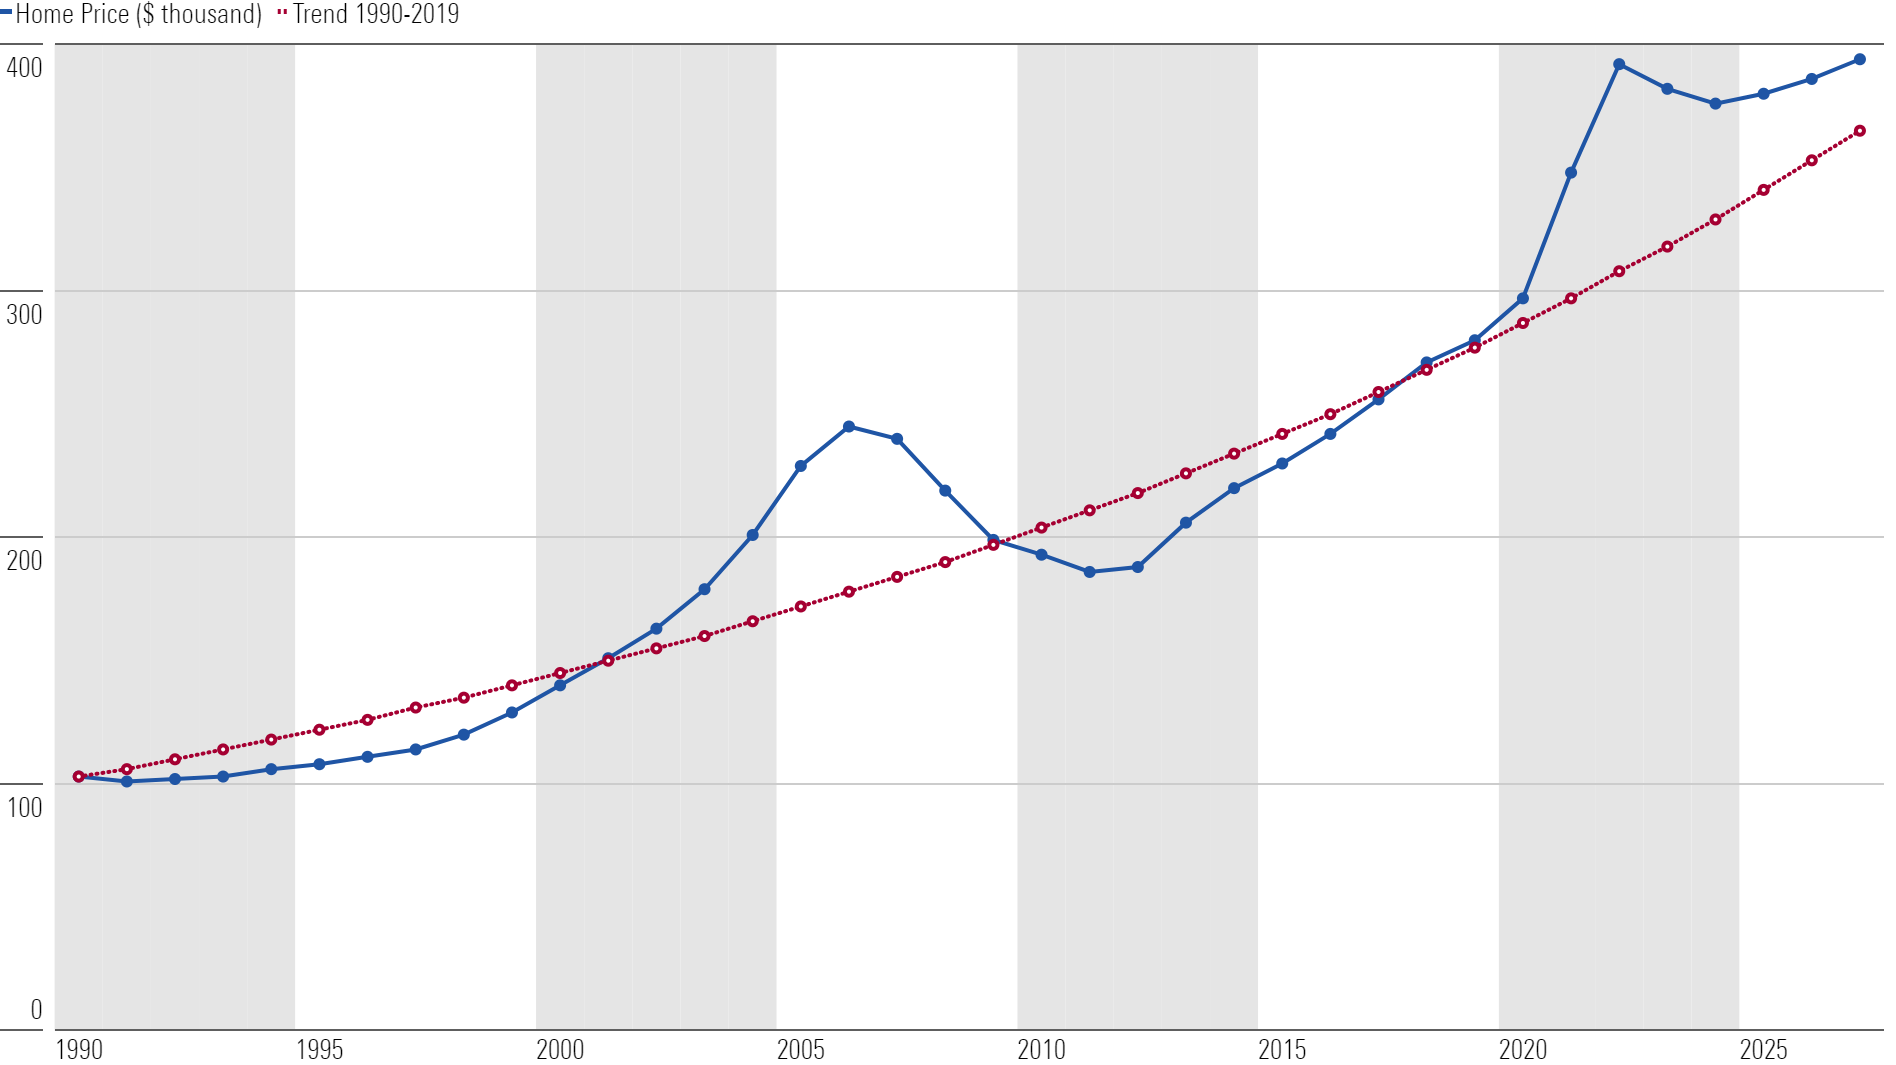
The Fed’s interest-rate hikes have thrown cold water on housing demand. In conjunction with the runup in home prices, the jump in mortgage rates has driven housing affordability (in terms of the median mortgage payment to household income ratio) to its worst level since 2007.
Our housing team projects an 18% drop in housing starts in 2023, driven by weaker demand. But the supply of housing will continue to expand at a brisk pace even as starts fall, given the huge stockpile of uncompleted housing. All of this will put continued downward pressure on housing prices and rents.
We expect home prices to fall by 2.5% in 2023 and be essentially flat for several years afterward. This will return the CPI shelter index to normal.
Of course, while falling housing prices equal good news for inflation, they will mean pain for homeowners who assumed prices would keep rising when planning out their personal finances.
Median Home Price vs. Trend
A previous version of this article appeared on May 26, 2023.
The author or authors do not own shares in any securities mentioned in this article. Find out about Morningstar’s editorial policies.
/cloudfront-us-east-1.images.arcpublishing.com/morningstar/GJMQNPFPOFHUHHT3UABTAMBTZM.png)
/cloudfront-us-east-1.images.arcpublishing.com/morningstar/VUWQI723Q5E43P5QRTRHGLJ7TI.png)
/cloudfront-us-east-1.images.arcpublishing.com/morningstar/XF7WENSYN5BFBFLPPFH7BJYUHE.png)
:quality(80)/s3.amazonaws.com/arc-authors/morningstar/010b102c-b598-40b8-9642-c4f9552b403a.jpg)