
Create Your Own Category
A case study of ARK Innovation ETF and its aggressive-growth peers.
/s3.amazonaws.com/arc-authors/morningstar/5dd7882e-0413-4eb1-b7f0-3d3ed94328e7.jpg)
Morningstar Category classifications are outstanding for helping investors make meaningful comparisons between strategies, identify top-performing funds, assess a fund’s potential risks, and build well-diversified portfolios.
But as good and versatile as they are, they won’t describe each and every fund neatly or necessarily provide an exhaustive list of comparable investments.
I often deal with this issue in my coverage of ARK Innovation ETF ARKK, a benchmark-agnostic aggressive-growth strategy that bears little resemblance to any category’s typical fund. The portfolio is top-heavy, makes huge industry bets, and has historically invested in companies of virtually every size.
Below is the Morningstar Style Box with holdings maps plotted for ARKK and the Russell Midcap Growth Index (the mid-growth category’s benchmark).
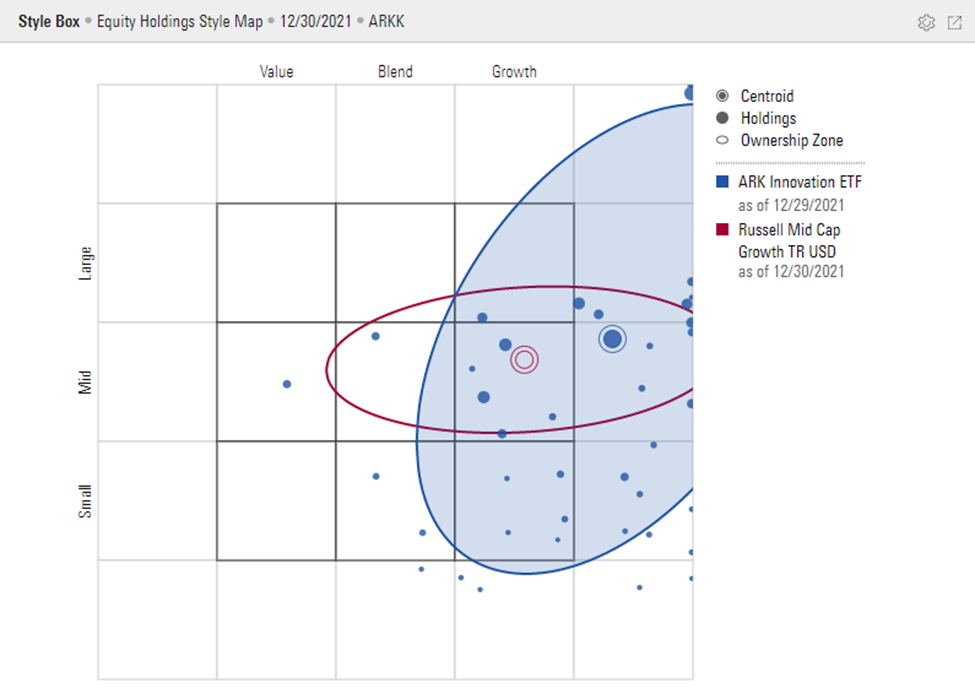
This graphic is from the Workspace module of Morningstar Direct’s desktop version for Windows. For quickest summoning, right-click on the subject fund (ARKK, in this case) -> press I to select Interactive Reports -> press S twice to cycle to Style Box -> press Enter. To show ARKK’s holdings, click the gear icon to the top right of the panel -> click Output -> select Holdings.
A weighted average of its holdings' market caps reveals a center of gravity in the mid-cap segment of the style box.
But it is an uncomfortable fit for at least two reasons: ARKK’s Ownership Zone extends far above and below that of the category benchmark, which mostly stays in the mid-cap segment of the style box (the fund’s Size Dispersion Metric, which describes the variance of market caps among its holdings, ranks among the category’s highest); and its emphasis on aggressive-growth stocks stands out. (See the string of holdings seemingly stuffed against the far-right wall of the box? They reside on the furthest edge of the High Growth column of the style box.)
Over the past year, we’ve seen ARKK plunge nearly 50% as the category slid 6%. My analytical challenge is to find out whether ARKK’s investment style explains its underperformance. Two questions worth asking: (1) Have funds’ value-growth scores (which determine their horizontal placement within the style box) shown to bear a statistically significant relationship to their performance over the period? (2) What have been the results of other aggressive-growth funds like ARKK?
Here's how I tackled these questions in my recent piece, "ARK's Claims of an Anti-Innovation Market Ring Hollow" [available in Direct Research Portal].
Filter for Relevant Funds
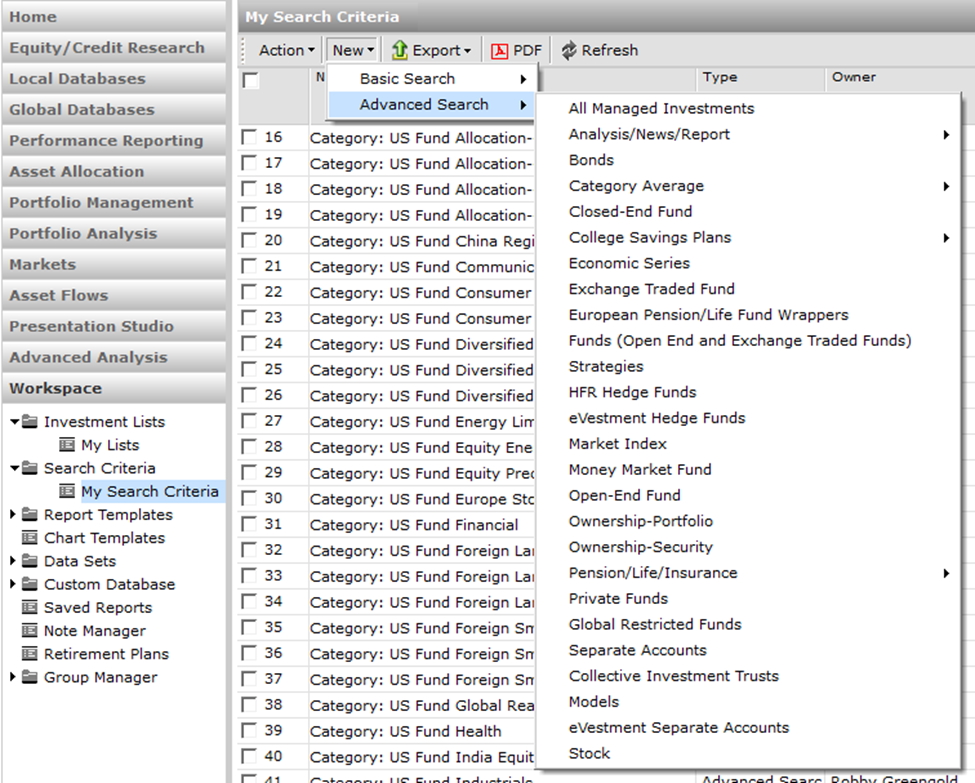
Within the Workspace module of Morningstar Direct, I started by building a new search using My Search Criteria. Within the menu (see screenshot below), I chose as my universe open-end and exchange-traded funds, which I consider more relevant than just the traditional open-end fund universe because it's more comprehensive.
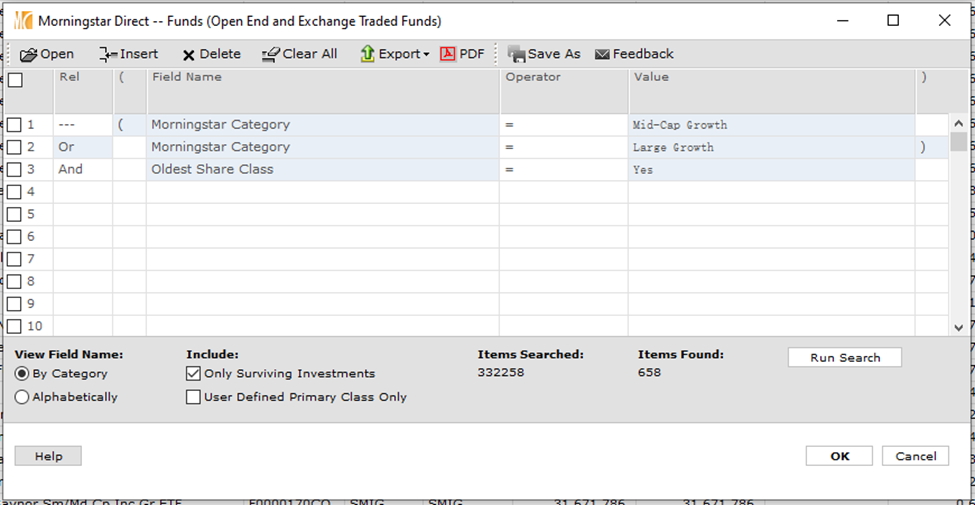
Given ARKK’s heavy allocations both to mid- and large-cap stocks, I constructed a screen that would surface funds from both the mid-growth and large-growth categories. To retrieve fund-specific results, I additionally filtered for funds’ oldest share classes. (Without this step, the results would have included funds’ multiple share classes, most of which would not be useful for this exercise.) Another filter I often apply (but didn’t for this project) is on actively managed funds. To include or exclude passive funds, choose yes or no in the Index Fund field.
Hitting Run Search showed there were 658 funds fitting my description. I kept the “Only Surviving Investments” box checked because I wasn’t interested in merged or liquidated funds; I would have unchecked the box if I thought survivorship bias could significantly skew the results.
I pressed OK to see the list of search results.
Summon Funds’ Value-Growth Scores
I then needed to ensure I had visible the data points most interesting for this analysis:
- Value-Growth Score (Long)
- Total Return 1 year (Daily) USD
I didn’t have either and needed to select them using the Edit Data button on the toolbar.

If you search for Value-Growth Score, you’ll notice two identical-looking options.
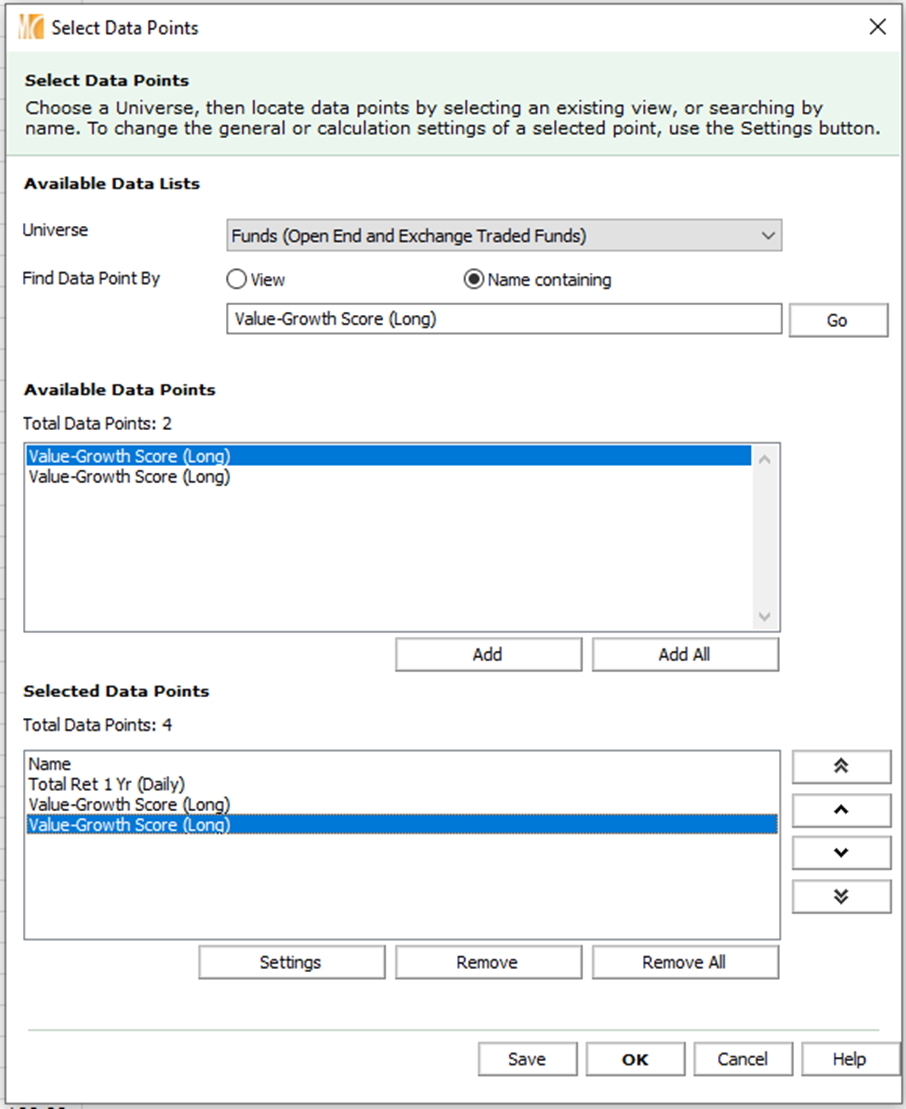
The top one contains the data point’s historical time series; the one below reflects only the most current portfolio. For simplicity, let’s pretend I used the current portfolio data as a proxy for each fund’s value-growth exposure throughout the period. (In the ARKK write-up, I actually used the time series and averaged each portfolio’s value-growth score over the past 12 months, which more precisely captures the degree to which this factor correlated to its returns over the period).
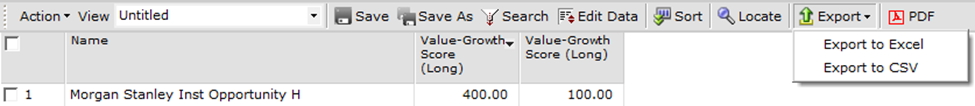
I pressed the Add button twice to retrieve two identical versions of the data point. It’s useful to have one show the raw value of the data point and another show its percentile rank within the list of results. To display the percentile rank, select the data point and click Settings -> within the Display options menu dropdown, select Decile (ascending). Press OK to exit the Data Settings menu, and OK to exit the Select Data Points menu.
I then saw the list of funds with their trailing one-year returns, raw value-growth scores, and value-growth scores displayed as percentiles relative to the scores found in the full list. I exported the list to CSV using the dropdown menu.
I opened the file in Excel. Using the AVERAGEIFS function, I found the average return for funds with value-growth scores ranking in the list’s top decile, the most relevant competitors to ARKK. Applying the same procedure to all deciles produced this data, which I placed in a simple column chart.
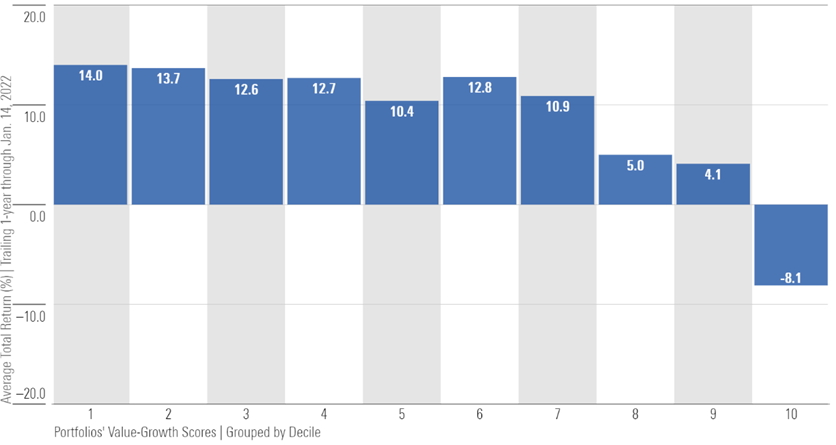
It shows that aggressive-growth funds like ARKK lost around 8%, on average.
Using the columns of the funds’ total returns and raw value-growth scores, I found it helpful to additionally visualize the data on a scatter plot with a linear trend line. It shows a statistically significant relationship between the two variables and the variance of returns for funds at each value-growth score.
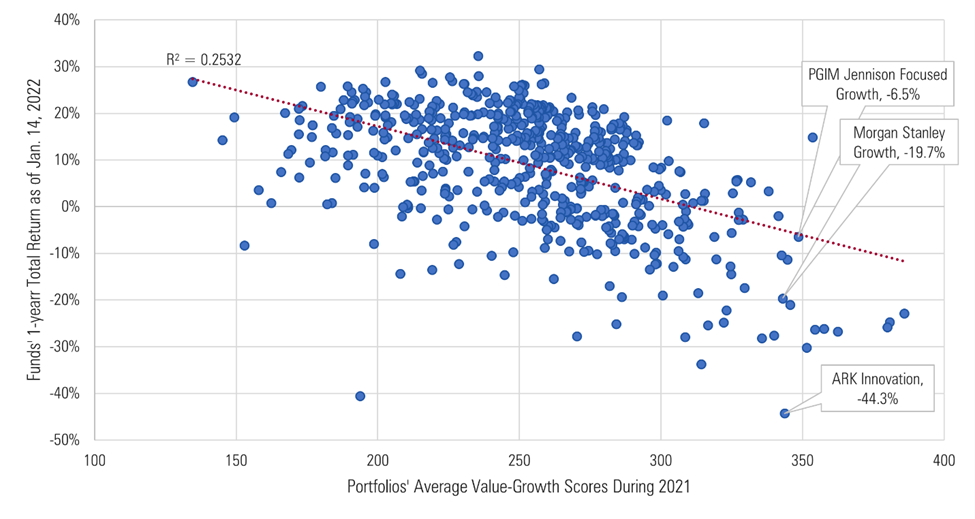
At ARKK’s value-growth score of around 350 or higher, comparable funds showed far more resilience and underscored my finding that ARKK’s severe losses stood out.
/cloudfront-us-east-1.images.arcpublishing.com/morningstar/FGC25JIKZ5EATCXF265D56SZTE.jpg)
/d10o6nnig0wrdw.cloudfront.net/04-25-2024/t_d30270f760794625a1e74b94c0d352af_name_file_960x540_1600_v4_.jpg)
/cloudfront-us-east-1.images.arcpublishing.com/morningstar/DOXM5RLEKJHX5B6OIEWSUMX6X4.png)
:quality(80)/s3.amazonaws.com/arc-authors/morningstar/5dd7882e-0413-4eb1-b7f0-3d3ed94328e7.jpg)