
When It Comes to Passive Bond ETFs, the Devil Is in the Details
Small nuances in the indexes they track can cause unexpected behavior during stress markets.
/s3.amazonaws.com/arc-authors/morningstar/c00554e5-8c4c-4ca5-afc8-d2630eab0b0a.jpg)
Broad-market index funds have a reputation for being inexpensive and straightforward. Yet, fees are not the only differentiator for pure passive strategies within the same asset classes. Seemingly similar indexes can have meaningfully different portfolios, as evident from the examples of core and investment-grade corporate bond indexes below.
Examining Two Aggregate Bond Indexes
The two largest core bond funds in the market, Vanguard Total Bond Market ETF BND and iShares Core US Aggregate Bond ETF AGG, technically track different indexes. The iShares fund tracks the Bloomberg U.S. Aggregate Bond Index, while the Vanguard fund tracks the float-adjusted version of the same index, the Bloomberg U.S. Aggregate Float Adjusted Index. For fixed-income securities, adjusting for float means excluding the amount held by central governments (the Federal Reserve in this case) from the market value used in weighting calculations.
Despite the naming conventions, both funds float-adjust Treasuries. The float-adjusted index further excludes other bonds held by the Fed, including mortgage-backed securities. When the Fed bought up MBS after the 2008 global financial crisis, it created a noticeable divergence in the composition of the two indexes.
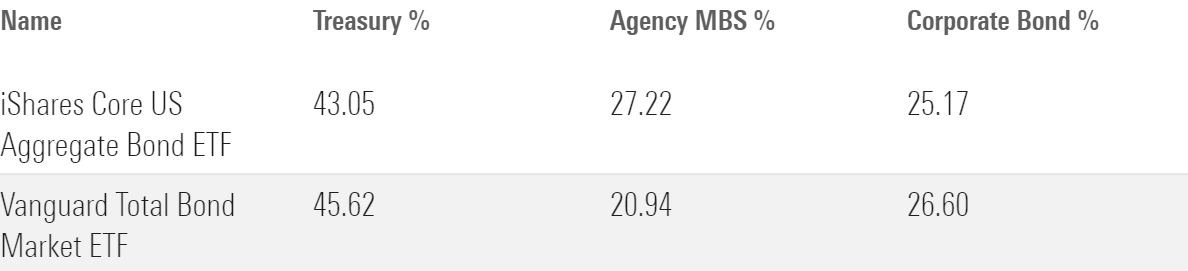
Because of the float adjustment, BND often allocated around 5 percentage points less of its assets to agency MBS than did AGG. To compensate, it overweighted other sectors in its portfolio, most notably Treasuries. The exhibit below displays notable sector differences between the two funds. BND’s agency MBS underweighting has increased since late 2020, standing at around 6 percentage points as of May 2023. This translated to a 2.6-percentage-point overweighting of Treasuries, though this number climbed up to as high as 5 percentage points during the coronavirus pandemic.
Sector Differences Between the Two Aggregate Bond Indexes
The sector differences will likely persist because MBS are now a standard part of the Fed’s toolkit for major operations. As of June 2023, the Fed held more than $2 trillion in agency MBS. The total outstanding amount in the market was $10.7 trillion by the end of 2021 (the most recent figure by Sifma). The Fed’s appetite for MBS swelled during episodes of quantitative easing since the global financial crisis, such as during late 2012 and throughout 2020 and 2021. The Fed also started buying corporate bonds at the height of the pandemic’s shock, directly holding $5 billion in corporates by the end of its operations in mid-2021. While this figure was negligible compared with the $10 trillion corporate bond market, this precedent opens the door for future operations. This creates an uncertain future for the sector profile of BND versus AGG.
The impact of these sector differences does not weigh heavily on the two funds’ credit quality, as both Treasuries and agency MBS are backed by the government. However, the fund’s average duration tends to be longer than that of AGG by a few months.
The differences between the indexes have shown up in the relative performance of the two portfolios during stressed markets, though the magnitude is small. When yields rose, the float-adjusted index underperformed. Two of these instances stood out in the next exhibit, which displays the relative performance of the Bloomberg U.S. Aggregate Float-Adjusted Index against the Aggregate Index.
Rolling Three-Year Excess Returns Against the Bloomberg U.S. Aggregate Bond Index
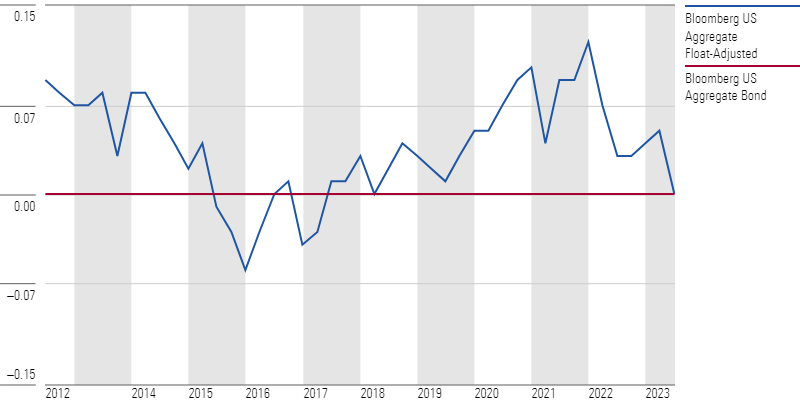
The first instance took place between May 2013 and December 2015, when two-year Treasury yields steadily climbed higher as the Fed started tapering its quantitative easing program and subsequently announced an interest-rate increase. The second instance took place during the rate-driven meltdown in 2022, preceded by a short blip in March 2021 when the market prematurely predicted the end of the Fed’s accommodative policies.
On the other hand, the float-adjusted index benefited nicely from dovish market sentiment and decreasing yields in 2019. It also outperformed the non-float-adjusted index when investors fled to Treasuries during major credit shocks, like the pandemic-driven selloff in 2020. Overall, from its inception in June 2009 through June 2023, the float-adjusted index outperformed the Aggregate Index by 4 basis points annualized with slightly higher volatility.
Gradients of Credit Risk
While the differences between the two aggregate bond funds have not been severe, funds carrying higher credit risk have seen a starker divide. Consider this trio of broad corporate bond exchange-traded funds: iShares iBoxx $ Investment Grade Corporate Bond ETF LQD, iShares Broad USD Investment Grade Corporate Bond ETF USIG, and Vanguard Total Corporate Bond ETF VTC. While they all target the investment-grade corporate bond market, the funds’ ages, asset bases, and indexes are all different. LQD is the oldest and largest, and it tracks the most restrictive index of the three, perhaps a relic of another era for ETFs when trading less-liquid corporate bonds was cost-prohibitive. The fund follows the Markit iBoxx USD Liquid Investment Grade Index, while USIG and VTC track the ICE BofA US Corporate Index and Bloomberg U.S. Corporate Bond Index, respectively.
The Markit index targets the most liquid portion of the investment-grade corporate bond market. It does not hold bonds with less than $750 million outstanding face amount and requires issuers to have at least $2 billion in total debt outstanding. In comparison, the Bloomberg and ICE indexes have a liquidity threshold for individual bonds of $300 million and $250 million, respectively, and no issuer-level threshold.
Eligible bonds for the Markit index must also have at least three years remaining to maturity, compared with one year for the other indexes. As a result, the Markit index shies away from smaller, riskier issuers and acquires a longer duration than its index peers. The ICE index also tends to carry slightly more credit risk than the Bloomberg index, likely owing to minor differences in criteria for bond types and liquidity.
These differences made their presence known during major stress markets. The exhibit below displays the indexes’ performance relative to the Bloomberg U.S. Corporate Bond Index from their common inception in 1999. The Markit index outperformed when credit spreads widened but often lost most of its advantage when spreads tightened. It outpaced the Bloomberg index by an impressive 5 percentage points during the trough of the global financial crisis, only to promptly give most of it away in the subsequent recovery period in 2009. In the opposite direction and to a much lesser extent, the ICE index lagged the other two indexes during credit stress and clawed its way back during market recoveries. For instance, it trailed the Bloomberg index by 1.8 percentage points during the last four months of 2008 and gained back 1.08 percentage points in the following year.
Relative Cumulative Performance Against the Bloomberg U.S. Corporate Bond Index
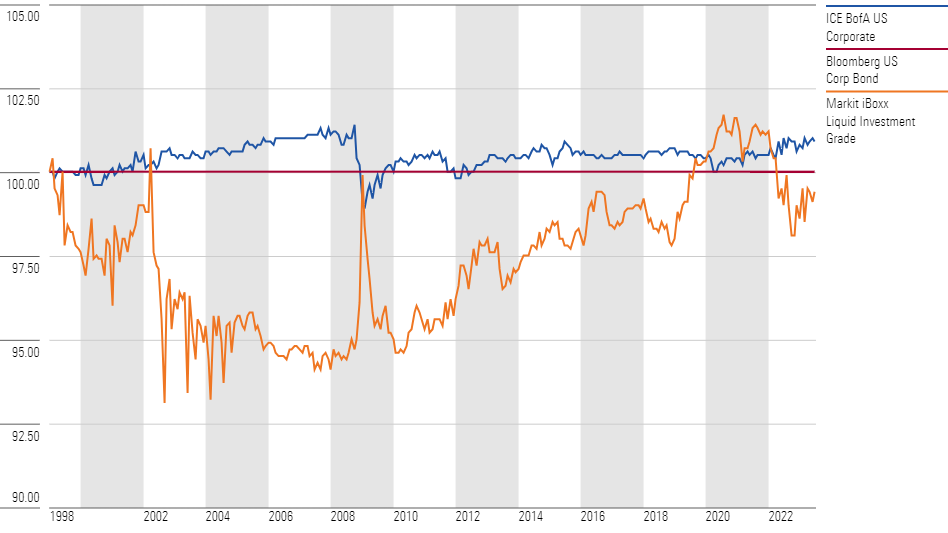
The Markit index’s longer duration also contributed to its performance difference. The index reaped decent gains from falling interest rates in 2019 and benefited from widening credit spreads and tanking yields during the pandemic-driven shock. Again, however, it lost much of its advantage in the rate-driven meltdown of 2022.
While the three indexes arrived at similar spots by June 2023, the journey there was a bumpy one for the Markit index. Its standard deviation of returns over the period was 7.22, over a percentage point higher than that of the Bloomberg and ICE indexes. As with most broad-market indexes, restricting the scope of the index’s opportunity set takes away the smoothing effect of holding the market. Investors were not compensated for the added volatility over this period, as it trailed the Bloomberg U.S. Corporate Bond Index by 3 basis points annualized.
Passive Investing Still Requires Discretion
Despite being simple to understand, broad-market index funds still require some due diligence by investors. The differences in index compositions discussed above did not amount to significant performance deviations over the long run, but they can cause unexpected behavior during stress markets, a time when investors need every inch of performance. As the bond market evolves, index providers and fund sponsors are constantly reviewing their methodologies and responding to changes, be it the global financial crisis or the recent inclusion of Chinese debt. Thus, it might be a prudent practice for investors to revisit the index methodologies of their passive holdings every now and then to reevaluate their fit within their portfolios.
This article previously appeared in the July 2023 edition of Morningstar ETFInvestor.
3 Great Bond ETFs
The author or authors own shares in one or more securities mentioned in this article. Find out about Morningstar’s editorial policies.
/cloudfront-us-east-1.images.arcpublishing.com/morningstar/ZHTKX3QAYCHPXKWRA6SEOUGCK4.png)
/cloudfront-us-east-1.images.arcpublishing.com/morningstar/24UPFK5OBNANLM2B55TIWIK2S4.png)
/d10o6nnig0wrdw.cloudfront.net/04-25-2024/t_29c382728cbc4bf2aaef646d1589a188_name_file_960x540_1600_v4_.jpg)
:quality(80)/s3.amazonaws.com/arc-authors/morningstar/c00554e5-8c4c-4ca5-afc8-d2630eab0b0a.jpg)