
ETF Investors Plowed Into Ultrashort Bonds as Global Markets Slumped
October ETF flows reflect investor uncertainty.
/s3.amazonaws.com/arc-authors/morningstar/30e2fda6-bf21-4e54-9e50-831a2bcccd80.jpg)

Key Takeaways
- The Morningstar Global Markets Index entered correction territory when it lost 3.27% in October.
- The Morningstar US Core Bond Index shed 1.56%, marking its sixth straight month in the red.
- U.S. exchange-traded funds collected roughly $29 billion, a modest sum by their standards.
- Ultrashort-bond funds reeled in nearly $14 billion to power fixed-income flows.
- Outflows from international equity and U.S. large-value funds weighed on stock-ETF flows.
- IShares, Vanguard, and J.P. Morgan finished October atop the ETF provider flows standings.
- Another rough month of performance left small-cap strategies looking undervalued at October’s end.
No Reprieve for Bonds
The exhibit below shows October returns for a sample of ETFs that serve as proxies for major asset classes. A blended portfolio lost 2.08% last month as the case for a diversified 60/40 portfolio took another hit.
October Market Performance through the Lens of Analyst-Rated ETFs
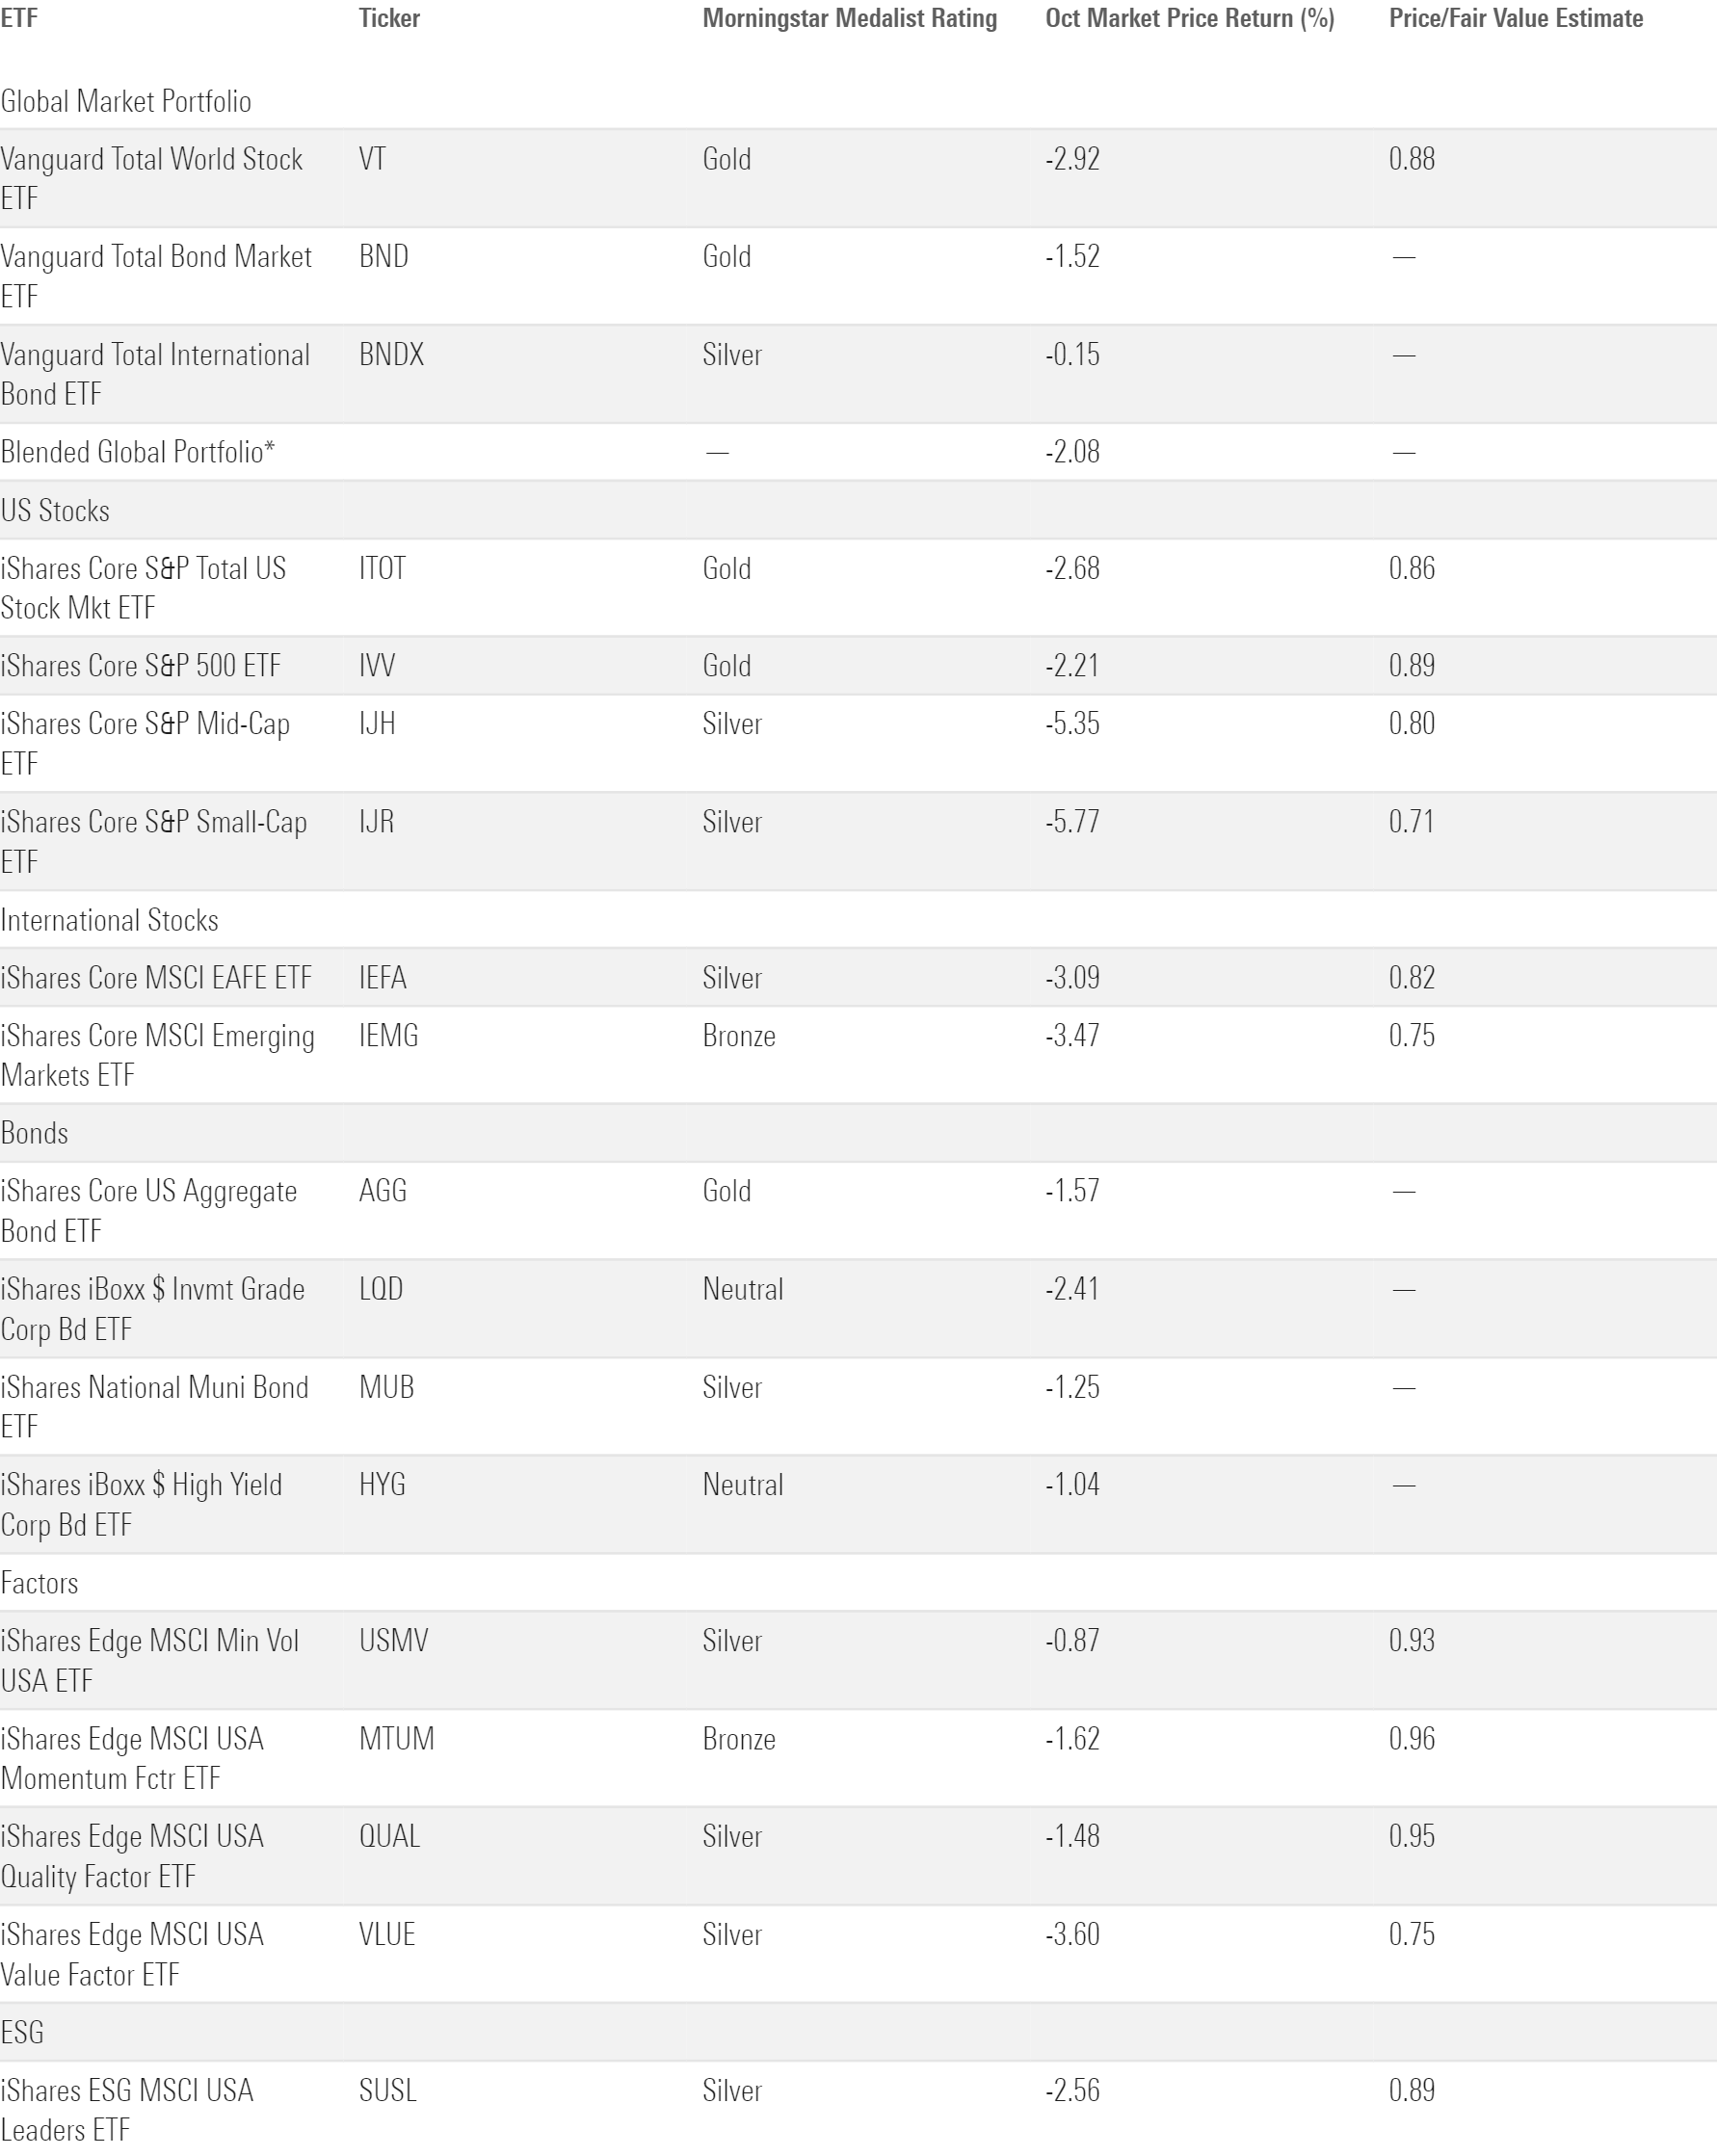
Bond yields continued to climb in October. The yield on the 10-year Treasury note briefly touched 5%, a milestone it hadn’t reached since 2007. That could have stemmed from stronger-than-expected third-quarter economic growth, fresh data that added teeth to the Fed’s stated plan of keeping interest rates higher for longer. A mounting federal budget deficit could be driving up government bond yields, too. Whatever the reason(s), bond investors have resented the impact: Vanguard Total Bond Market ETF BND declined 1.5% in October and has now peeled back 4.4% over the past six months.
Bonds fared a bit better overseas. Vanguard Total International Bond ETF BNDX posted a modest 0.15% loss. European bond yields subsided after the European Central Bank left interest rates unchanged following 10 consecutive hikes. The same could unfold in the United States after the Fed followed suit at its Nov. 1 meeting. But markets have expected the Fed to leave rates intact, so the Fed’s commentary should prove more influential. When the book closed on October, BNDX gained 1.9% for the year to date while BND lost 2.4%.
Stock Markets Correct
Stocks didn’t make matters better for investors balancing equity and fixed income. Vanguard Total Stock Market ETF VTI declined 2.7% in October in its third straight month of losses. Before rallying in the month’s final days, the fund had dropped more than 10% from its end-July peak, which qualifies as a market correction.
There are a range of factors that help explain the correction. Some market observers suspect that investors fled stocks for attractive yields in bonds. Others point to the breakout of the Israel-Hamas war or the threat of an economic downturn. Perhaps valuations are just returning to more durable levels. It’s most likely that some combination of these factors sparked the recent drawdown; each argument has holes on its own. In any event, the pullback has taken the air out of a strong stock market rebound to start the year.
Small-cap stocks bore the brunt of the pain in October. IShares Core S&P Small-Cap ETF IJR slid 5.8% on the month, about 2.5 percentage points further than iShares Core S&P 500 ETF IVV. Small caps have failed to keep pace all year, even as a “Magnificent 7″ slowdown has weighed on large-cap portfolios. IJR trailed IVV by about 15.5 percentage points for the year to date through October. That would be the widest calendar-year performance gap between the two funds since 2001.
Nine of the 11 funds in State Street’s range of sector ETFs finished October lower than where they started. Energy Select Sector SPDR ETF XLE shed 5.8%, as waning oil prices and lackluster earnings reports weighed on ExxonMobil XOM and Chevron CVX, which jointly represent more than 40% of the portfolio. Those firms lost 10% and 13.4% in October, respectively. Consumer Discretionary Select Sector SPDR ETF XLY lost 5.5% because Tesla TSLA, which entered the month constituting 20% of the fund, sank 21.3%. Utilities Select Sector SPDR ETF XLU advanced 1.3% in October, though its 13.3% drawdown on the year ranked last among the suite of sector ETFs.
Growth stocks held up a bit better than value in October. That marked the latest chapter in a lopsided year: Vanguard Growth ETF VUG climbed 26.1% for the year to date through October, while counterpart Vanguard Value ETF VTV slid 2.5%. After VUG trailed VTV by a whopping 31 percentage points in 2022, the growth strategy has clawed back a good chunk of the ground it surrendered to its value twin last year.
Bond ETF Flows Hold Steady
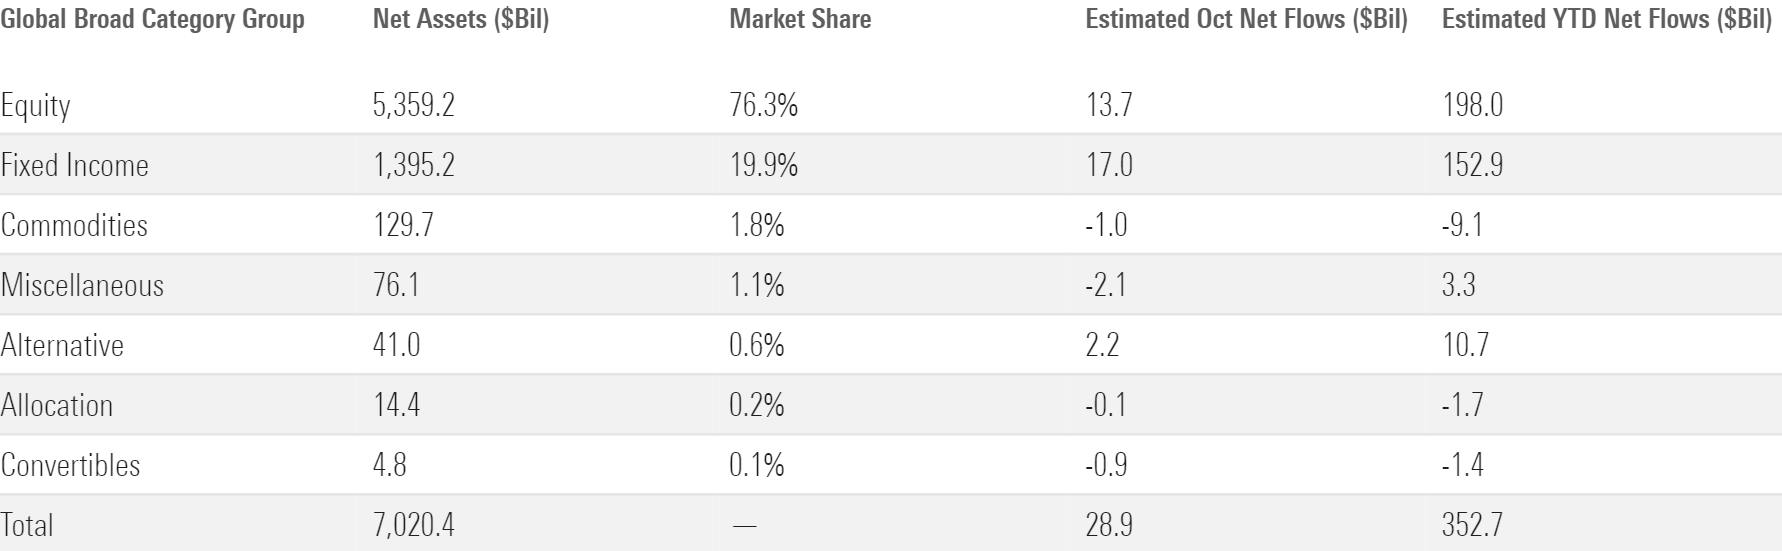
Bond ETFs hauled in about $17 billion in October. That’s a solid sum—and enough to beat out stock ETF flows for the month—but a far cry from bond funds’ record-setting flows from years past.
October Flows Across Morningstar Broad Category Groups
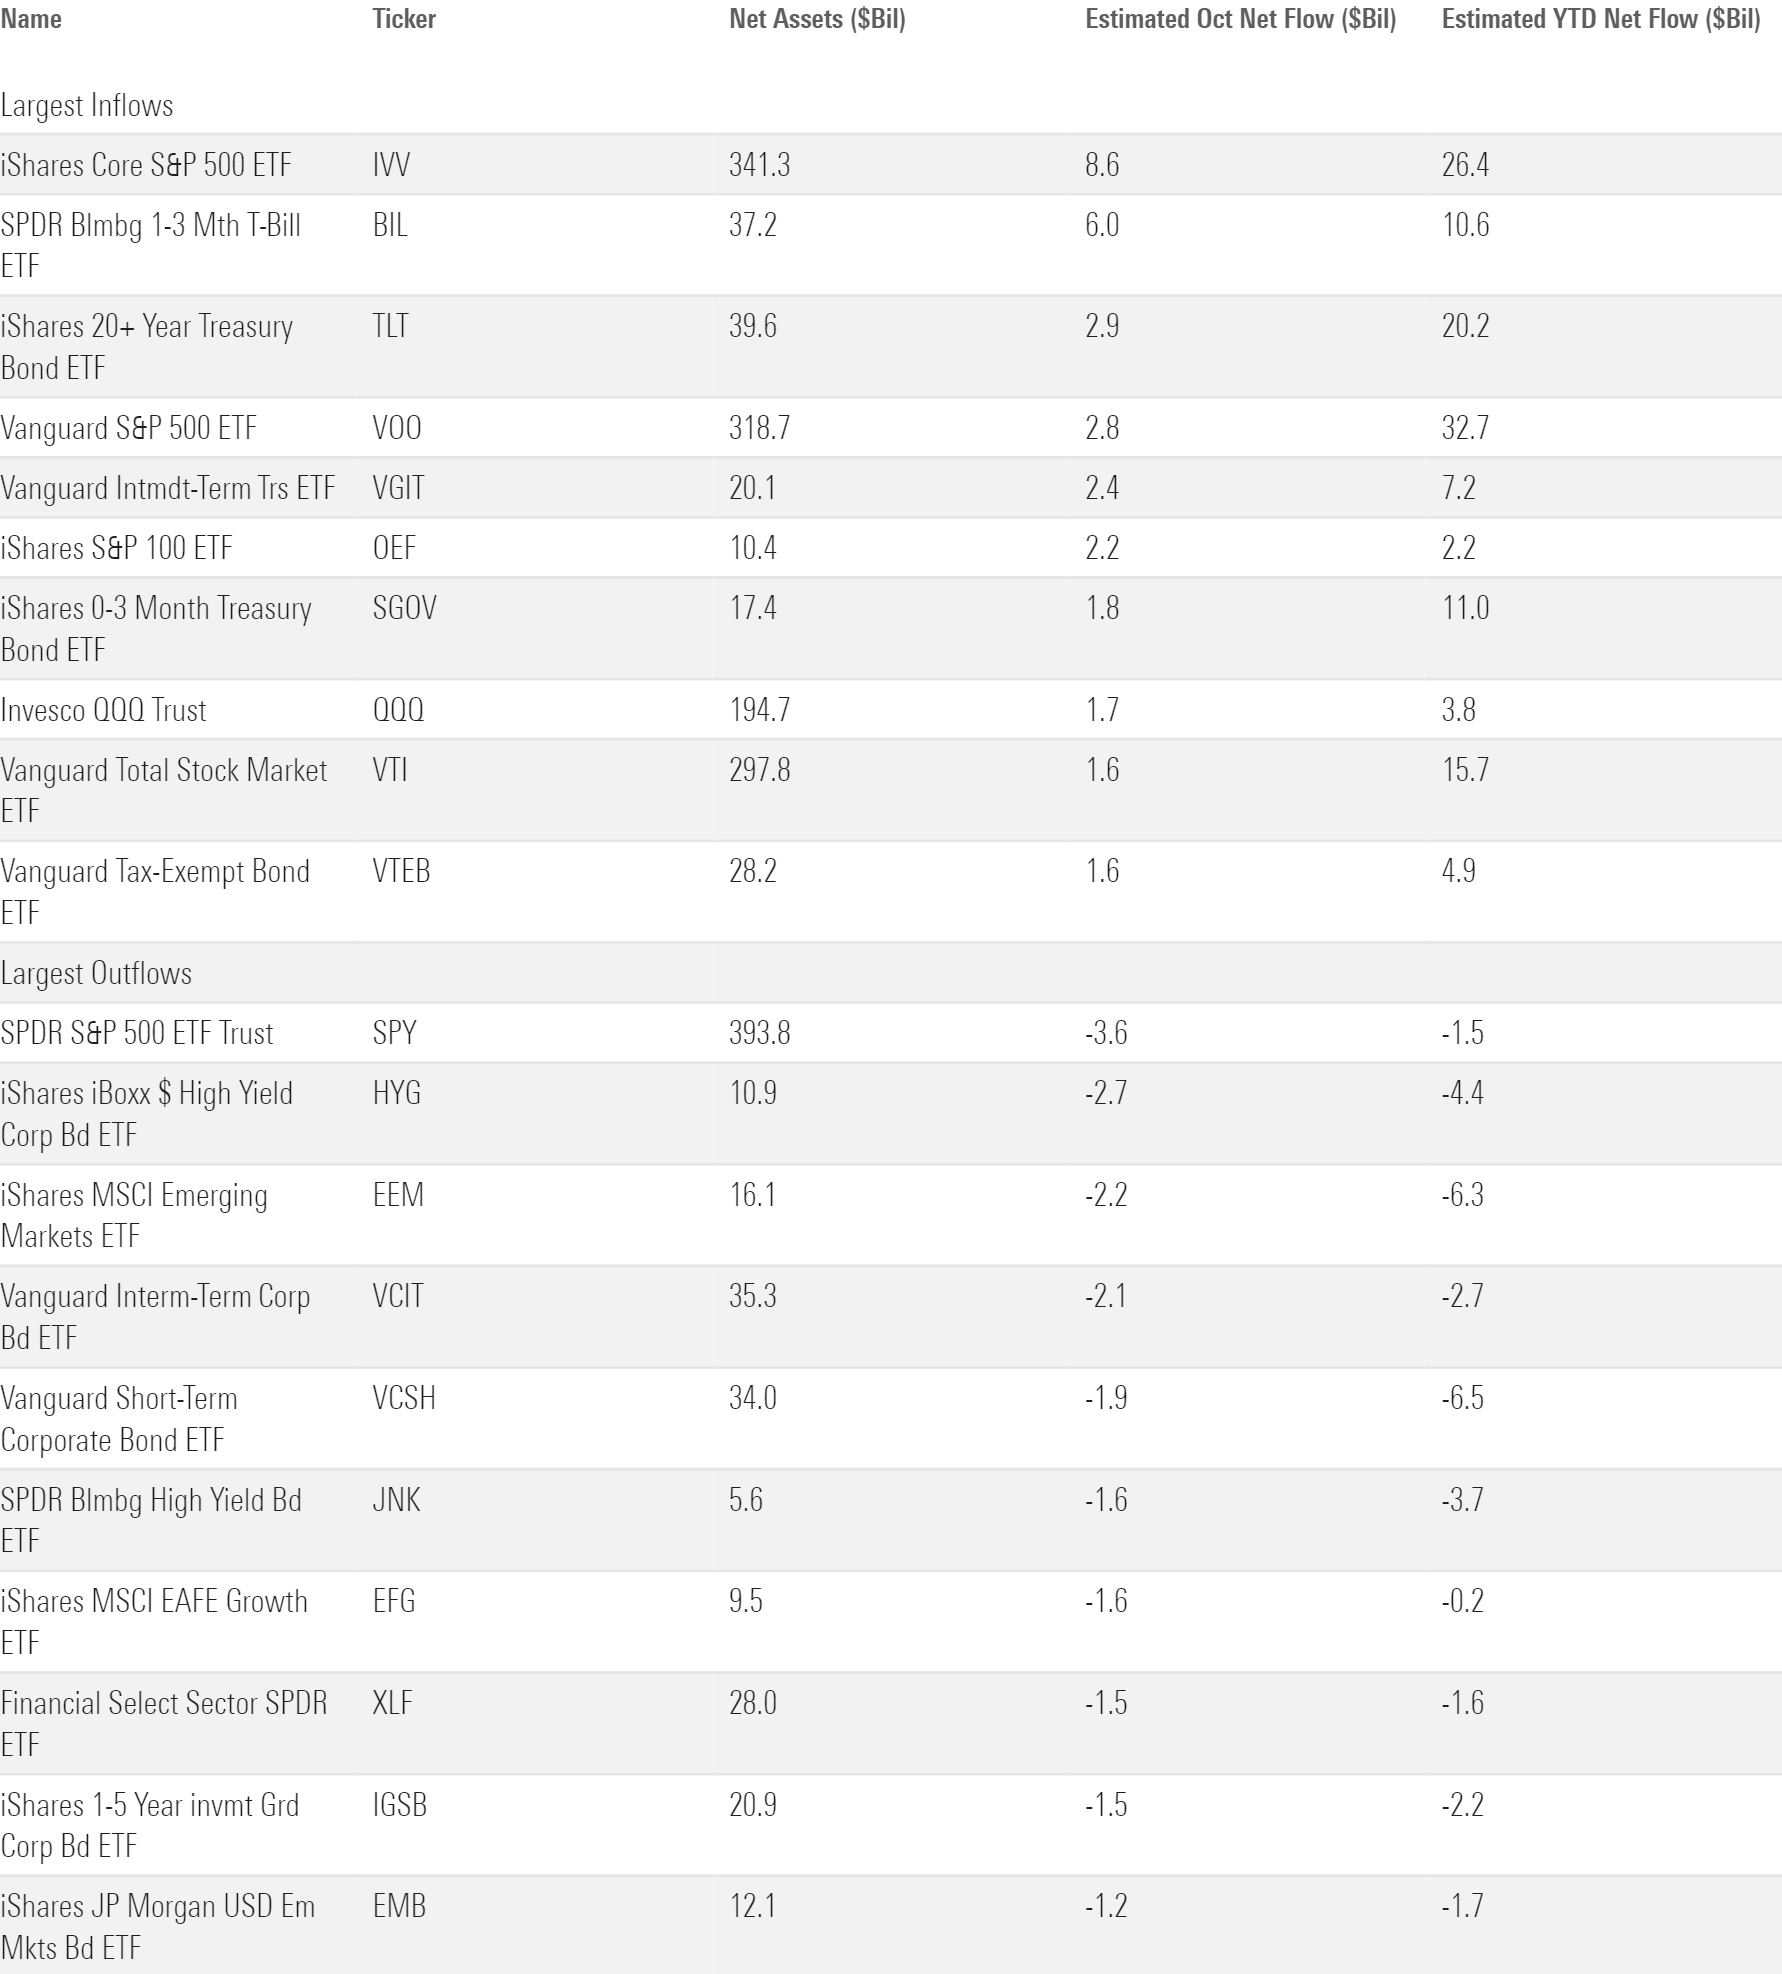
Ultrashort bonds were the star of the show in October. The $14 billion they absorbed represented more than 80% of all bond-ETF net flows. Investors have flocked to these funds for their compelling yield. SPDR Bloomberg 1-3 Month T-Bill ETF BIL registered a 5.25% SEC yield at the end of October, exceeding the 5% yield investors could find in BND.
October was the latest step in a banner year for the ultrashort-bond Morningstar Category. These funds pulled in more than $46 billion for the year to date, most among all fixed-income categories. A strong finish to 2023 could mark these funds’ best calendar year of organic growth since 2018. Connecting that market environment with the current one requires little reaching; climbing bond yields and a turbulent end-of-year stock market could characterize both. BIL collected nearly $7 billion in 2018. This time around, the spoils are even sweeter: It has reeled in $10.6 billion this year after attracting $6 billion in October.
Morningstar Categories with the Largest October Flows
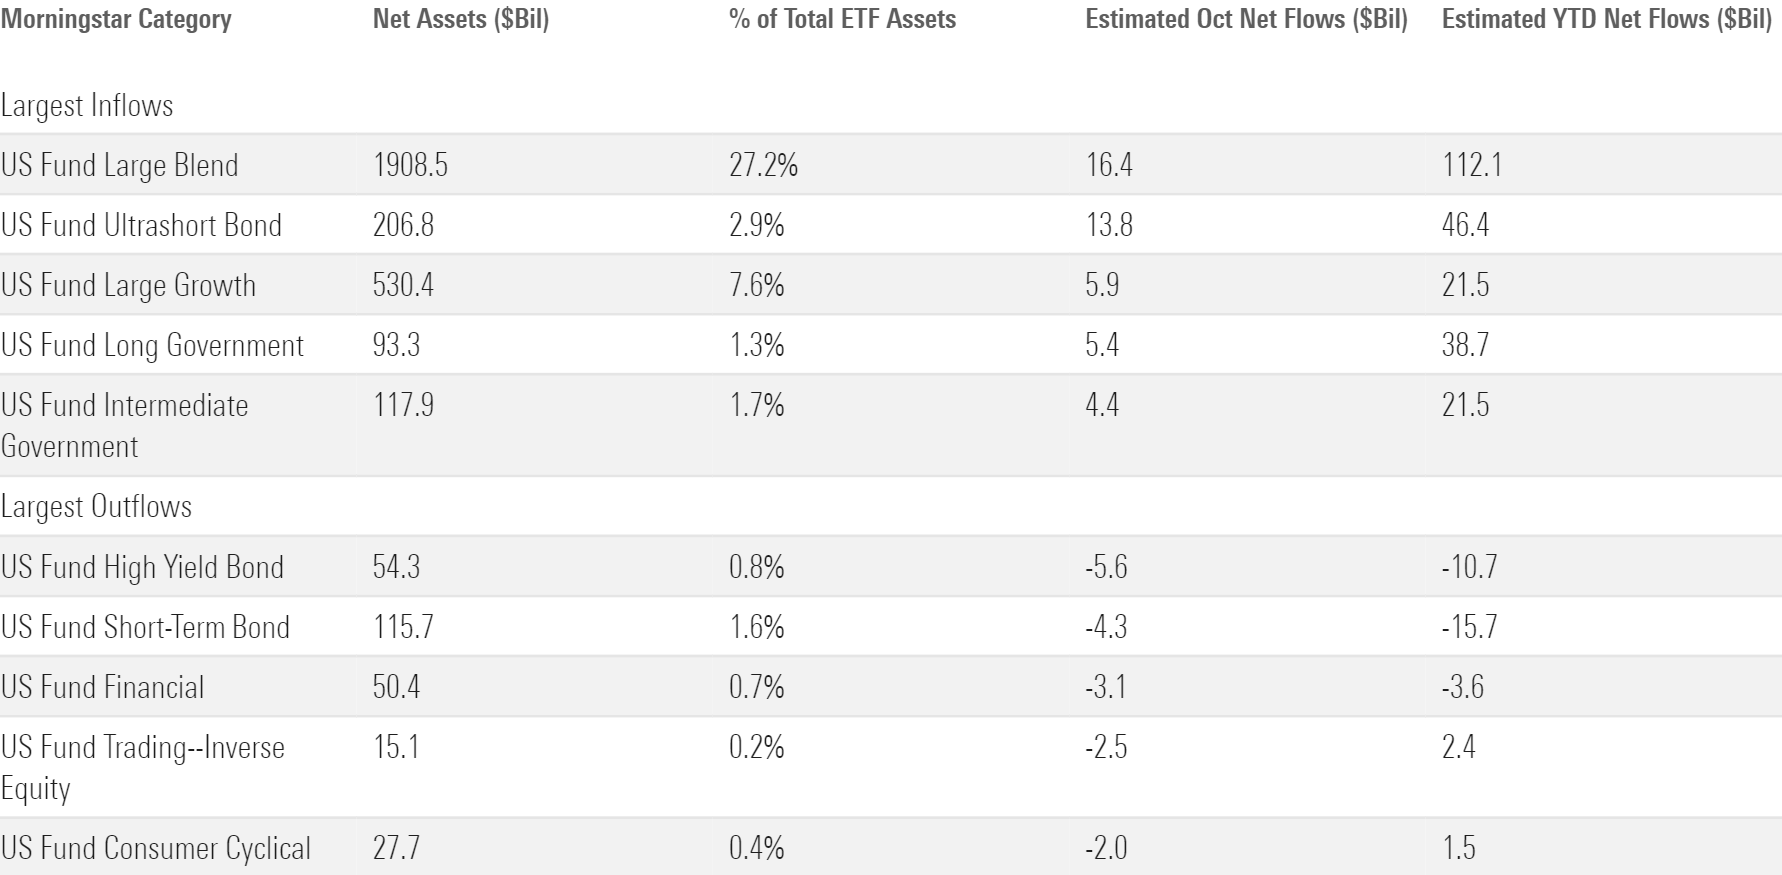
While many investors pounced on the yields in ultrashort bonds, others have opted to lock in their rates with long-term Treasuries. Indeed, the long government category saw its 2023 inflows climb to nearly $39 billion after hauling in a fresh $5.4 billion in October. Crystallizing current yields for the long term makes sense—it’s effectively buying low on Treasuries for those who believe yields will come back down—but many investors were far too early on the trade. Resilient bond yields have punished the investors who dutifully marched into funds like iShares 20+ Treasury Bond ETF TLT. And there was no shortage of them. TLT racked up nearly $34 billion of inflows from the start of 2022 through October 2023, a span during which it plummeted 40.8%.
Situated between the bond cohort’s two largest winners, short-term bond funds have found themselves in a sour spot. After surrendering $4.3 billion in October, their year-to-date outflows ballooned to nearly $16 billion, the most among all bond categories.
High-yield bond funds also had a difficult month, shedding nearly $5.6 billion. Nearly half of that money poured out of iShares iBoxx $ High Yield Corp Bond ETF HYG, the largest fund in the category. High-yield funds have generally held up better than Treasury portfolios with similar duration this year, but investors have ditched them in favor of safer substitutes.
ETFs with the Largest October Flows
Stock ETF Flows Shuffle Along
Stock ETFs collected about $14 billion in October. That’s fine in absolute terms but translates into a paltry 0.25% organic growth rate. Stock ETFs are on pace to garner roughly $240 billion of inflows for calendar 2023, well shy of the $360-billion-plus they absorbed in 2022 and peanuts compared with their $670 billion year in 2021.
Value strategies are the number-one culprit for stock ETFs’ slowdown. After accumulating more than $150 billion of new money over the past two calendar years, the large-value category has shed $13.5 billion so far in 2023. October brought more of the same, as investors pulled $1.5 billion from the segment.
The large-value flows slump is somewhat perplexing. Yes, performance has been subpar, but that didn’t stop investors from piling into these strategies in 2020 and 2021. The active ETF awakening has done more for the large-value category ($6 billion inflows year to date) than large-growth ($2.6 billion). Dampening interest in dividend funds (particularly iShares ones) has hurt, as 56% of dividend-fund assets sit in the large-value category. But the sharpest outflows have come from iShares Russell 1000 Value ETF IWD; its $6.1 billion outflow this year has weighed on the broader category.
International equity funds leaked about $2 billion in a relatively quiet month. The Europe stock category—a hot destination earlier this year—shed $1.6 billion. That said, it’s been a solid year overall for the international-equity cohort. It reeled in $59 billion for the year to date through October, good for a 6% organic growth rate—about double the U.S. equity segment. The foreign large-blend category has predictably led the way, while surprising flows into Japan stock ($5.7 billion) and India equity funds ($2.4 billion) have rounded out the picture.
ETFs that target specific sectors have had no such luck. After shedding $5.9 billion in October, their year-to-date exodus reached nearly $22 billion. Funds targeting cheaper sectors like healthcare, energy, real estate, and financial services have fared the worst. The sector-equity cohort is well on its way to back-to-back years of outflows after they bled $12 billion in 2022.
Market Leaders Earn Their Keep
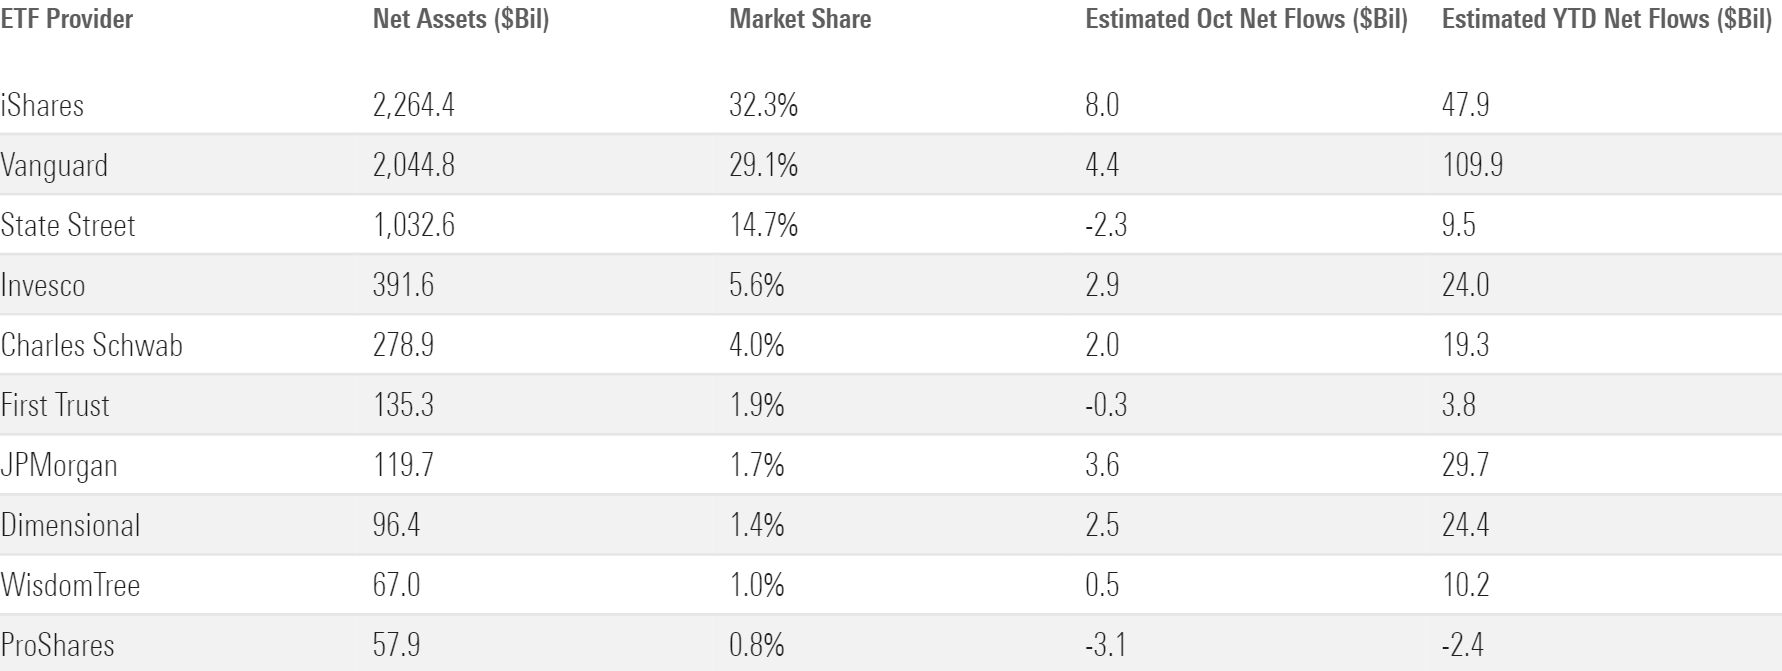
October flows among ETF providers were light on drama. Just five providers collected more than $2 billion, and each of them ranked in the top 10 largest providers. Here’s what resonated with investors from each of those shops:
1) iShares ($8 billion inflow): iShares Core S&P 500 ETF
IShares’ largest fund reeled in nearly $8.6 billion in October, the most among all ETFs by a wide margin. IVV has consistently garnered inflows for iShares, but the rest of its U.S. equity suite—particularly those in value categories—have slowed down. Investors pulled $1.5 billion from iShares stock funds in 2023 but plowed $56 billion into its fixed-income lineup.
2) Vanguard ($4.4 billion): Municipal-bond funds
Like clockwork, VTI and Vanguard S&P 500 ETF VOO teamed up for more than $4 billion of October inflows. But the ascent of Vanguard’s municipal-bond strategies bears mentioning. Their $1.7 billion October haul pushed their year-to-date inflow above $5 billion, good for an organic growth rate of 21%.
3) J.P. Morgan ($3.6 billion): (Other) Active Strategies
It’s no surprise that active strategies collected most of the money that flowed into J.P. Morgan. The surprise is that JPMorgan Equity Premium Income ETF JEPI, the firm’s covered-call supernova, did not lead the way. JPMorgan Global Select Equity ETF JGLO and JPMorgan Nasdaq Equity Premium Income ETF JEPQ set the pace by gathering more than $750 million apiece.
4) Invesco ($2.9 billion): Nasdaq-100 Trackers
Most of the money that flowed into Invesco landed in Invesco QQQ Trust QQQ ($1.7 billion) or Invesco Nasdaq 100 ETF QQQM ($721 million). The two main Nasdaq-100 Index strategies constituted about 53% of Invesco’s ETF assets at the end of October.
5) Dimensional ($2.5 billion): A Little Bit of Everything
Dimensional lists 34 ETFs in the U.S. All of them recorded inflows in October and on the year overall, a remarkable feat and a testament to the burgeoning popularity of active ETFs.
October Flows for the 10 Largest ETF Providers
Small-Value Has Been Hard to Stick With
The fair value estimate for ETFs rolls up our equity analysts’ fair value estimates for individual stocks and our quantitative fair value estimates for stocks not covered by Morningstar analysts into an aggregate fair value estimate for stock ETF portfolios. Dividing an ETF’s market price by this value yields its price/fair value ratio. This ratio can point to potential bargains and areas of the market where valuations are stretched.
The 10 Most Under- and Overvalued Analyst-Rated ETFs
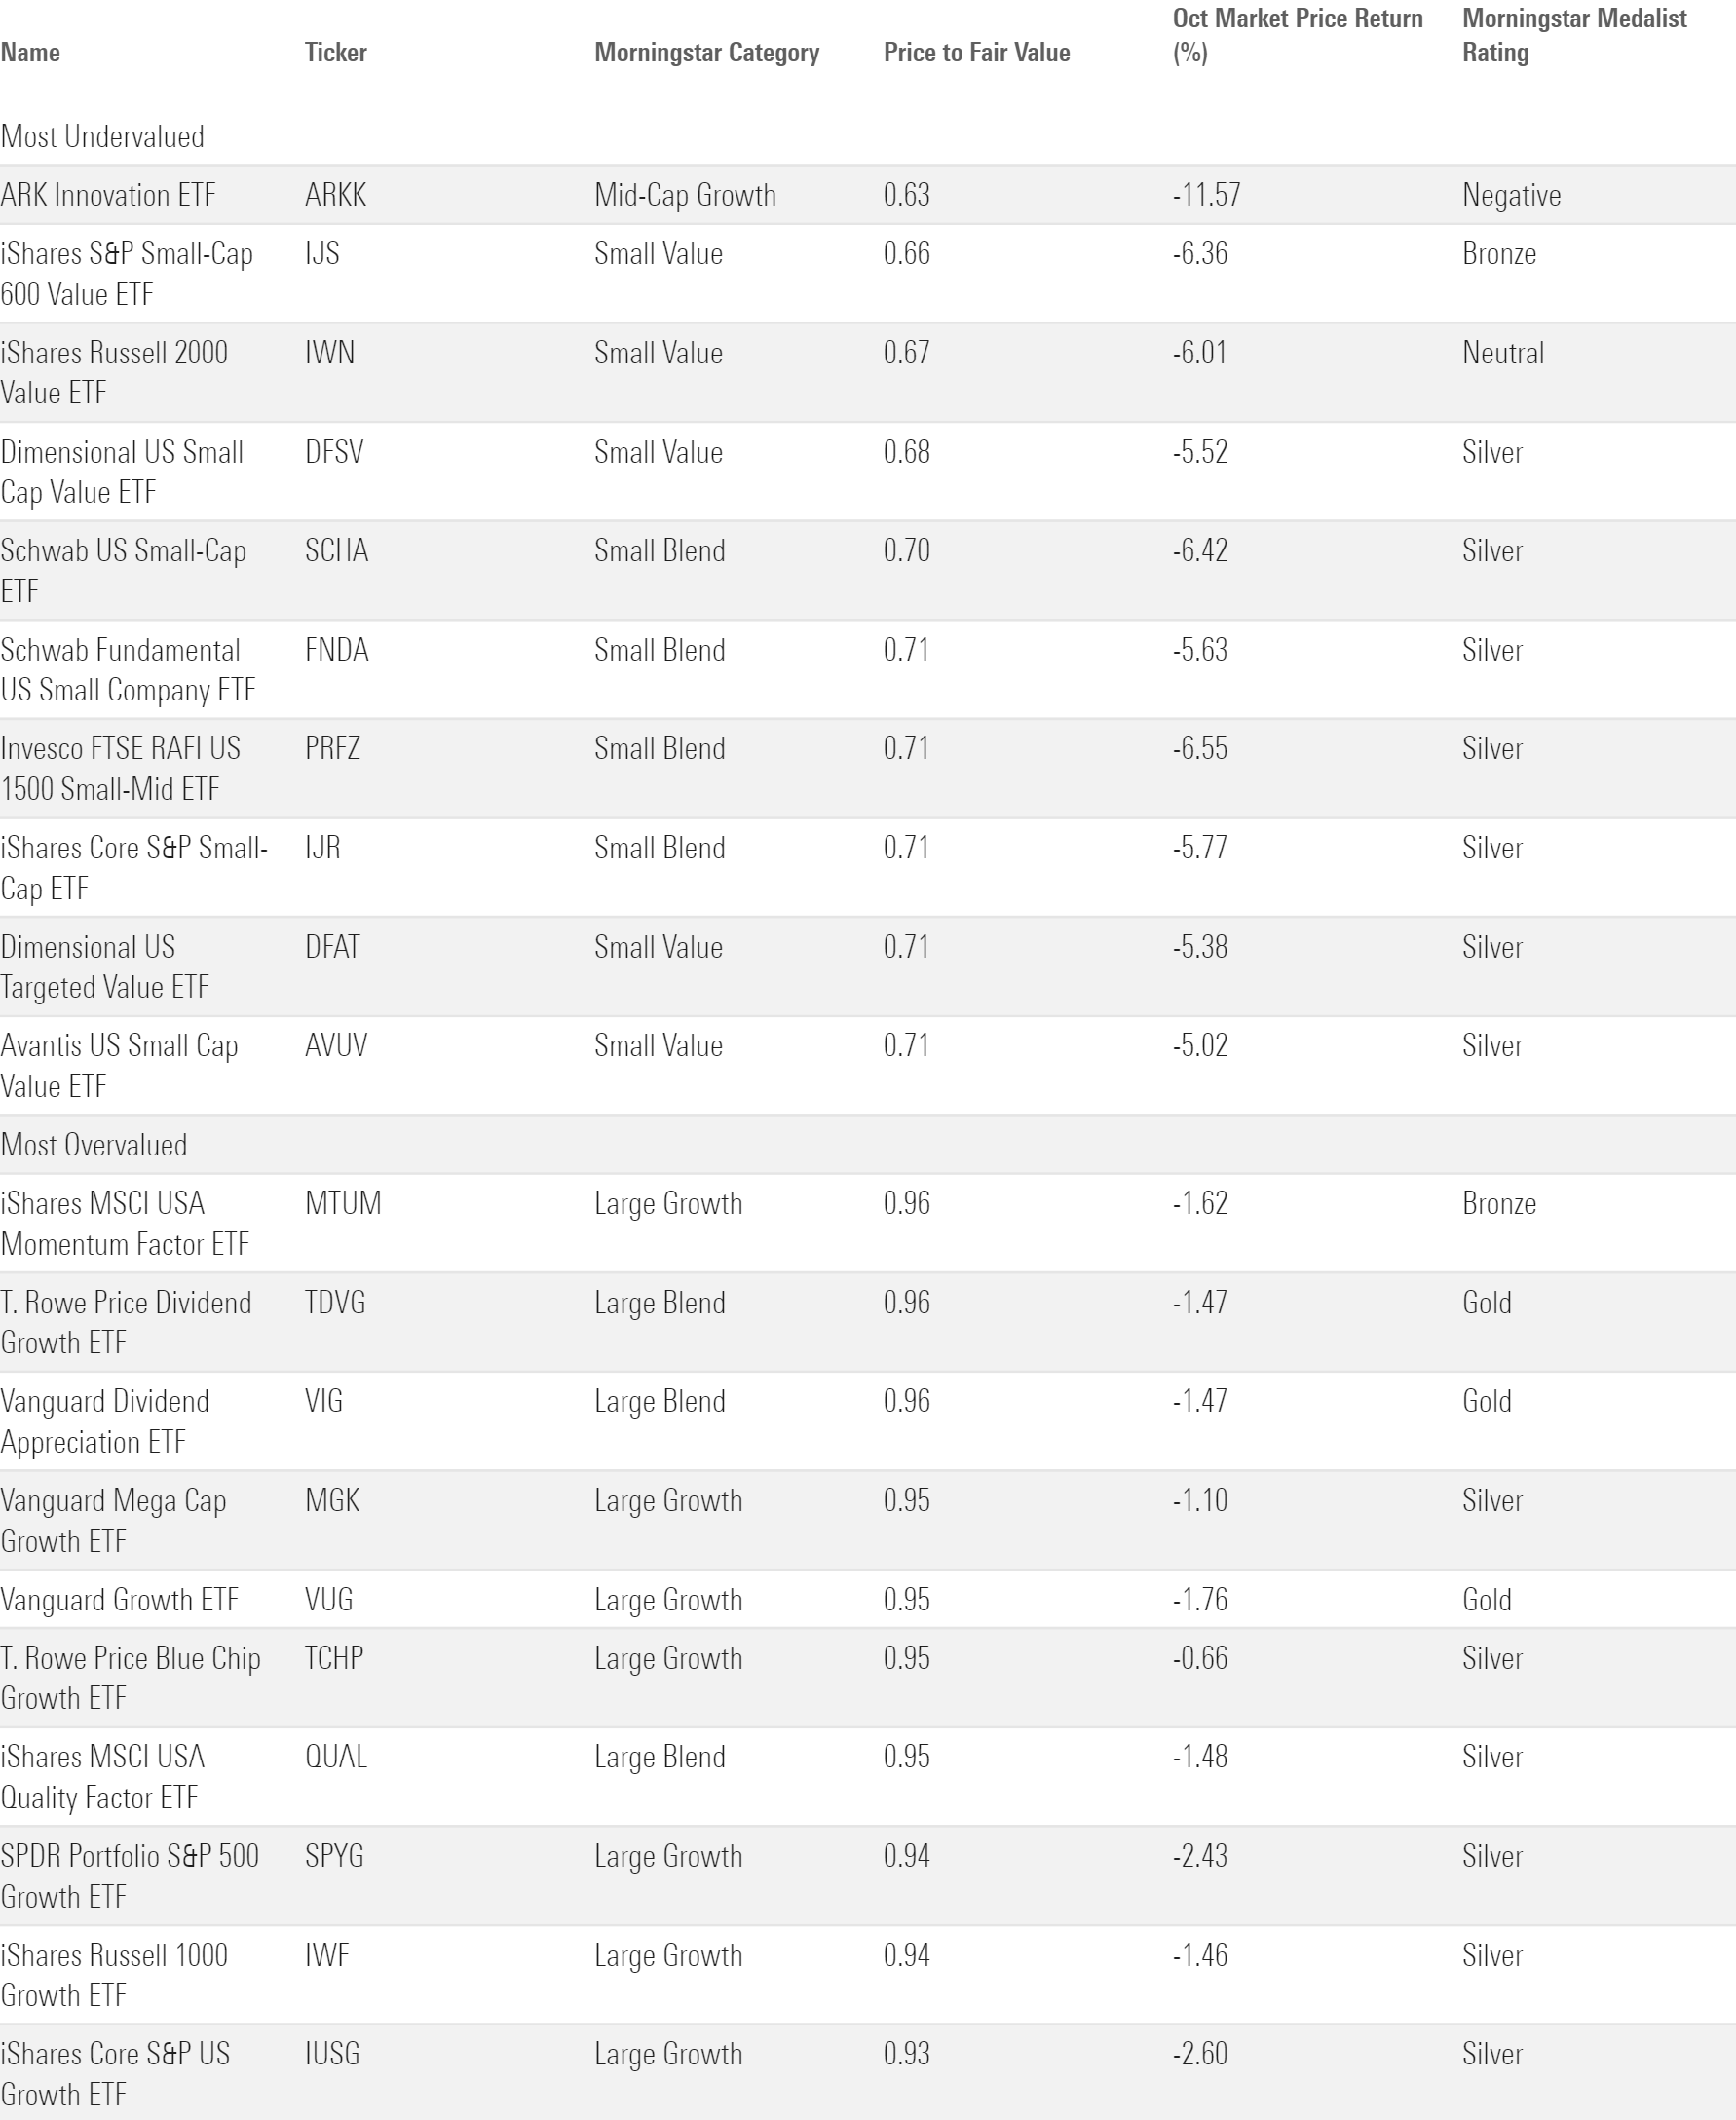
Small-value funds rated by Morningstar analysts traded 30% below their fair value on average, making the category the cheapest in the fund marketplace. Recently, investors hunting for bargains got what they paid for. Now discounted by 34%, IShares S&P Small-Cap 600 Value ETF IJS pulled back 7.2% for the year to date through October—about 15.5 percentage points behind IVV. Small-value funds have tested investors’ conviction, but their modest valuations paint an encouraging picture of what lies ahead.
Broader U.S. stock portfolios also traded below their fair value when October drew to a close, though by smaller margins. VTI sported a price/fair value ratio of 0.9. International counterpart Vanguard Total International Stock ETF VXUS offered a slightly better deal, coming at a 15% discount instead of 10%. Foreign stocks have failed to carve out a performance advantage over their domestic peers for the past two decades, but their valuation edge could be a starting point to reverse the narrative.
The author or authors do not own shares in any securities mentioned in this article. Find out about Morningstar’s editorial policies.
/cloudfront-us-east-1.images.arcpublishing.com/morningstar/T2LGZCEHBZBJJPPKHO7Y4EEKSM.png)
/cloudfront-us-east-1.images.arcpublishing.com/morningstar/ZHTKX3QAYCHPXKWRA6SEOUGCK4.png)
/cloudfront-us-east-1.images.arcpublishing.com/morningstar/MNPB4CP64NCNLA3MTELE3ISLRY.jpg)
:quality(80)/s3.amazonaws.com/arc-authors/morningstar/30e2fda6-bf21-4e54-9e50-831a2bcccd80.jpg)