Skip to Content

7 min read

Global Sustainable Fund Flows: Q2 2025 in Review

Net inflows hit $4.9 billion after record outflows in Q1, driven by a European recovery and resilient market performance despite geopolitical headwinds.

Key Takeaways

  • Global sustainable open-end and exchange-traded funds recorded an estimated net USD 4.9 billion in the second quarter of 2025, a notable rebound from the record-high restated redemptions of USD 11.8 billion in the first quarter. 

  • Global sustainable fund assets rose by 10% in the second quarter to USD 3.5 trillion, supported by stock market appreciation.

  • European investors poured USD 8.6 billion of net new money into sustainable funds over the past three months, after redeeming USD 7.3 billion in the prior quarter.

The global sustainable fund universe encompasses open-end funds and exchange-traded funds that, through their prospectus or other regulatory filings, claim to focus on sustainability, impact, or environmental, social, and governance factors. The global universe is divided into three segments by domicile: Europe, the United States, and the rest of the world.

Global sustainable funds netted over USD 4.9 billion in the second quarter of 2025 — a notable rebound from the record-high restated outflows of USD 11.8 billion in the first quarter. This turnaround was driven by a recovery in fund flows in Europe and a lower level of redemptions in the United States.

This article is adapted from a recent report published by Morningstar Sustainalytics and details regional flows, assets, and launches for the second quarter of 2025. Download the full Global Sustainable Fund Flows report for free.

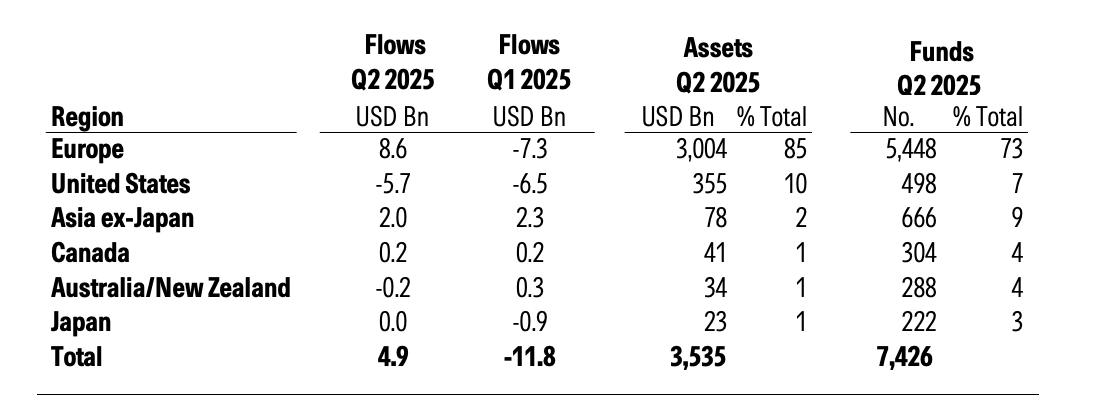
Global Sustainable Fund Statistics

Source: Morningstar Direct. Data as of June 2025, excluding money market funds, funds of funds, and feeder funds. For Canada and the US, the number of funds includes funds of funds and feeder funds (these are, however, excluded from flow and asset calculations). For Japan and South Korea, the number of funds, flows, and assets includes funds of funds and feeder funds.

Europe attracted USD 8.6 billion in net new money in the past three months, contrasting with the restated USD 7.3 billion outflows in the previous three months. The United States continued to experience net withdrawals for the 11th consecutive quarter, totaling USD 5.7 billion in the second quarter.

Flows into Asia ex-Japan declined slightly to USD 2 billion, down from a restated USD 2.3 billion in the previous quarter. Japan recorded modest inflows of USD 13 million, marking a reversal of fortune after having seen uninterrupted outflows since mid-2023. Investors in Canada continued to pour net new money into sustainable funds, generating inflows of around USD 162 million, whereas Australia and New Zealand recorded minor outflows of USD 166 million.

Calculated as net flows relative to total assets at the beginning of the period, the organic growth rate of the global sustainable fund universe for the second quarter was 0.15%, up from a restated negative 0.37% for the previous quarter. In comparison, the broader global fund universe posted an organic growth rate of 0.44% in the second quarter, down from a restated 0.79%. Net global fund flows totaled an estimated USD 240 billion, a sharp decline from the restated USD 403 billion recorded in the prior quarter. Investor sentiment was dampened by uncertainty surrounding US tariffs and geopolitical tensions.

Global Assets Edge Higher to USD 3.5 Trillion in an Up Market

As of June 2025, global sustainable fund assets edged up by almost 10% to USD 3.5 trillion from the restated USD 3.2 trillion three months earlier. Asset growth was supported by stock and bond market appreciation. The Morningstar Global Market Index gained 11.5% over the second quarter, while the Morningstar Global Core Bond Index rose by 4.3%.

Europe takes up 85% of global sustainable fund assets, followed by the United States with 10%, and the rest of the world making up the remainder. Sustainable funds represent approximately 19% of the overall European open-end funds and ETF universe, compared to just 1% in the US.

Quarterly Global Sustainable Fund Assets (USD Billion)

Source: Morningstar Direct. Data as of June 2025.

European Sustainable Fund Flows Recover

European-domiciled sustainable funds returned to positive flows in the second quarter of 2025, netting an estimated USD 8.6 billion. This marks a notable rebound from the restated USD 7.3 billion in outflows recorded in the previous quarter. The recovery was partly driven by USD 4.1 billion in subscriptions to active strategies, recouping a significant share of the earlier redemptions. Passive funds also rebounded, attracting USD 4.5 billion, lifted from the all-time low of USD 1.6 billion in the first quarter.

European Sustainable Fund Flows (USD Billion)

Source: Morningstar Direct. Data as of June 2025.

Global Sustainable Fund Launches

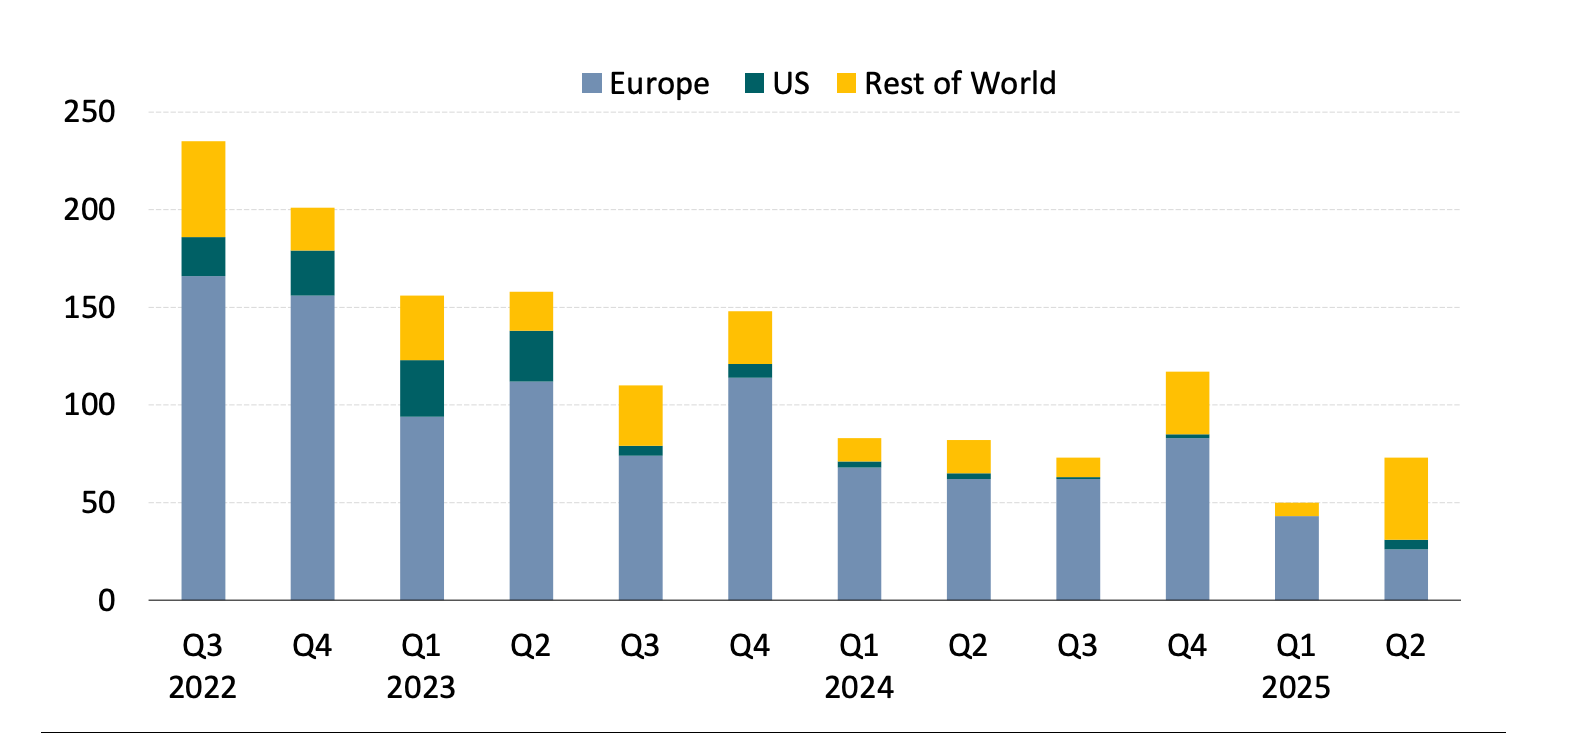
Product development activity in the sustainable funds space saw a modest uptick in the second quarter of 2025, with 72 new sustainable funds launched globally, up from a revised 57 in the previous quarter. Asia ex-Japan was the main driver, accounting for over 40 new launches, compared to just four in the prior quarter, boosted by the rollout of a new incentive scheme in Thailand.

Global Sustainable Fund Launches Per Quarter
Source: Morningstar Direct. Data as of June 2025.

Renaming Activity and More

Renaming activity in Europe reached a record high in the second quarter, as asset managers rushed to implement the EU's ESMA fund naming guidelines. Close to 600 funds were renamed last quarter. In total, we estimate that at least 1,346 funds, or 24% of our European fund universe, representing about USD 1 trillion in assets, have been renamed over the past 18 months. These include 785 that dropped ESG-related terms, 458 that changed ESG-related terms, and 103 that added ESG-related terms.

There is a lot to unpack here. To get into the thick of it, download the free Global Sustainable Fund Flows report published by Morningstar Sustainalytics. It includes in-depth commentary on each domicile as well as the top global asset managers and their performance.

The data evaluated in the report was generated in Morningstar Direct, a comprehensive application that helps asset and wealth managers build their assets and manage their portfolios. Start a free trial of Morningstar Direct today.

You might also be interested in...