Skip to Content

7 min read

Europe OE & ETF Flows 2025: Investor Caution Drives Fixed-Income Leadership in European Flows

European funds gather EUR 131 billion in Q2, with short-term bonds and passive equity strategies dominating amid trade and geopolitical uncertainty.

Key Takeaways
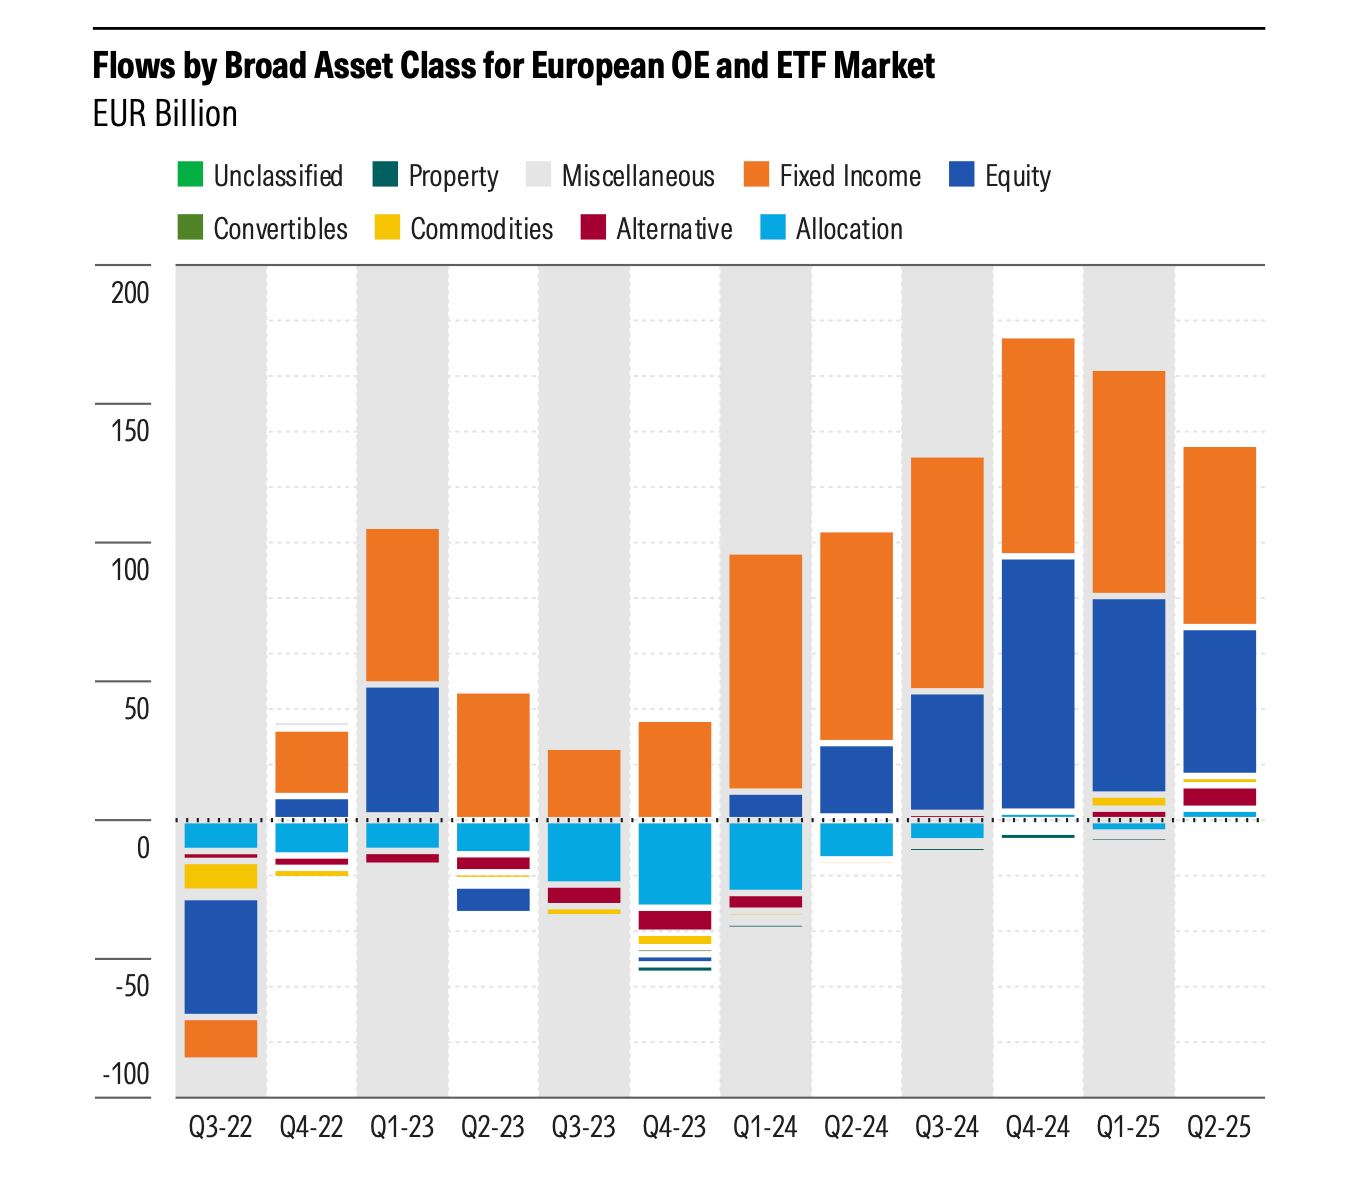
  • European funds gathered EUR 131 billion in the second quarter of 2025, down from EUR 161 billion in the first quarter but extending the past six quarters’ trend of positive flows.

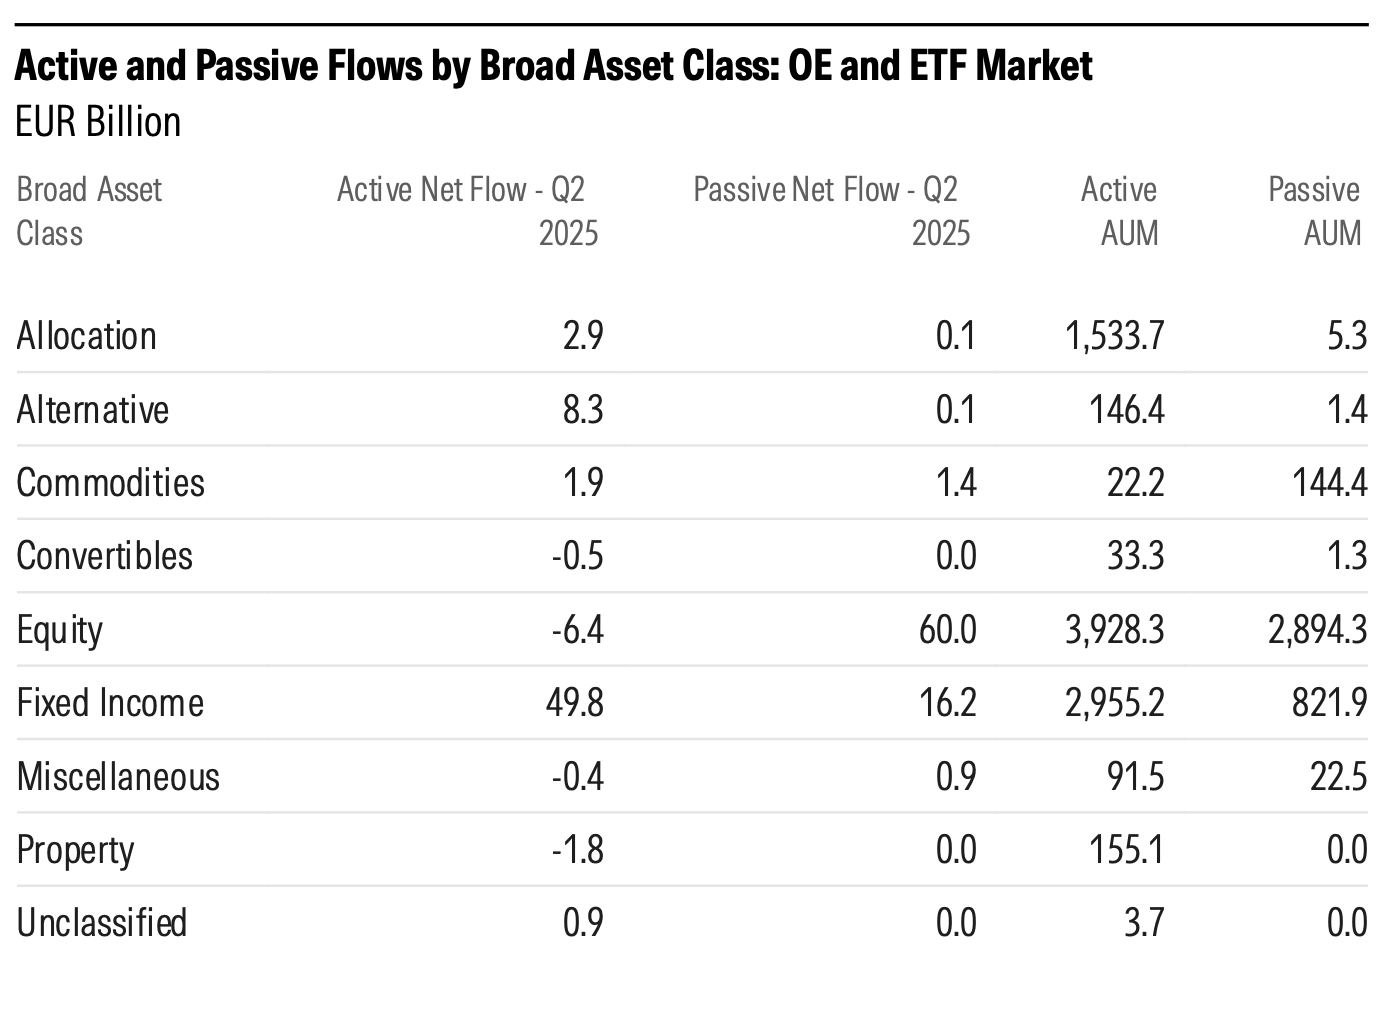
  • Investors’ preferences for active fixed-income and passive equity funds continue to dictate flows. Active bond funds gained EUR 50 billion, while passive bond funds brought in EUR 16 billion. In contrast, passive equity funds raked in EUR 60 billion, while active equity funds saw minor outflows.

  • Thematic funds have seen a decline in popularity, with a total of EUR 87 billion in outflows over the past three years to the end of the second quarter of 2025. 

In Q2 2025, European funds recorded EUR 131 billion of inflows, easing from EUR 161 billion in Q1 but extending a six-quarter growth streak.

Equity funds gained EUR 53 billion in flows, 25% less than the first quarter and 40% less than the fourth quarter of 2024. Global large-cap blend equity funds again took the lion's share, netting EUR 39 billion. Interest in US-only equity funds continued to decline, with only EUR 4.6 billion in flows—a third of the EUR 12.8 billion in the

first quarter. Uncertainty around US tariffs and trade policy has spooked investors, resulting in geographical rotation of equity exposure in portfolios to the benefit of European markets. For example, Switzerland equity funds gathered EUR 4.4 billion in flows. The exception is UK equity funds, which continue to see outflows.

This article is adapted from the recent report published by Morningstar Manager Research. The Morningstar European ETF and ETC Asset Flows report is available to download for free.

This stacked bar chart displays quarterly net flows in EUR Billion for various broad asset classes (Unclassified, Property, Miscellaneous, Fixed Income, Equity, Convertibles, Commodities, Alternative, Allocation) within the European OE and ETF market from Q3-22 to Q2-25. Positive values indicate net inflows, and negative values indicate net outflows.

Source: Morningstar Direct. Data as of June 30, 2025.

Active Versus Passive Flows

Investors’ preferences for active fixed-income and passive equity funds continue to dictate flows. Active bond funds gained EUR 50 billion in the second quarter, while passive bond funds brought in EUR 16 billion. In contrast, passive equity funds raked in EUR 60 billion, while active equity funds saw minor outflows.

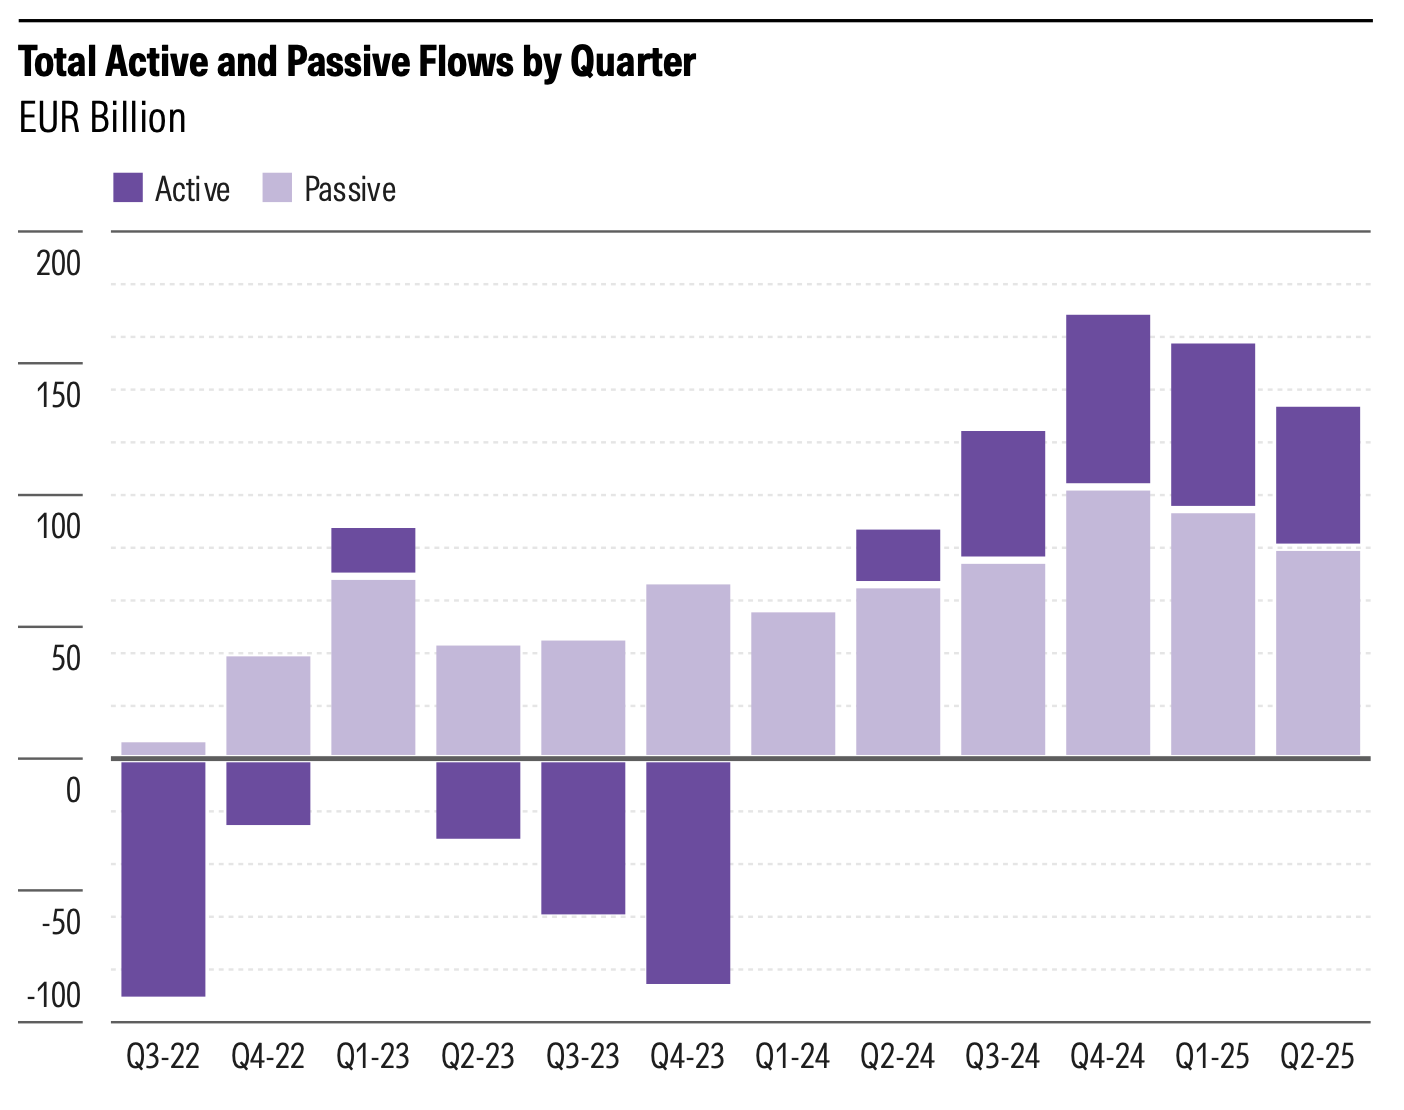
After experiencing outflows in 2022 and 2023, the resurgence of active funds continued for a fifth consecutive quarter, with EUR 55 billion in flows. Passive funds lost some traction in the second quarter, largely owing to the current bias for fixed-incomeallocation and the clear preference for an active management style to get it.

Fixed Income saw the largest active net inflow (€49.8 billion) and also had significant passive inflows.
Source: Morningstar Direct. Data as of June 30, 2025.

Source: Morningstar Direct. Data as of June 30, 2025.

Total inflows were highest in Q4-24, primarily driven by strong passive flows and robust active flows.
Source: Morningstar Direct. Data as of June 30, 2025.

Source: Morningstar Direct. Data as of June 30, 2025.

Thematic Funds Face Broad Outflows as Investor Interest Wanes
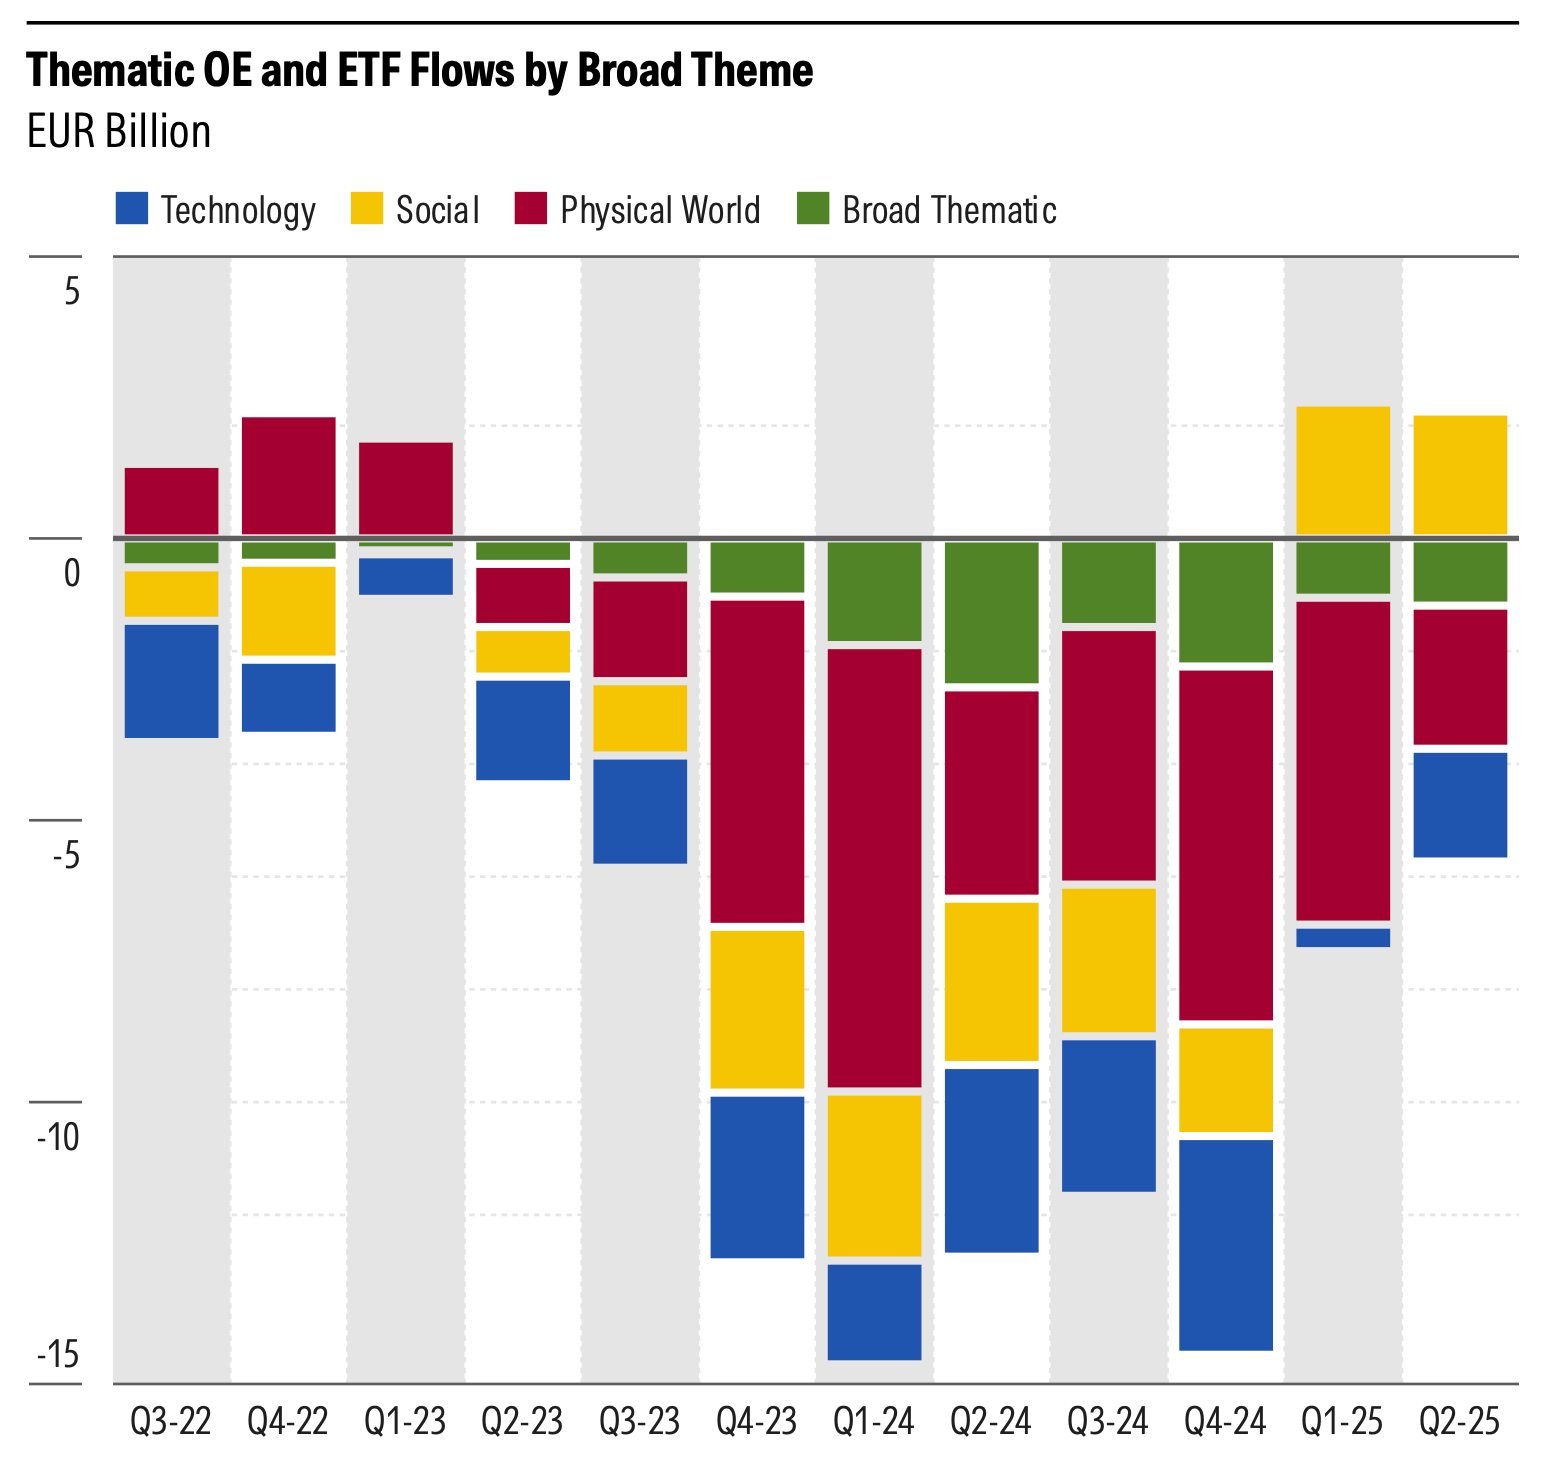
Thematic funds have seen a decline in popularity, with a total of EUR 87 billion in outflows over the past three years to the end of the second quarter of 2025. This

highlights a broader trend of investors retreating from too focused or niche investment themes. Funds focused on physical-world factors have experienced the largest outflows since 2023. For example, energy transition strategies saw EUR 0.9 billion in outflows in the second quarter.

Consumer and broad thematic strategies have lost nearly EUR 29 billion in the past three years. In contrast, funds targeting social factors (including security, demographics, politics, and wellness) gained EUR 2.2 billion in flows during the second quarter, extending the gains in the first quarter. This has been driven by investments in defense funds.

Amongst the broader technology funds universe, the artificial intelligence plus Big Data theme attracted EUR 0.4 billion of inflows in the second quarter, extending the gains made year to date.

This stacked bar chart illustrates quarterly net flows in EUR Billion for different broad thematic investment categories (Technology, Social, Physical World, Broad Thematic) within the OE and ETF market from Q3-22 to Q2-25. The chart displays both positive (inflows) and negative (outflows) values for each theme over time.

Source: Morningstar Direct. Data as of June 30, 2025.

Investors Display a Cautious Approach to US Dollar Equity and Bond Market Exposures

US large-blend equity ETFs saw outflows of EUR 3.3 billion. While investors did not show complete aversion to the US, they took a more cautious approach. Investors opted for globally diversified strategies or hedged US dollar risk, as evidenced by the inflows into FX-hedged share classes of ETFs included in the “other equity” category.

Source: Morningstar Direct. Data as of June 30, 2025.

More on European Asset Flows

Get more robust commentary and analysis on European ETF and ETC Asset Flows, including the information presented here, by downloading one of our free reports:

European ETF Asset Flows Update

European Fund Flows Commentary

You can scan the complete picture of the European ETF and ETC markets with your own free trial of Morningstar Direct.

You might also be interested in...