
What Is Bitcoin’s Network Worth?
Network effects are more complicated to model for bitcoin than for other assets.
/s3.amazonaws.com/arc-authors/morningstar/eda620e2-f7a7-4aef-bb6c-3fb7f1ac7a38.jpg)

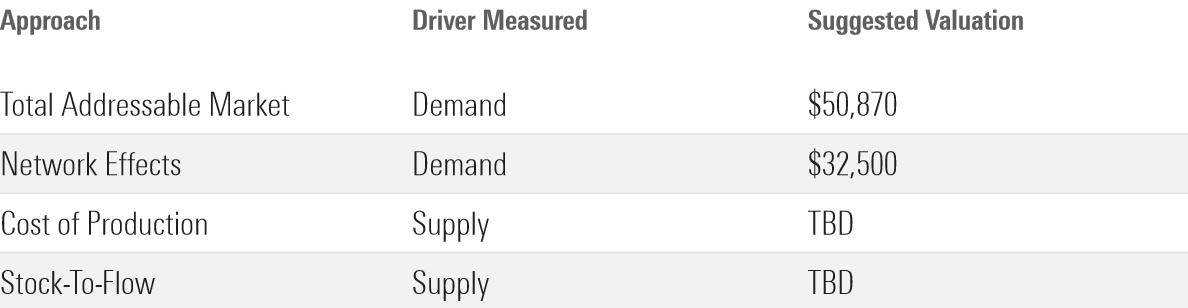
Recently, we’ve been walking through common approaches to valuing bitcoin. Last week I wrote about estimating demand using the “total addressable market” method, which gauges a new product’s capacity for penetrating a market. This week, in part two of this four-part series, we’re diving into the network effects model.
Whereas the total addressable market method is a “top-down” approach to modeling bitcoin demand, the network effects model is “bottom-up.” This method takes its name from a phenomenon known as a network effect, which is when a product or service becomes more valuable as more people use it.
Telephones are the classic example of a network effect. If there are only two telephone users in the world, each user only has one other person to call, and the telephone is probably not very useful. If each user has 50 other people whom they can call, a phone becomes more valuable.
Network effects can be powerful. Indeed, Morningstar’s equity analysts identify network effects as one of five potential “economic moat” sources that can grant a company durable competitive advantages over its peers.
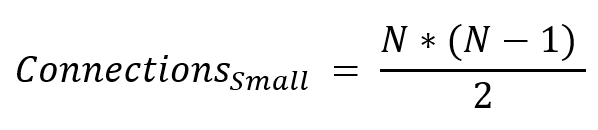
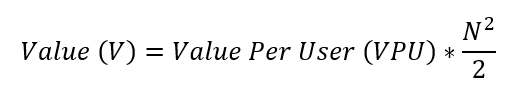
While few would contest that network effects exist, there’s much more debate over how much a network effect is worth. One approach, called Metcalfe’s law, argues that a network’s value is proportional to the possible number of connections that users could make with each other. Metcalfe’s law further posits that the number of connections for a given user base follows a formula. For small networks, the formula looks like this (“N” stands for the number of users):
In practice, that relationship looks a little something like this:
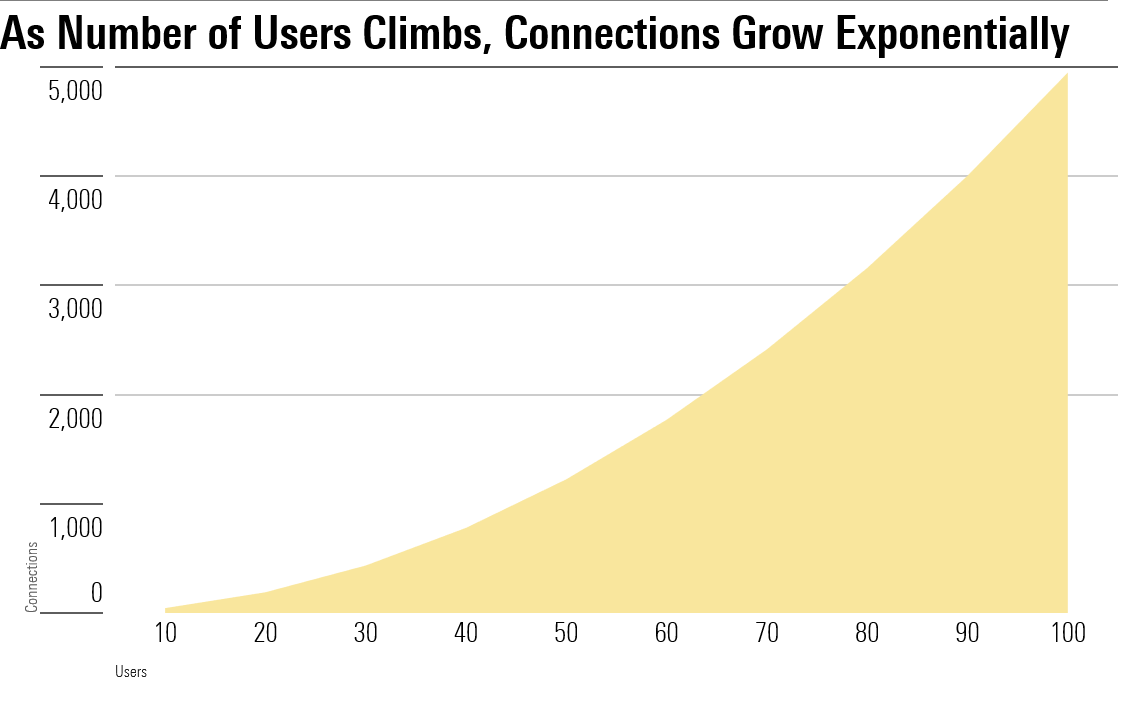
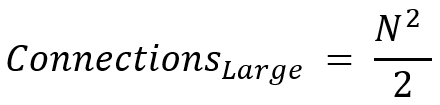
As the network accumulates users, the growth in connections gradually approaches the square of the number of users in the system.
Today, stock-pickers still usually spot network effects empirically rather than using a theoretical approach. Using Metcalfe’s law to estimate a network’s value to a company is still relatively untested from an academic perspective.
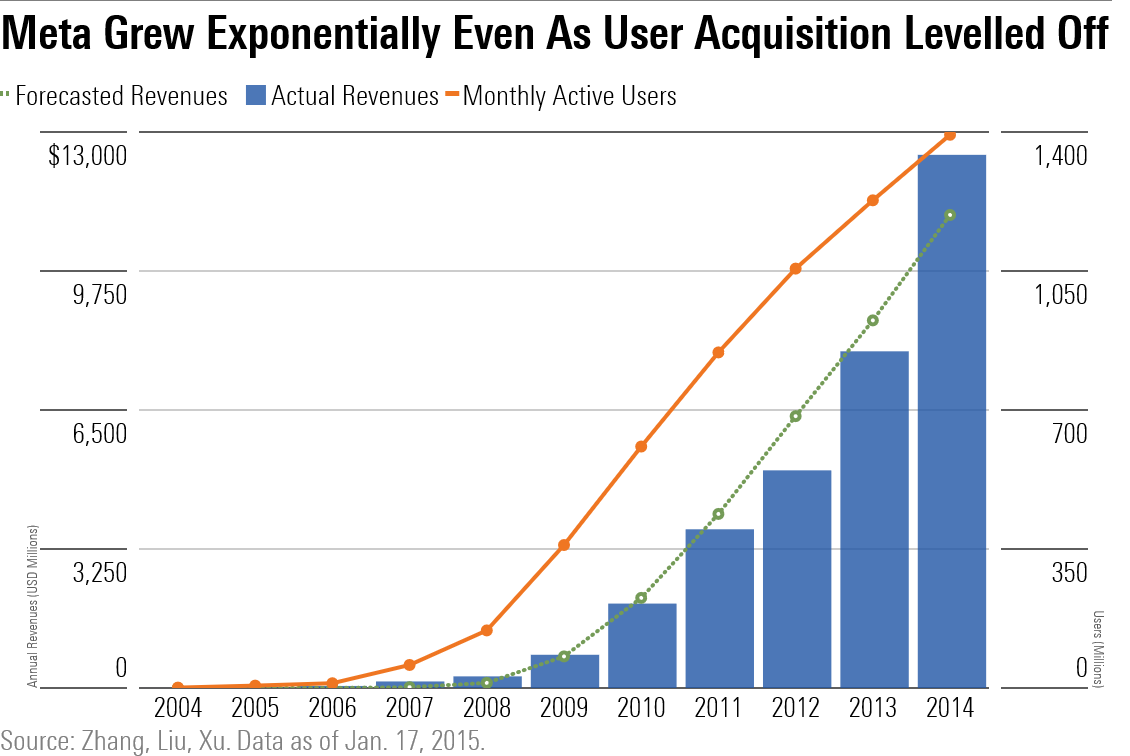
Metcalfe’s law is interesting, though, because it suggests that a company with a network effect won’t generate revenues that are proportional to the number of users. Instead, it will generate revenues that are proportional to the number of connections between users—in other words, the number of users squared.
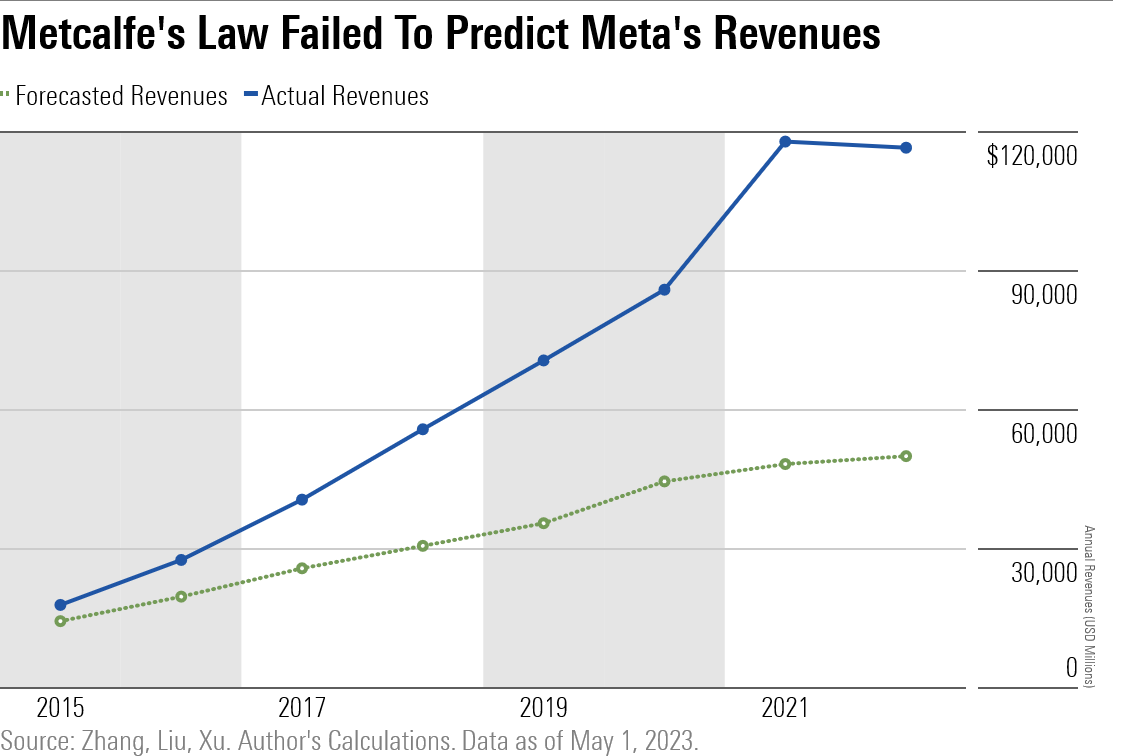
What this means is a company enjoying network effects can generate exponential revenue growth even if their user base grows in a straight line. Meta, whose revenues grew exponentially compared with the number of users on its platform, is a case in point.
Retooling the Formula for Bitcoin
Trying to model bitcoin with this approach is more complicated. A company can track the number of users on its platform; bitcoin does not. A company has annual revenues; bitcoin does not. Because we don’t have access to this data, we have to make some substitutions.
- We use the number of wallets on the blockchain as a proxy for users.
- We also use the price of bitcoin as proxy for revenue.
These substituted variables, though useful, aren’t perfect. That means we have to tweak the model in two ways.
- We don’t need to know how many shares of a stock a company has issued in order to estimate its revenue. For bitcoin, we do: The number of bitcoins that have been issued heavily influences the price. New bitcoins are minted every day, so we have to account for how the supply changes over time.
- Valuations of bitcoin under Metcalfe’s law commonly take the natural log of its input variables to calculate the price. This practice hails from foreign-exchange trading, where lognormal returns are commonly used to evaluate currency pairs.
Thus, with a few modifications, a simple formula like this:
Becomes this (“W” stands for wallets, and “S” stands for supply of tokens):
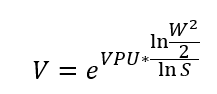
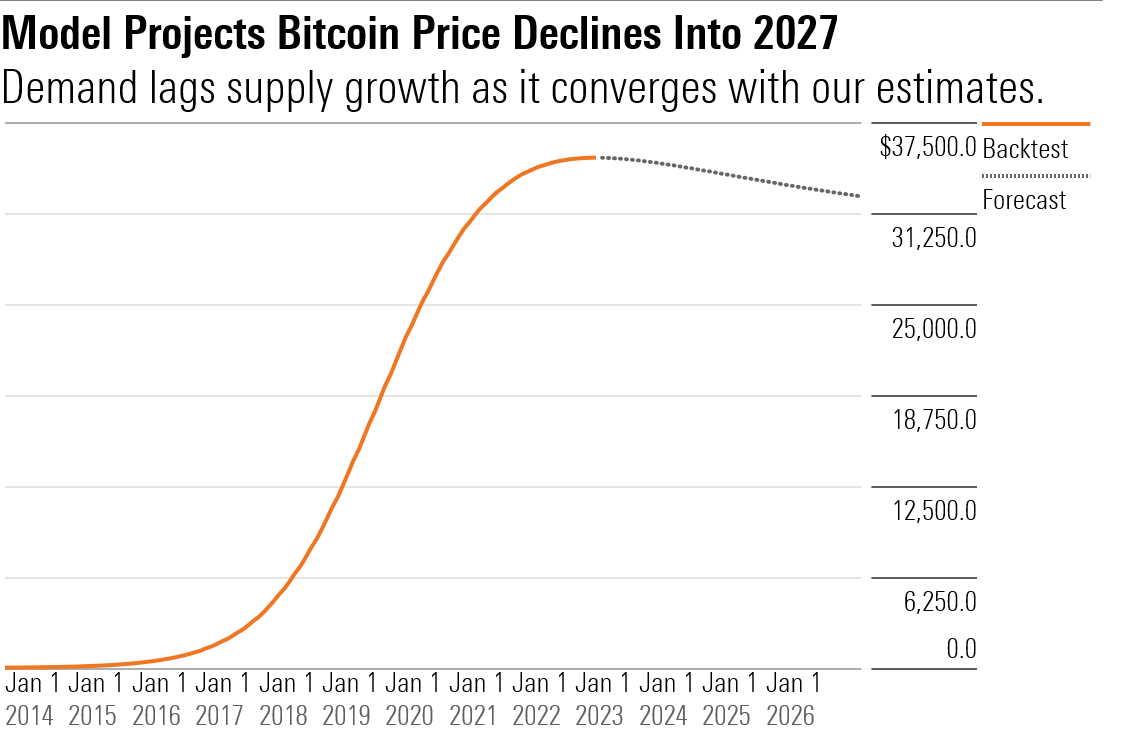
This modified model does appear to have a decent ability to trace the arc of bitcoin’s price history.
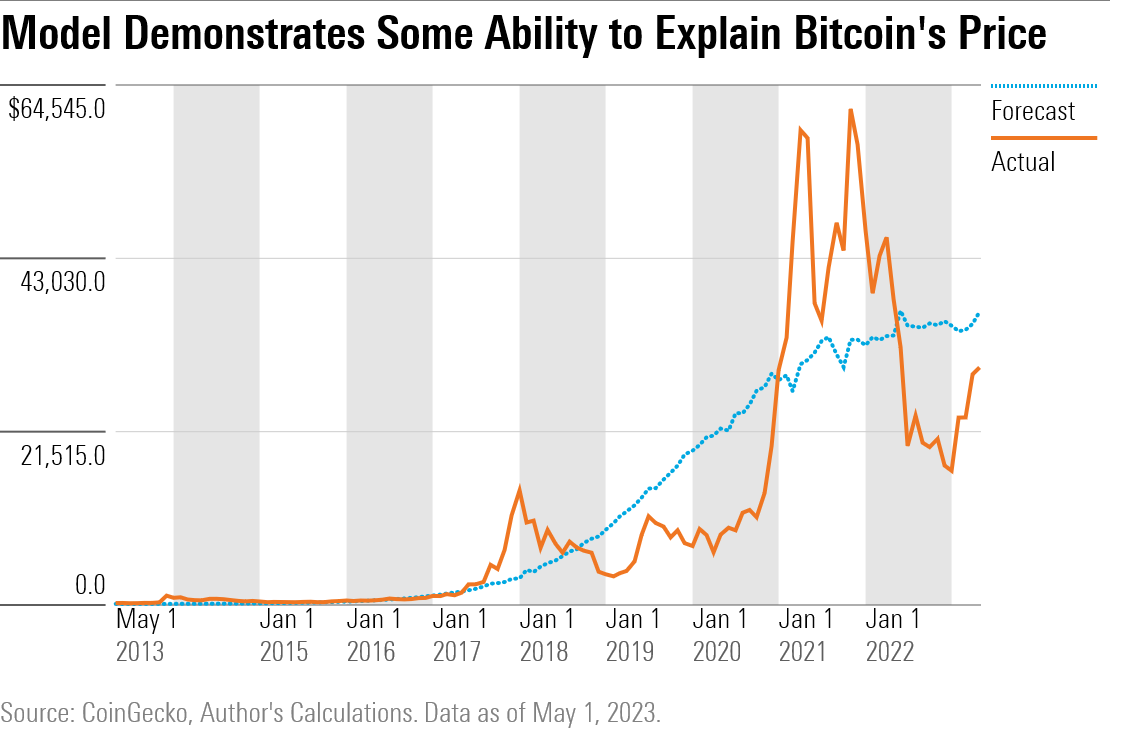
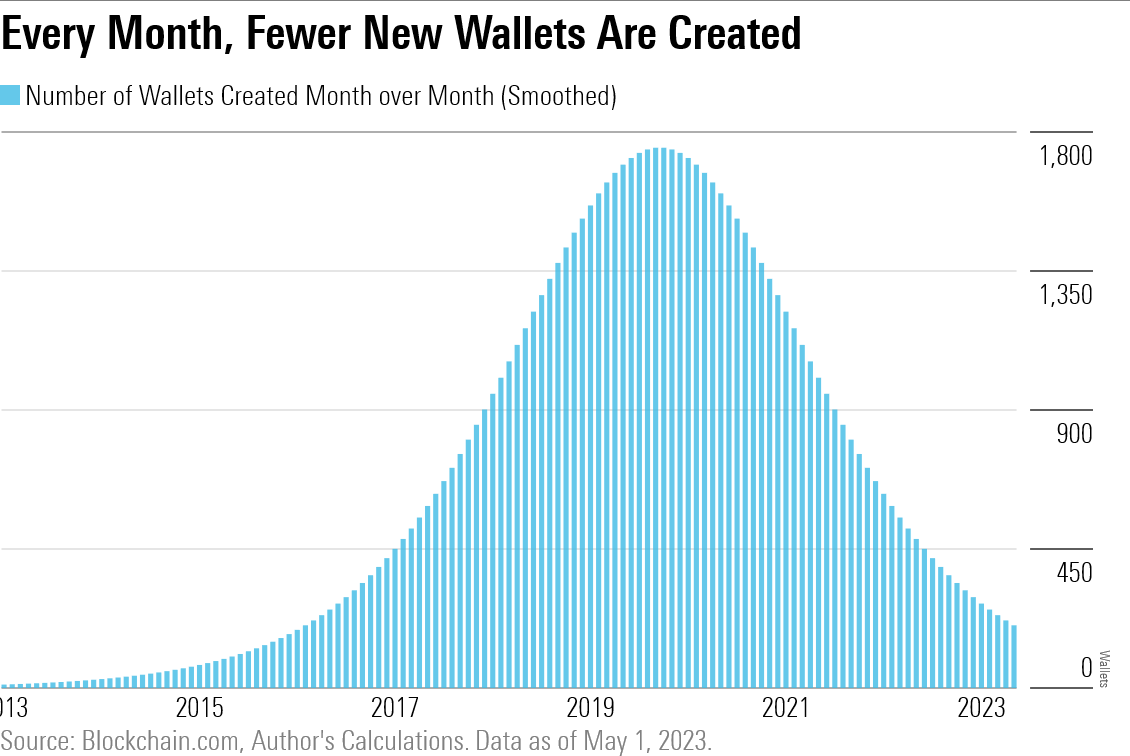
“Hang on,” you might be saying. “I thought Metcalfe’s law forecast exponential growth in value.” And you’d be right, but crucially, Metcalfe’s law only promises exponential growth to those networks with a steadily growing user base.
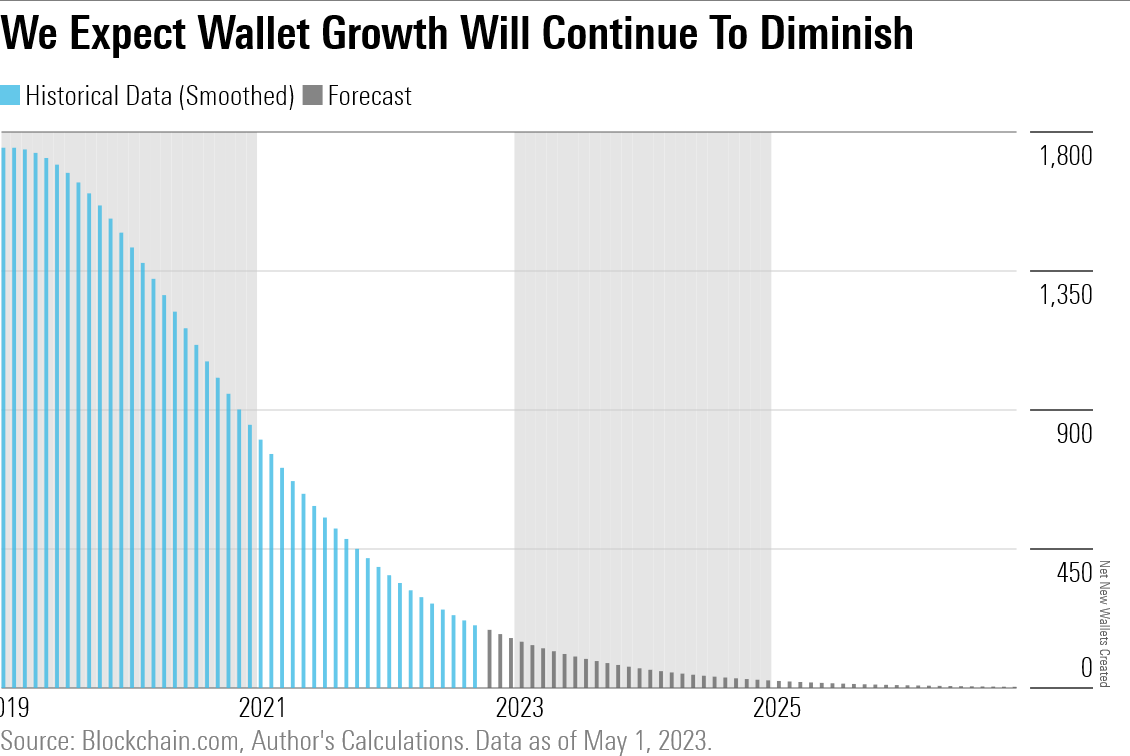
Problem is, bitcoin’s user base is anything but. Even with some smoothing, our data shows that the number of new wallets created in a single month peaked in late 2019. (In practice, it peaked about a year later amid the pandemic meme-stock frenzy.)
Putting It All Together
Now that we have our model, it’s time to plug in some assumptions. We assume that the number of people opening wallets each month continues to taper off at its current rate, suggesting that the market will reach saturation at 87.5 million wallets. We expect that bitcoin will completely close that gap by 2027, four years from now.
Outside of our assumptions, we know two things for sure.
- A mature population of wallets, plus a generous time horizon, implies a slow growth rate.
- No matter what, bitcoin’s algorithm will continue to issue tokens at a fairly predictable clip.
That implies that miners will mint new bitcoin faster than bitcoin can attract new users. If Metcalfe’s law holds, this means that, as the token supply increases, then the price of bitcoin will drop.
How is that possible? Remember that the number of tokens issued is the denominator in our formula. That means that, as token issuance grows and user growth slows, our exponent shrinks, which causes the price to moderate relative to its current levels. Ultimately, this model projects a terminal price converging at around $32,500 in July 2027.
Limitations
Even though we end up with a seemingly clear price target, that doesn’t mean it is time to run out to start shorting bitcoin. For one thing, remember that even in stock analysis, Metcalfe’s law has only been studied a handful of times.
This could be at least partly because Metcalfe assumes a constant value per user, denoted VPU in our formulas. We know this doesn’t hold empirically—companies are continually seeking to maximize how much money they can make off their users.
This limits the model’s efficacy out-of-sample. Take a look at how the most famous Metcalfe’s law model performed over the subsequent eight years after it was published.
Translating the model from stocks to crypto introduces additional wrinkles. Importantly, the number of wallets is a flawed proxy for users. In an ideal world, we would be able to measure the number of owners of bitcoin. In practice, many investors allow exchanges like Coinbase to hold custody of their bitcoin in Coinbase’s proprietary wallets, which masks the total user base.
Finally, creating assumptions means that you’re always at risk of being wrong. Our premise of declining growth in wallet creation could be a false one. We smoothed the original wallet growth data to get a symmetrical curve, but actual wallet creation data is slightly asymmetric because of the pandemic boom in crypto investment. Another regime change is always possible.
What’s the Verdict?
It’s a plain truth that neither the total addressable market approach nor the network effects approach is going to perfectly forecast demand for bitcoin. Because crypto is so new, these models are still very raw tools. But they do tell us something interesting about the practice of forecasting itself.
In general, the total addressable market approach struck an upbeat tone for bitcoin’s future, while the network effects approach suggested a more dour outlook.
Even outside of crypto, this relationship is not unusual. A bottom-up approach like the network effects method will often sound a more cautionary note than a top-down approach like the total addressable market model. It’s as true for stocks as it is for bitcoin—ask anyone who’s compared a multiples-based valuation with a discounted cash flow valuation.
Neither method is necessarily more sound. Even so, as analysts, we tend to favor bottom-up forecasts. They’re a healthy reminder that, in business, success is not destiny—it has to be earned. And just because an innovative product excites you does not mean that the rest of the world underestimates its worth. Sometimes, in investing, it pays to stay humble.
A note on the disclaimer below: Most digital assets, including the cryptocurrencies mentioned in this article, are not currently classified as shares of registered securities by the SEC and therefore do not fall under Morningstar’s editorial policies. However, in the interest of full disclosure, the author of this article does own digital assets mentioned in this article.
The author or authors do not own shares in any securities mentioned in this article. Find out about Morningstar’s editorial policies.
/cloudfront-us-east-1.images.arcpublishing.com/morningstar/CGEMAKSOGVCKBCSH32YM7X5FWI.png)
/cloudfront-us-east-1.images.arcpublishing.com/morningstar/OMVK3XQEVFDRHGPHSQPIBDENQE.jpg)
/cloudfront-us-east-1.images.arcpublishing.com/morningstar/BL6WGG72URAJJJCPC4376SZKX4.png)
:quality(80)/s3.amazonaws.com/arc-authors/morningstar/eda620e2-f7a7-4aef-bb6c-3fb7f1ac7a38.jpg)