
Are ‘Cash-Plus’ Strategies Really a Cash Cow Today?
Funds that keep assets in cash stand to benefit from higher interest rates. But the relationship is not as straightforward as it seems.
/s3.amazonaws.com/arc-authors/morningstar/eda620e2-f7a7-4aef-bb6c-3fb7f1ac7a38.jpg)
Rising interest rates have an annoying habit of upsetting the traditional stock/bond diversification apple cart. Alternative investments tend to come into vogue during these environments because most claim to offer some level of diversification against stocks and bonds. A subset of alternative strategies sees expected returns rise along with real rates because of how they’re composed.
Most liquid alts strategies benefit in at least some way from higher risk-free rates. Some may take the added step of hedging or eliminating their raw market exposure, which means their performance profile does not necessarily move with the direction of the market. As a result, these liquid alts strategies manage to what’s known as a “cash-plus” benchmark.
Yields on the three-month Treasury bill have risen by 4.9 percentage points from February 2022 to August 2023, renewing interest in “cash-plus” strategies. When short-term interest rates outpace inflation, these funds should pass along higher real returns to investors. But our research shows that this is still true more in theory than in practice. Over the past decade or so, the average investor in a liquid alt mutual fund has not experienced an uptick in performance during environments with elevated cash rates.
What Is Cash-Plus?
Cash-plus benchmarks are hypothetical, not investable. The “plus” part is nothing more than an aspiration. It typically falls between 2% and 4% and represents the value a manager hopes to add to returns after fees. The “cash” part, though, is real. It represents the risk-free rate, which fluctuates with prevailing interest rates.
Two liquid alts categories maintain large cash holdings and comparatively low market exposure: trend-following and equity market-neutral strategies. They both tend to manage to cash-plus benchmarks as a result.
We would expect to see systematic trend strategies and equity market-neutral strategies perform better during these periods of higher cash rates. But the data doesn’t bear that out. Realized returns for equity market-neutral and systematic trend-following strategies, on average, showed no clear improvement during elevated interest-rate environments.
No Observable Performance Advantage From Higher Yields
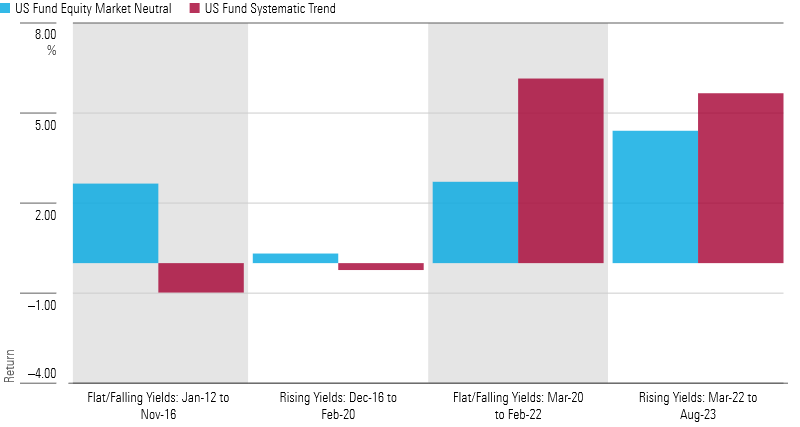
Of course, there are caveats. In the mutual fund world, liquid alts only started gaining in popularity after the financial crisis, reaching critical mass in 2012. Between the start of that year and September 2023, there were only two periods when the U.S. three-month Treasury bill yielded in excess of 0.5%: December 2016-February 2020 and March 2022-August 2023.
Even so, this result isn’t especially surprising. Liquid alts strategies court exposure to a range of financial market conditions. For example, systematic trend strategies may go long in bond markets, which tend to do poorly during rising-rate environments. At the modestly elevated cash rates that prevailed throughout the 2010s, these exposures outweigh the effect of elevated cash rates.
Keep in mind that these are short time horizons with endpoint bias. Index series like the Credit Suisse Hedge Fund indexes and FT Wilshire Liquid Alternative indexes show better results over longer time horizons. That being said, those benchmarks are asset-weighted, while category averages are not.
Either way, we can say that cash-plus strategies don’t necessarily experience improved performance just because “cash” does. What about the “plus?” We can isolate managers’ excess returns by deducting the results of the ICE BofA US 3 Month Treasury Bill index. (We picked that bogy because it’s the most common cash proxy among liquid alternatives funds.) Can managers consistently generate excess returns above the risk-free rate?
The equity market-neutral category average appears to have done so at least some of the time. During higher interest-rate environments, though, it falls below the 2% threshold that many managers aim for.
Excess Returns Fail To Clear 2% Threshold
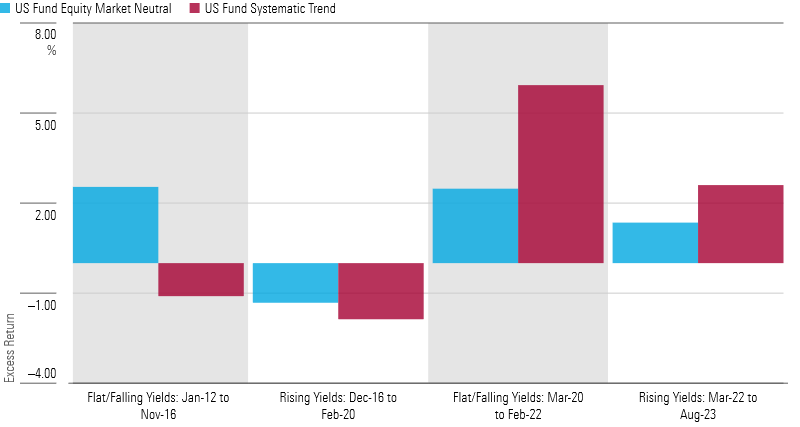
While the systematic trend-following category average’s excess returns vary widely, that’s probably due to the nature of the category. Systematic trend-following strategies thrive when there are persistent movements up or down in a given asset class—less so when markets bounce around day-to-day.
Remember, 11 years in mutual funds is a short history. Interest rates haven’t trended above 2.5% since before the financial crisis. The current market environment, with short-term rates above 5%, is uncharted territory.
Zooming Out
Alternatives managers that have some exposure to equity markets have good reason to feel left out of this analysis. They also can benefit from higher-rate environments, even if the explicit benefit might be outweighed by market risk.
That’s because there are other implicit benefits to be reaped during higher-rate environments. For example, higher interest-rate environments should spark higher volatility, favorable conditions for alternatives because there are more short-term dispersions to take advantage of.
We can compare alternatives categories against each other by looking at alpha, which measures outperformance after accounting for market sensitivity and risk-free rate.
Most Nontraditional Morningstar Category Averages Fail To Deliver Alpha
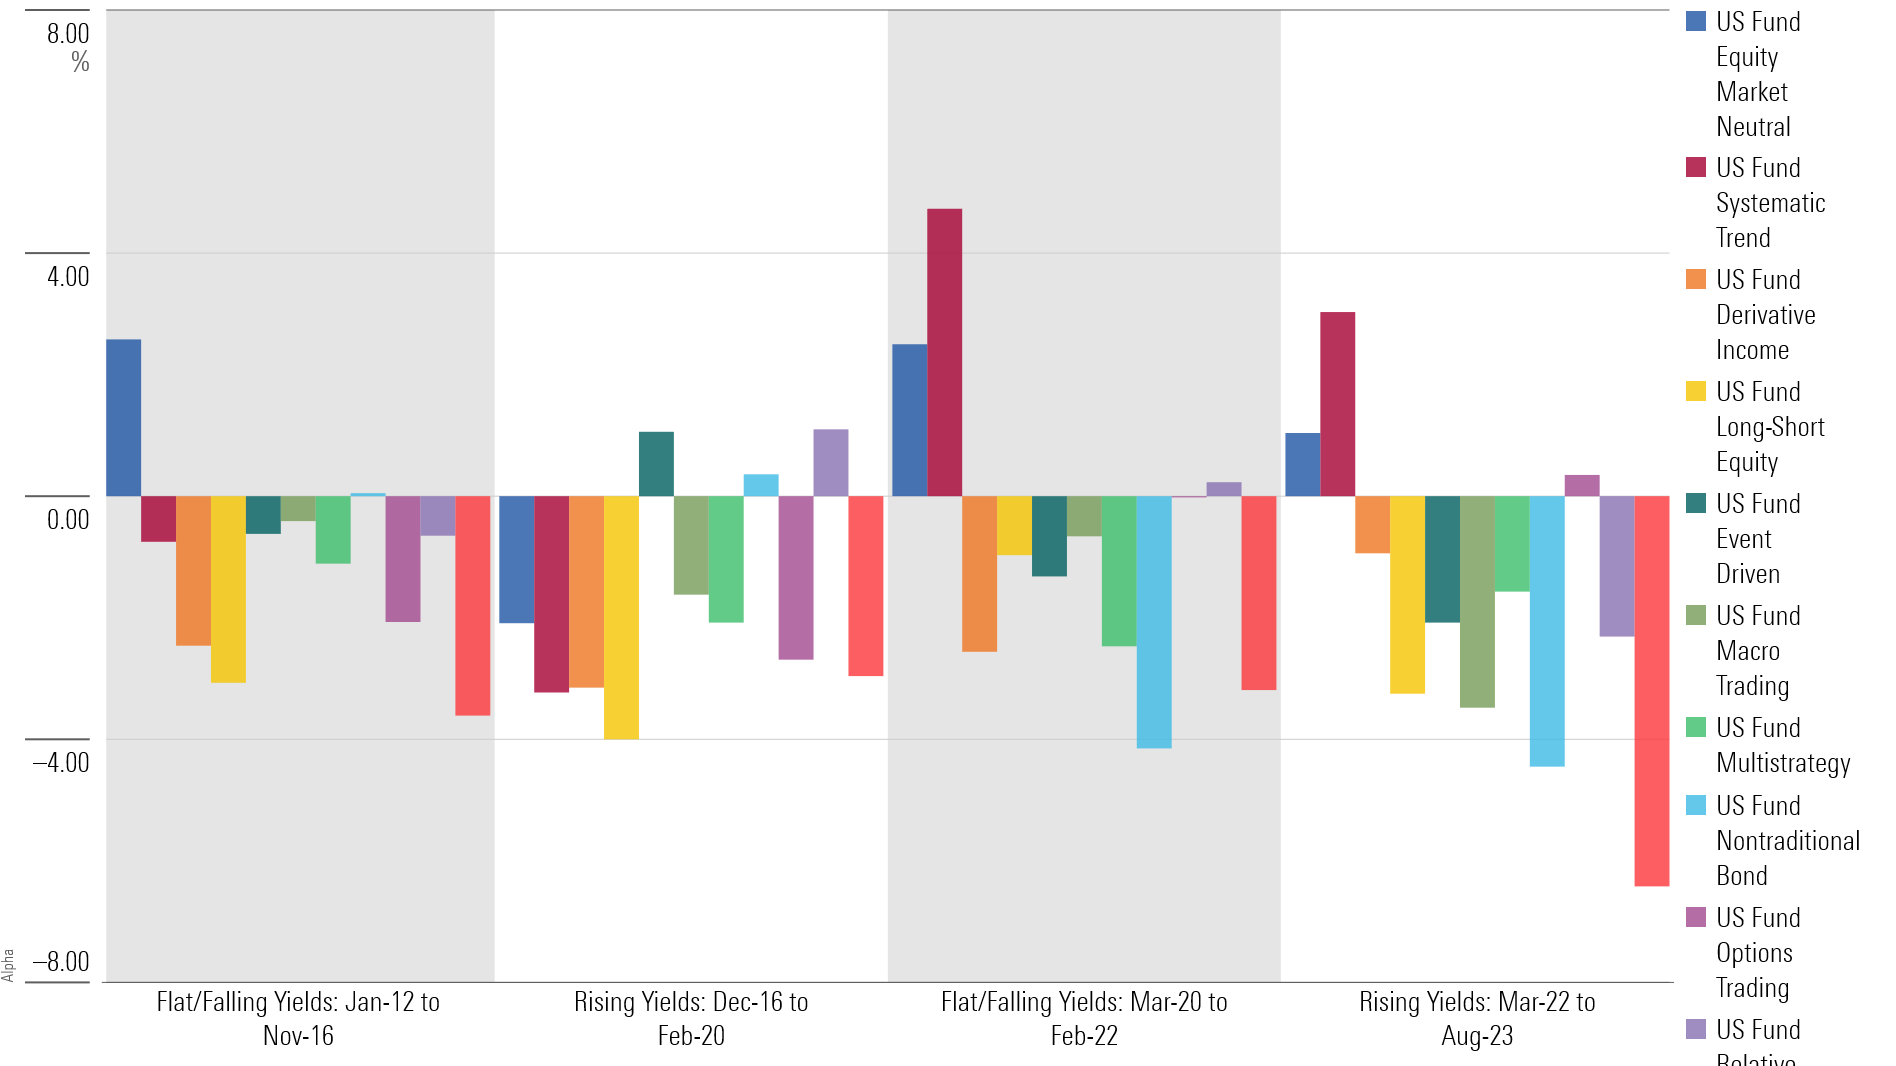
These results are not very inspiring. Only our cash-plus categories outperform after adjusting for their (minimal) systematic risk, as measured by the Morningstar US Market Index.
This is a preliminary examination, and there are other angles that may be worth examining in future research.
While the results are real, category averages are not investable. Examining the performance of individual funds would be more robust, but labor-intensive. Cross-examining these findings against other factors like volatility would also be useful.
There is at least one general takeaway that we can make from this study, though. Given the variability of results, it’s no wonder that many investors put alternatives in their “Too Hard” pile. Live track records for liquid alts mutual funds are comparatively short, funds in this group die off at an elevated clip, and as a result, it’s difficult to draw statistically robust conclusions about their expected performance in different market environments.
Even when the pitch is as simple as “cash plus,” the experience can just as often be “cash minus.”
The author or authors do not own shares in any securities mentioned in this article. Find out about Morningstar’s editorial policies.
/cloudfront-us-east-1.images.arcpublishing.com/morningstar/HTLB322SBJCLTLWYSDCTESUQZI.png)
/cloudfront-us-east-1.images.arcpublishing.com/morningstar/TAIQTNFTKRDL7JUP4N4CX7SDKI.png)
:quality(80)/s3.amazonaws.com/arc-authors/morningstar/eda620e2-f7a7-4aef-bb6c-3fb7f1ac7a38.jpg)