Skip to Content
Sustainable Investing

11 Charts Examining the Racial Wealth Gap

What data tells us about the disparities along racial lines for income, savings, and overall financial well-being.

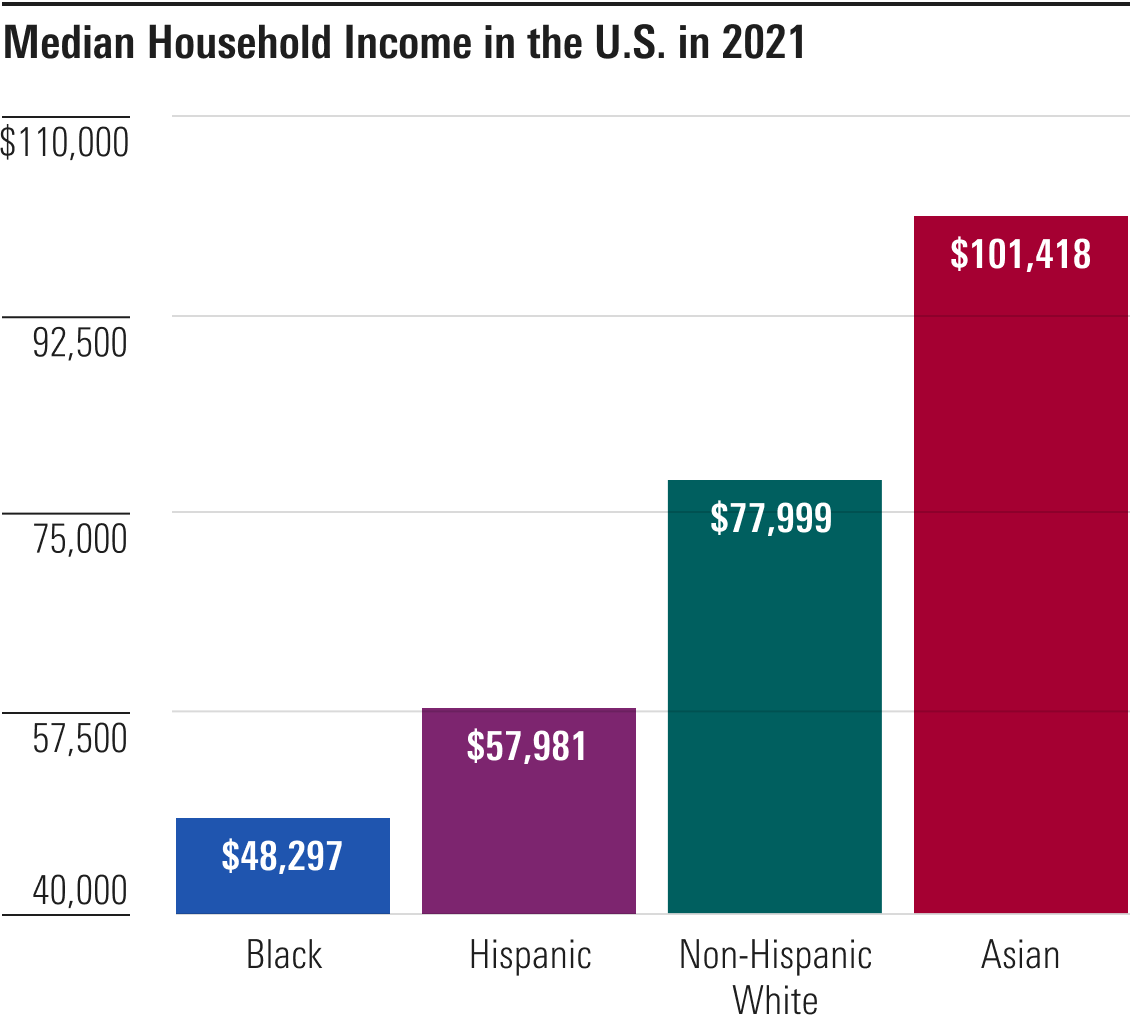
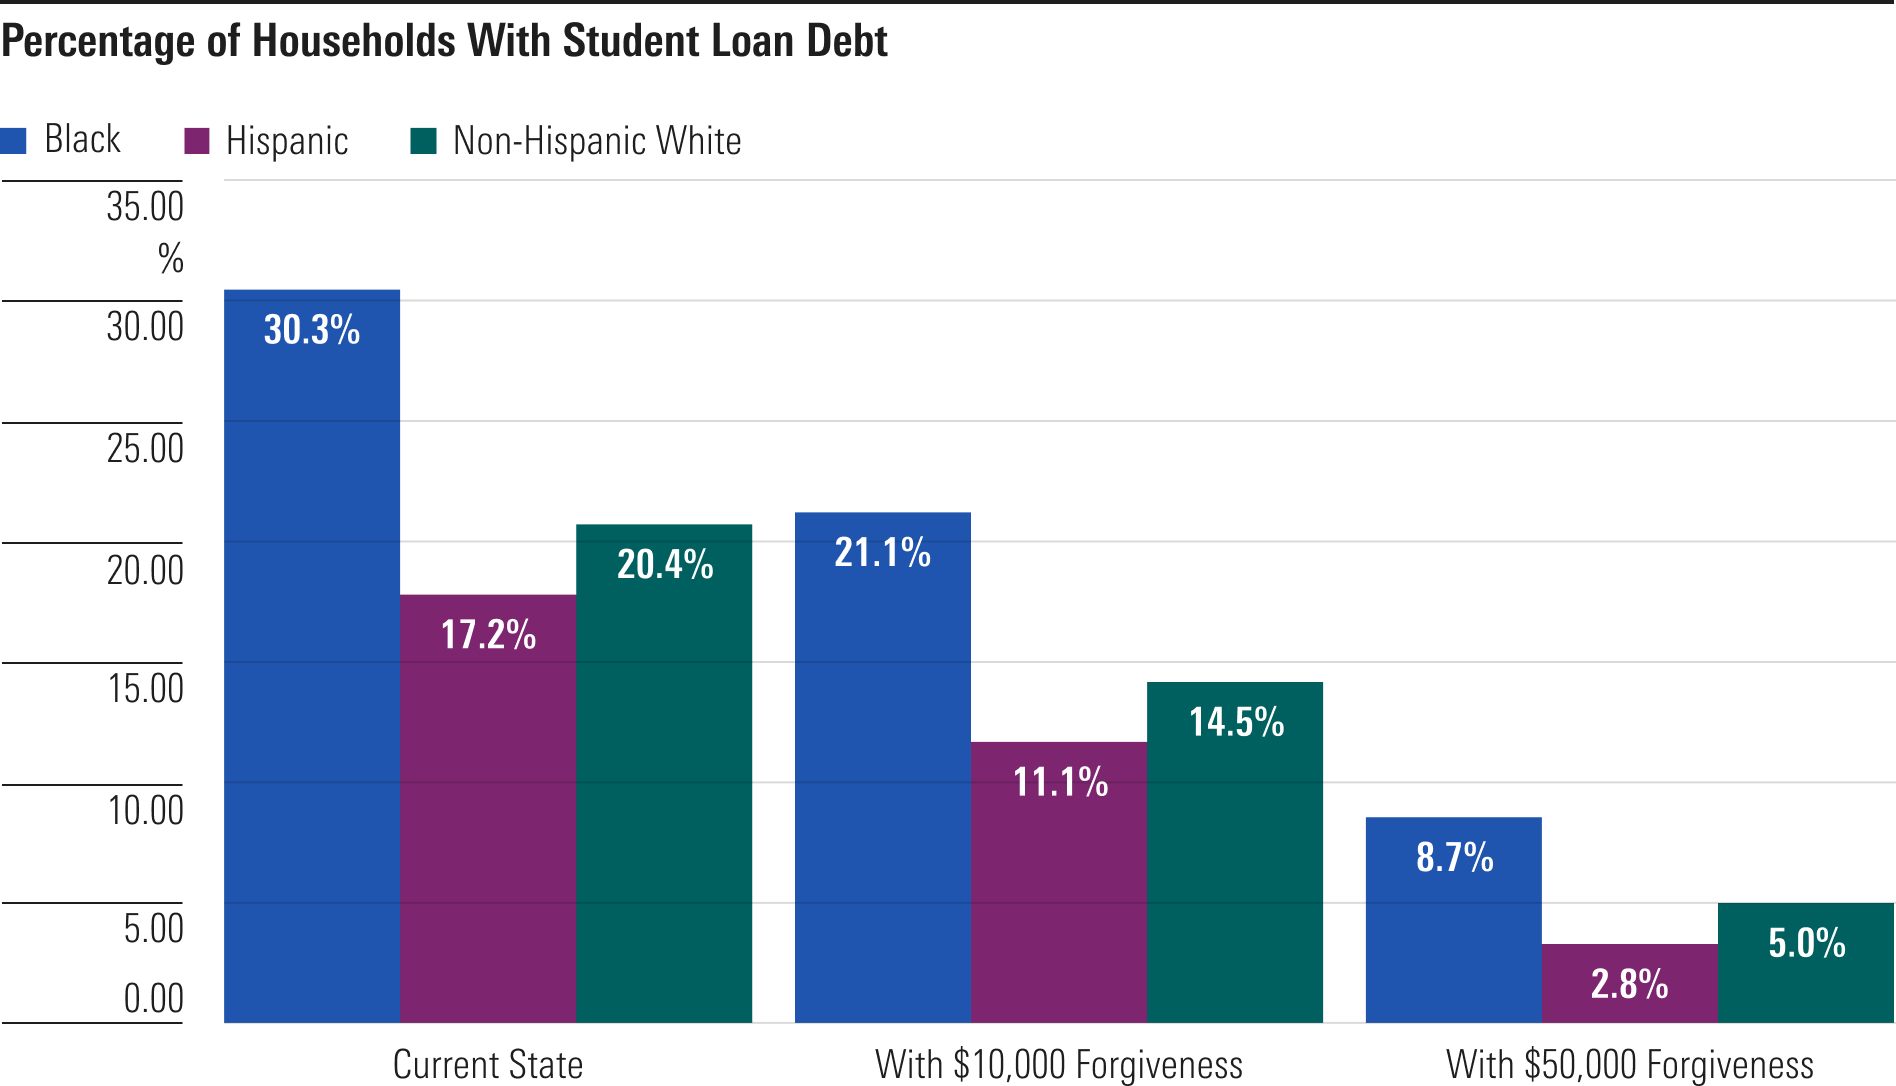
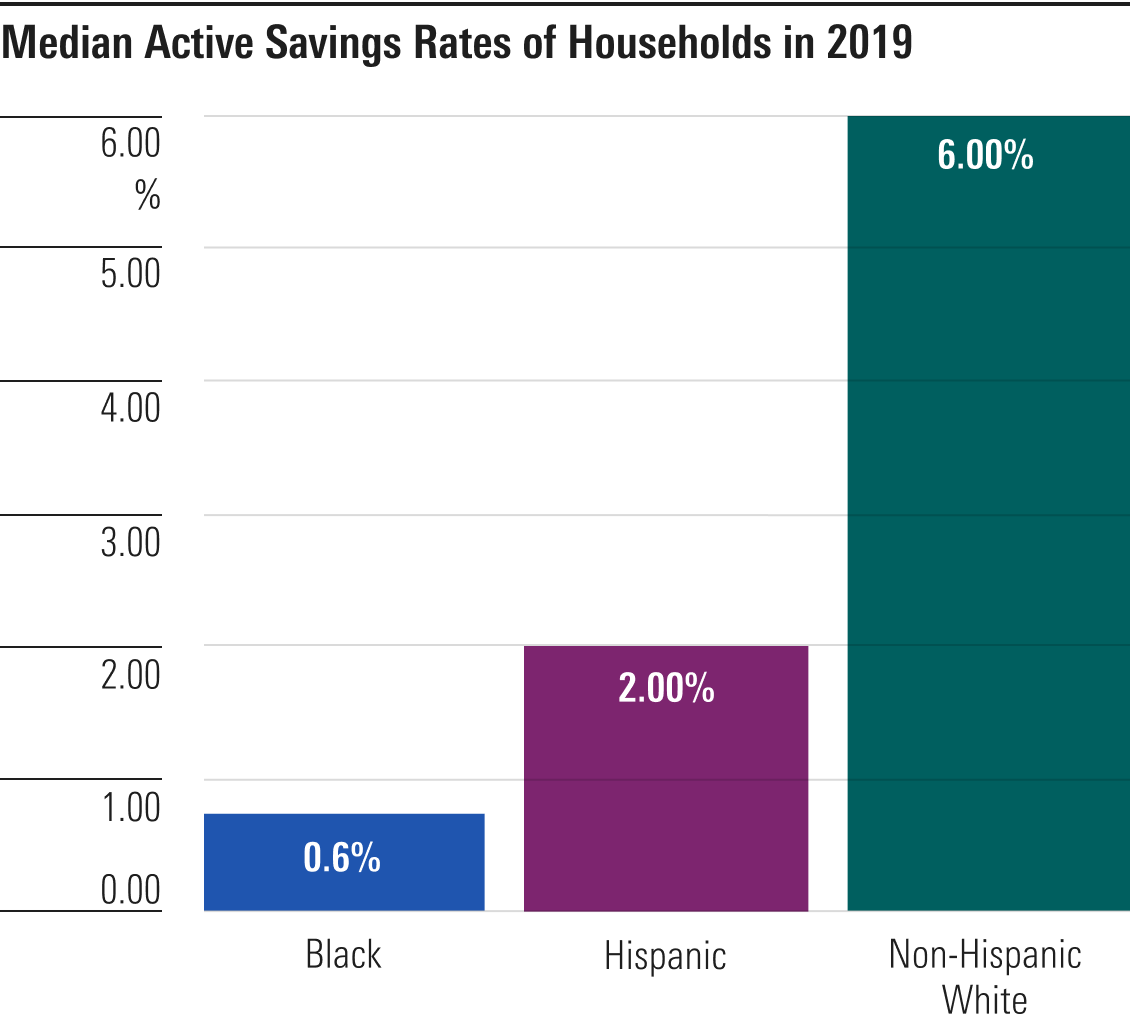
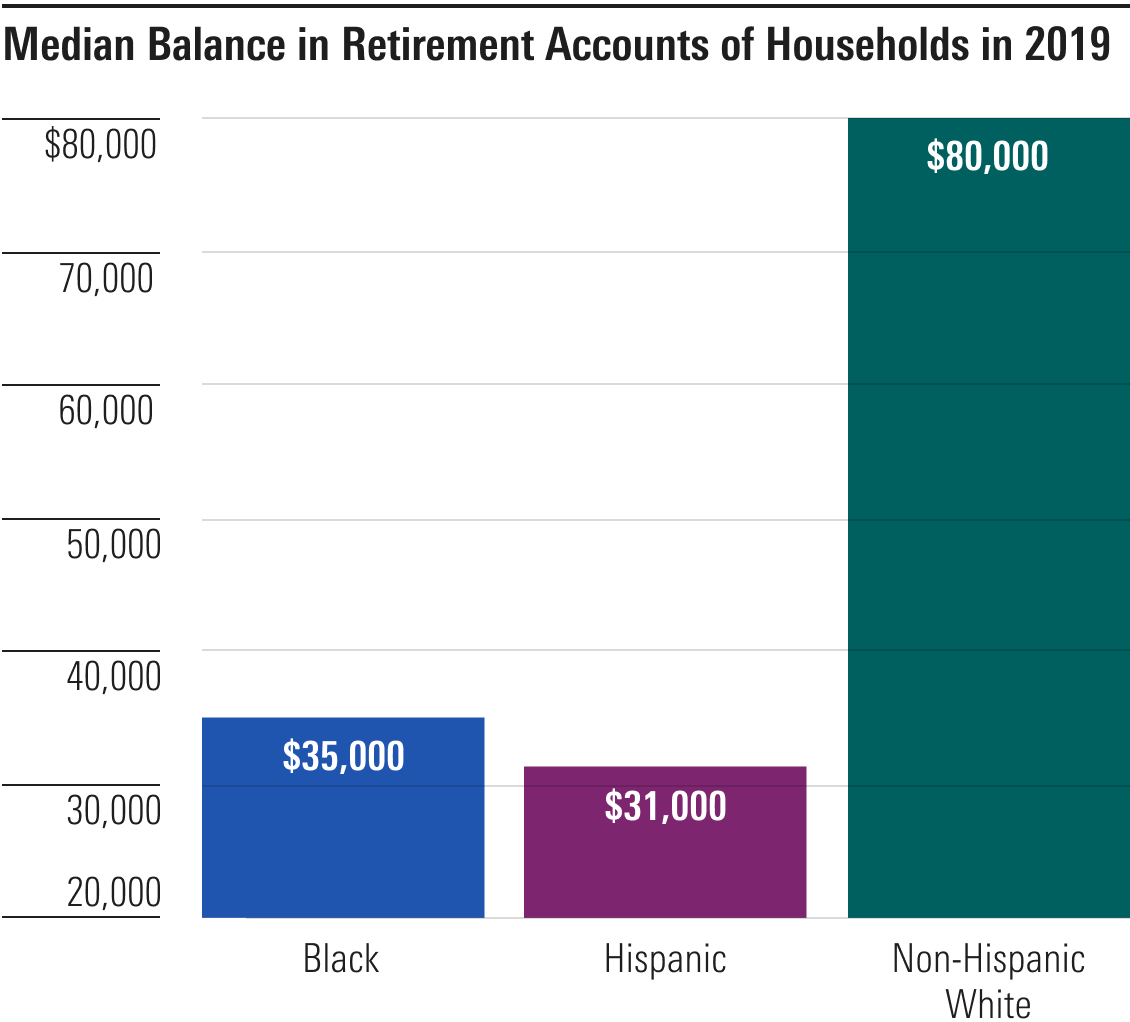
Racial inequality in the United States has many dimensions, but one of the most impactful and broad-ranging is economic. On average, people of color experience significantly lower levels of income, retirement savings, and rates of homeownership than non-Hispanic white Americans. They also face different struggles while paying down student loan debt.

Making strides toward improving these issues, let alone solving them, is far from simple. But a first step is acknowledging and understanding the magnitude of the problem.

Here are some key statistics about the impact of the racial divide for income, savings, and overall financial well-being. (You can find a full list of the stats in this previous article.)

Income

While the racial wealth gap is the result of multiple factors, a disparity in income is the main contributor.

In 2021, the median non-Hispanic white household made nearly $78,000, compared with just over $48,000 and just under $58,000 for Black and Hispanic households, respectively. Asian households come out with a median household income of more than $101,000, according to the U.S. Census Bureau.

A bar graph shows the differences in median household income in the U.S. in 2021, with Black households coming in last, followed by Hispanic households, Non-Hispanic White households, and Asian households.

Source: Census Bureau, data as of January 2023.

To put this in even simpler terms, the median Black and Hispanic household earned 62% and 74%, respectively, of the income of every median non-Hispanic white household in 2021, according to census data.

Income gaps between races in America make it much more difficult for people of color, particularly across generations, to build more wealth. This results in a difference in the advantages that are available to families who are able to benefit from upward economic mobility across generations while others stay in place or even experience a decline.


Source: Census Bureau, data as of January 2023.
Figures have been adjusted for inflation to reflect their value in 2021.

One policy solution that could potentially help close this income gap is an idea called “baby bonds,” originally proposed by two academics: Darrick Hamilton and William Darity.

Baby bonds are applied when the government contributes to savings accounts for children under 18, with the contributions determined by family income or wealth. When a recipient turns 18, the money can go toward certain uses, such as paying for college or buying a house.

At Morningstar, we believe it is important to use our expertise to analyze the effect such programs could have on reducing the racial wealth gap and the trade-offs in how such programs are designed.

Poverty

Poverty can take on many forms. It’s not always as obvious to identify as one may think, meaning that it could also be far more common than expected.

Based on the stipulations established by the bureau, the threshold to determine if a family of four technically lives in poverty in 2021 was an income of $27,740. (In 2020, this number was $26,246.) Now, compared with the average cost of living in much of the country, it’s debatable whether or not this low threshold is accurate and realistic.

According to 2021 census data, Black Americans were more than twice as likely to be living in poverty than non-Hispanic white Americans. Hispanic Americans weren’t very far behind. There was also an increase in poverty rates in the Asian American population, specifically in those over 65.

Homeownership Rates and Value

Homeownership has long been considered a vital part of obtaining upward financial mobility.

But, as of 2019, the gap between homeownership rates, net worth, and median home values of Black and Hispanic households compared to non-Hispanic white households are still considerably wide.

Perhaps, if the homeownership gap closes, it will truly be a way for all families to build and pass down wealth across generations.

A bar graph displays the difference in median home values as of 2019. Black homes value come in last, followed by Hispanic home values and then Non-Hispanic White.

Source: Survey of Consumer Finances. Note: Most recent data as of 2019.


Student Loan Repayment

According to data from the Survey of Consumer Finances, nearly one third of households in the U.S. have student loan debt. But the average Black household has more to pay off than other households.

And, if trends that the Brookings Institution first published in 2016 still hold true, Black college graduates still owe considerably more than non-Hispanic white graduates four years after college due to factors such as interest accrual and graduate school borrowing, which is part of why student loan forgiveness has been discussed so widely in recent years.

A bar graph displays median student loan debt, depicting higher totals at both graduation and four years later for Black graduates compared to Non-Hispanic White graduates.

Source: The Brookings Institution. Note: Most recent data released in 2016.

We recently looked at the breakdown of households with student loan debt by income quartile now, as well as these breakdowns after $10,000 and $50,000 of loan forgiveness, to see what impact it could have.

A bar graph shows that Black households have the highest percentage of student loan debt, followed by Non-Hispanic White households and Hispanic households. The chart then goes to show how student loan forgiveness would impact each.

Source: Survey of Consumer Finance and Morningstar analysis as of February 2021.


Looking at the changes in the lowest-and highest-income quartiles, $10,000 forgiveness removes student debt for 34% of households in the lowest quartile and 29% of households in the highest quartile.

Savings Rates

Saving, in general, is something that a lot of Americans can improve. There are even differences in how people save based on which parts of the country they live in.

The savings rate for Black and Hispanic households in 2019 were .6% and 2%, respectively, compared to 6% in Non-Hispanic White households.

Source: Morningstar analysis, as of August 2021.

The differences are pronounced when it comes to saving for retirement.

While many savvy investors can aim for a goal, such as having seven figures saved up by the time they retire, others are nowhere close. And the shortcomings in savings are even more drastic for Black and Hispanic families.

Source: Survey of Consumer Finances. Most recent data released in 2019.


About the Authors


Keith Reid-Cleveland is an editor for Morningstar.
Nura Husseini is a designer for Morningstar.

Contributors


Design editor: Alex Skoirchet
Editor: Ann Sanner King


Editor's note: This article was last published on Jan. 25, 2022. It is updated on an ongoing basis as data becomes available.

This content is not intended to be individualized investment advice, but rather to illustrate possible factors that can impact financial decisions. Investors should consider this information in the full context of their own financial decisions.

Read our editorial policy to learn more about our process.