
What High Inflation Means for Stocks, Bonds, and Your Portfolio
Historical returns reveal how major asset classes have weathered high inflation and what those patterns mean for portfolio diversification.


Heading into 2026, most economic forecasters were relatively confident that inflation would continue moderating. Based on research from the Blue Chip survey of economic indicators, the consensus view from economists surveyed was a 2.9% inflation rate for the full year.
At first, the inflation picture seemed like it might turn out even better: Year-over-year Consumer Price Index growth clocked in around 2.4% in both January and February 2026. Since then, though, inflation has consistently registered above 3%. After the US and Israel started joint airstrikes against Iran at the end of February, ongoing supply disruptions in the Strait of Hormuz have kept inflation stubbornly high. It reached as high as 4.2% in April 2026, and came in hotter than expected at 3.7% for September 2026.
Long story short, inflation isn’t dead yet.
So, it seems like a good time to highlight some research from our annual Diversification Landscape examining how major asset classes have historically performed during periods of high inflation.
Stock/Bond Correlations During Inflationary Periods
Because stocks and bonds are structurally different, they generally don’t move in lockstep. Since 1960, correlations between stocks and bonds have averaged about 0.08. In a portfolio context, that gives bonds additional risk-reduction benefits—over and above their lower volatility on a stand-alone basis.
However, the correlation between stocks and bonds isn’t static. Periods of low inflation create the best conditions for stock/bond correlations. Thanks in part to below-average inflation, rolling three-year correlations between stocks and bonds were consistently negative (or barely above zero) from November 2000 through 2020.
High inflation, on the other hand, is a negative for both stocks and bonds. As a result, the stock/bond correlation has often been positive over other periods of high inflation, defined as periods when year-over-year inflation increased by at least 5% and remained high for at least six months.
Risk, Returns, and Correlations: Inflationary Periods
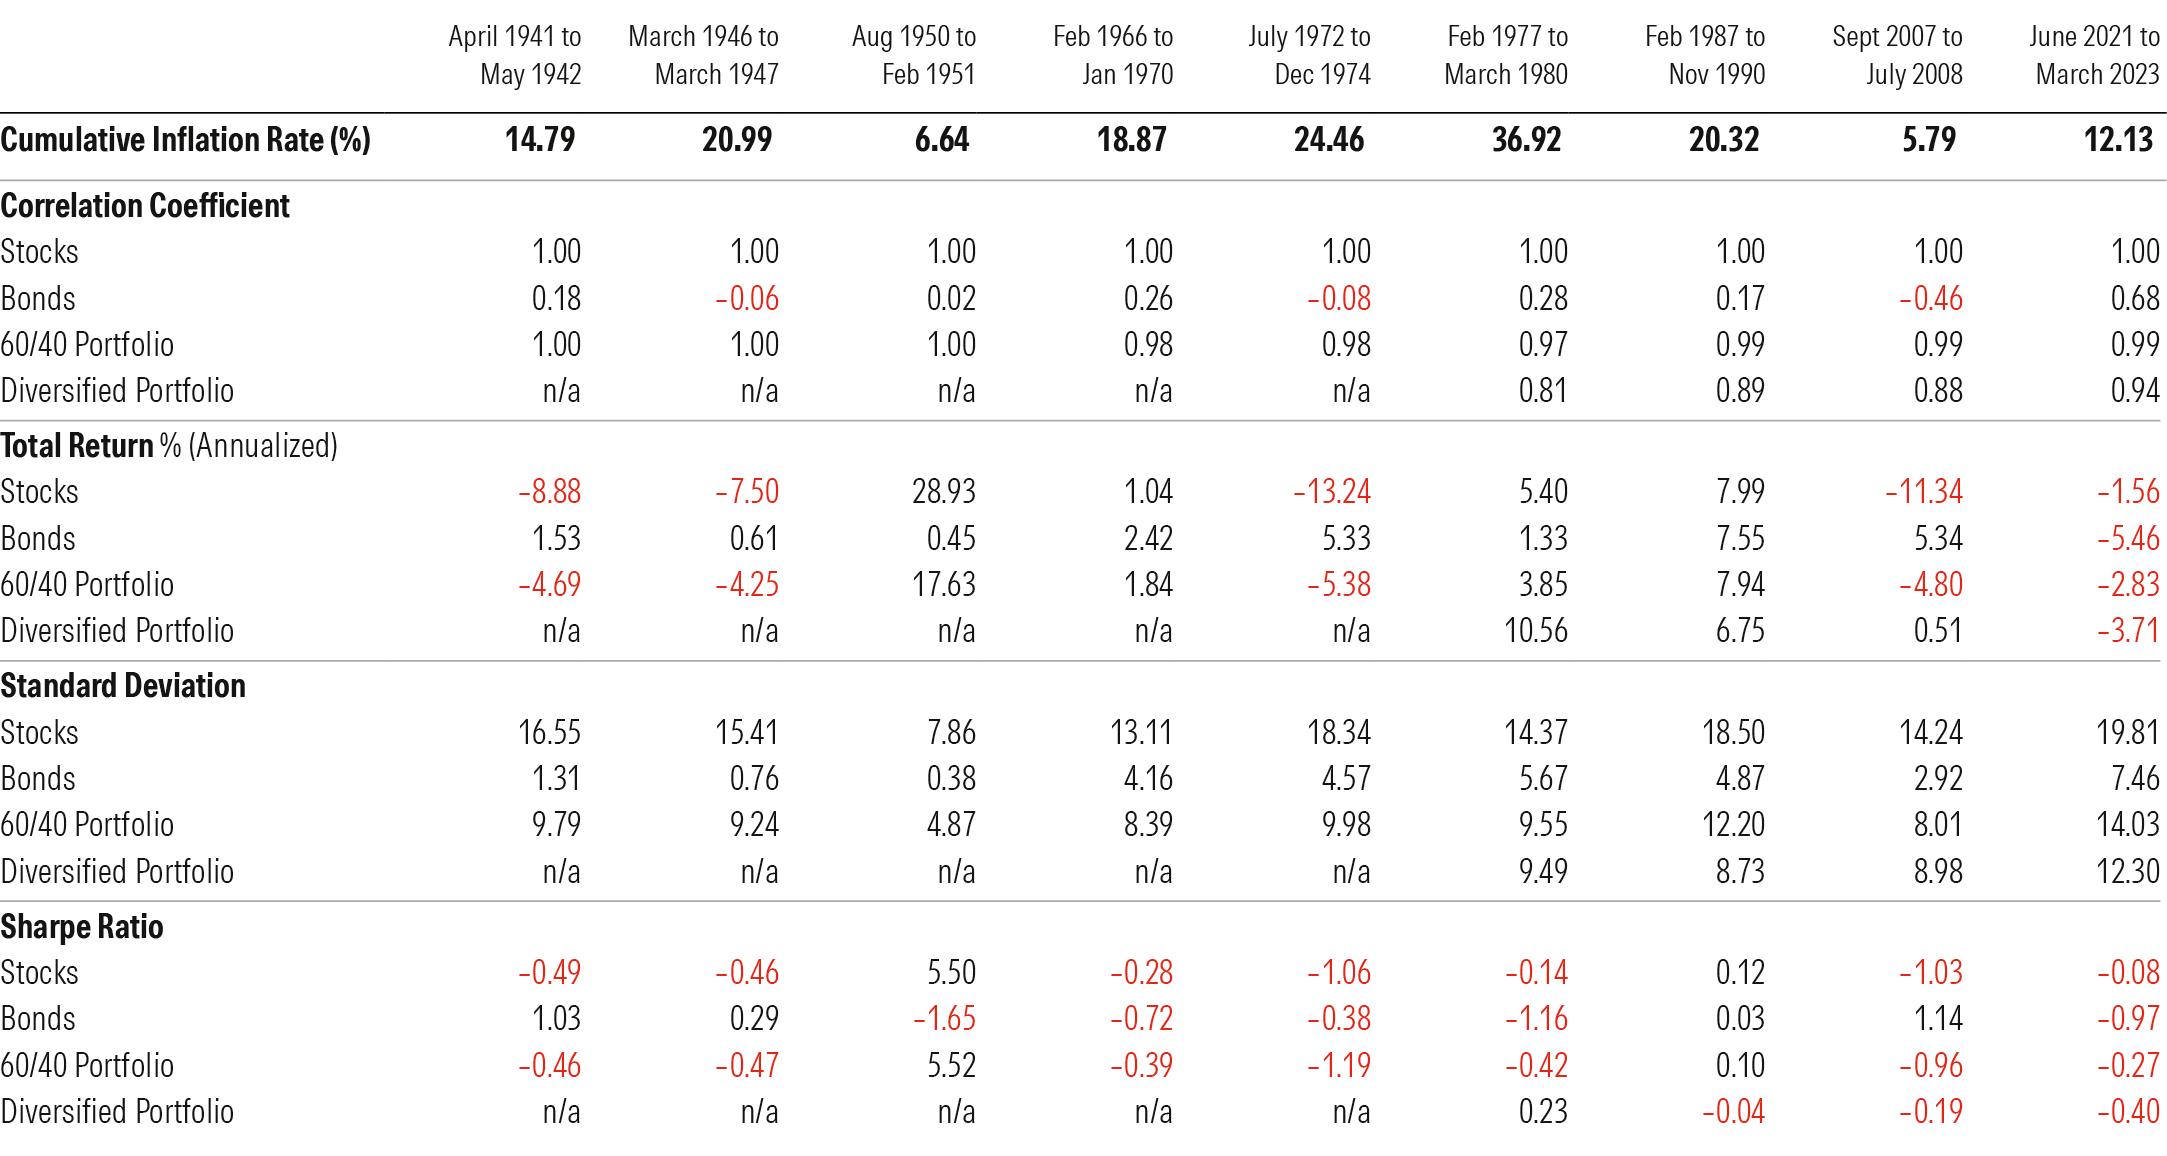
As shown in the exhibit above, correlations between stocks and bonds rose during some but not all inflationary periods. In general, correlations increased the most during periods when inflation was both high (in the double digits) and protracted (lasting at least three years). The post-World War II era saw an unusually high spike in inflation (driven by the removal of wartime wage and price controls, combined with large numbers of troops coming home), but the increase in consumer prices lasted only about a year. More recently, surging economic growth in China fueled rising consumer prices in 2007 and 2008, but inflation remained below 6% and lasted less than a year.
The most dramatic correlation upturns took place in the periods from February 1966 through January 1970 (driven by low unemployment and surging economic growth) and February 1977 through March 1980 (driven by soaring oil prices, the oil embargo and related price shocks, and expansionary monetary policies). Correlations ended up in a similar range (0.26 and 0.28, respectively) in both periods. Thanks to the rapidly shifting landscape for both interest rates and inflation, the recent upturn in stock/bond correlations has been even more pronounced.
Smart Moves for Bond Investors and Tackling Too Many Investments
Performance Trends Across Asset Classes
In addition to correlation patterns, the study also delves into performance trends across asset classes. Higher inflation makes for a more challenging environment for stocks, as it leads to higher operating costs in the form of raw materials, components, wages, and other expenses. On average, US large-cap stocks have posted nominal returns of about 3% per year across the inflationary periods we examined, well below the average inflation rate in the same periods. Stocks tend to fare even worse when inflation is extremely high and/or unexpected, such as the period from July 1972 through December 1974. As cumulative inflation topped 24% over that period, large-cap stocks lost more than 13% per year, and small-cap stocks lost more than 22%.
Higher inflation can also make conditions challenging on the fixed-income side, but the impact is usually less direct. A surge in inflation often prompts the Federal Reserve to hike interest rates, reducing bond prices and leading to tighter comovement between stocks and bonds. As a result, core bonds have posted nominal returns of about 2.2% per year over the inflationary periods highlighted in the exhibit below, and long-term Treasuries have fared a bit worse. Both areas suffered their worst showings during the most recent inflationary period from June 2021 through March 2023. Not only did interest rates have nowhere to go but up, but bonds also had less of a yield cushion to offset losses as rates increased.
Asset-Class Returns (%) During Inflationary Periods
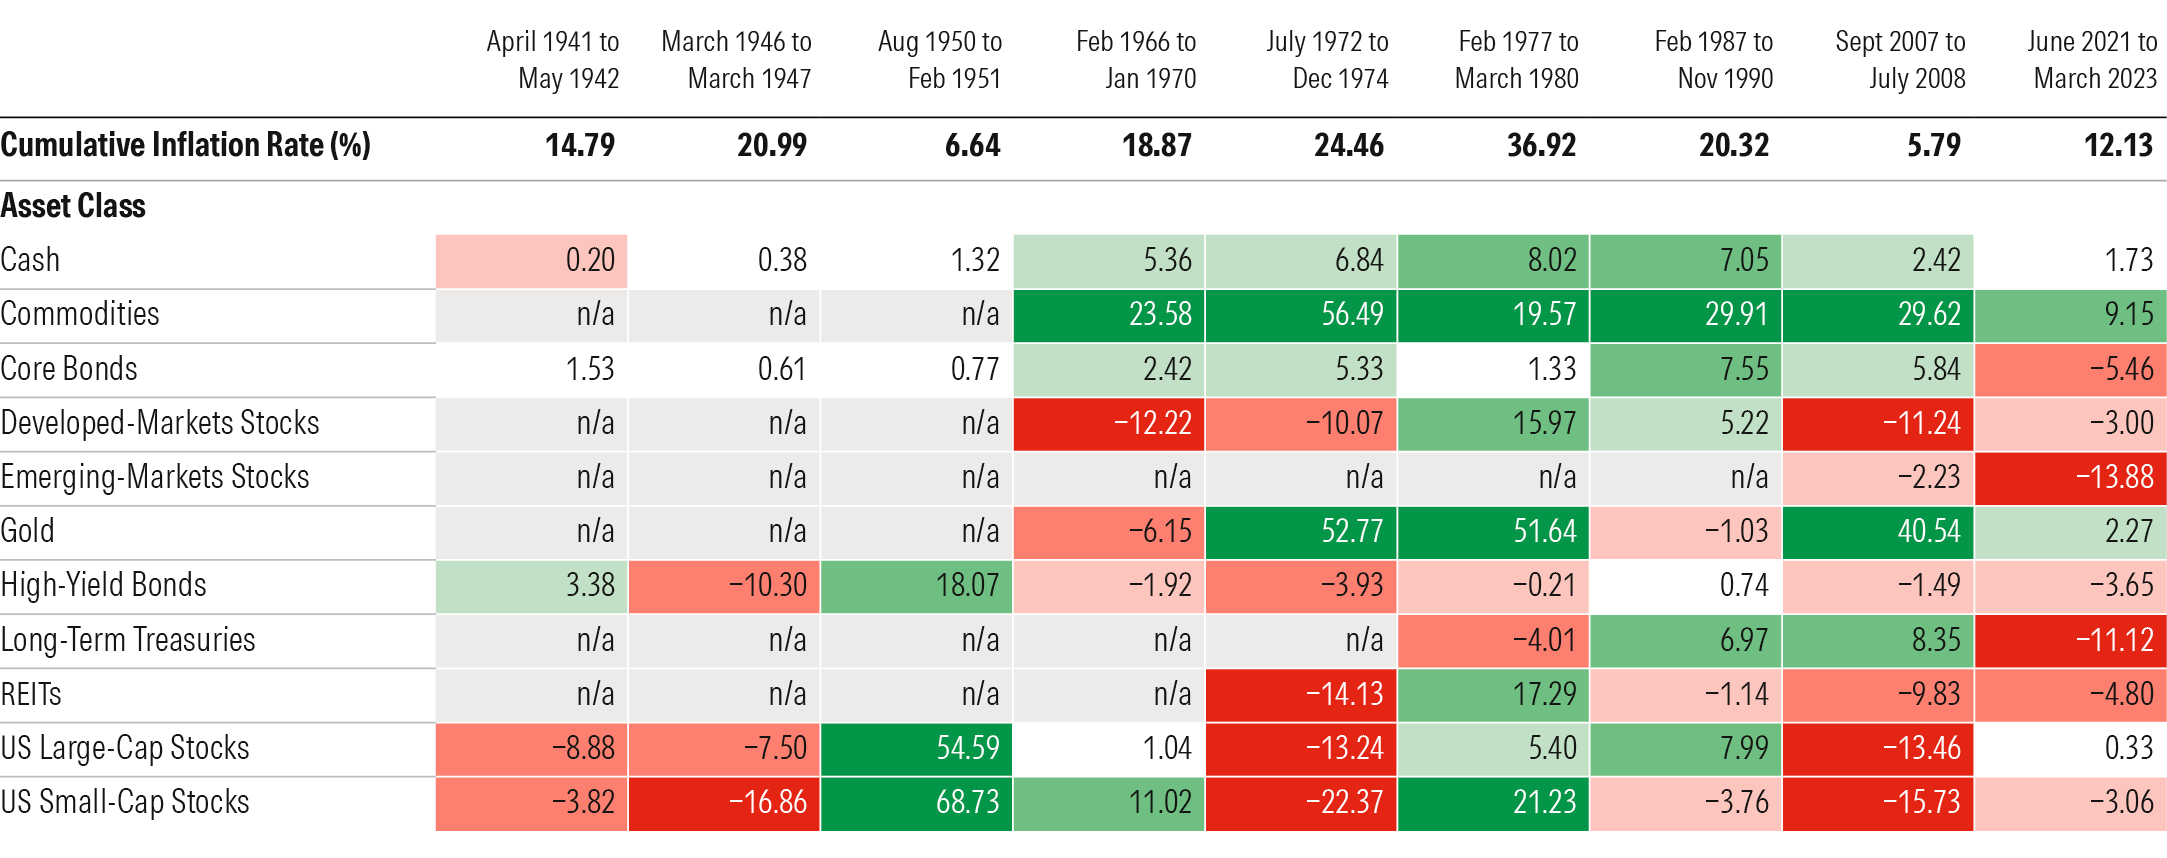
Across other asset classes, both developed- and emerging-market stocks have typically fared the worst during periods of high inflation, partly because it often results in interest rate hikes that strengthen the US dollar. A stronger dollar, in turn, means lower returns on non-US assets when translated back into dollars, as well as a heavier burden for emerging markets with dollar-denominated debt. REITs have also performed poorly in most inflationary periods, despite their often-touted ability to hike up rents as inflation increases.
On the positive side, both gold and other commodities have often excelled during periods of high inflation. However, gold prices stagnated in the late 1980s partly because higher bond yields increased the opportunity cost of holding non-income-producing assets. Other commodities have been a more reliable inflation hedge partly because products such as oil and natural gas account for a significant percentage of consumer spending, so it makes sense that their prices tend to rise when inflation is increasing. More broadly, demand for commodities tends to increase during periods of robust economic growth, which can also push inflation higher.
What This Means for Your Portfolio
There are a couple of key lessons to draw from these patterns. Stocks and bonds tend to move more in tandem during inflationary periods, but bonds can still provide significant diversification benefits and play a critical role in providing ballast and reducing risk. Treasury Inflation-Protected Securities in particular can be a valuable tool for hedging inflation risk, especially when they offer positive real yields. As of this writing in October 2026, real yields on TIPS were at their highest levels since 2008.
The author or authors do not own shares in any securities mentioned in this article. Find out about Morningstar’s editorial policies.

 United States