
What Can Commodities Do for You?
Commodity profiles continue to evolve, as do their diversification benefits.
/s3.amazonaws.com/arc-authors/morningstar/502d0355-28ed-483c-ae9d-b67bfbf5291b.jpg)
Owning diversifying assets can be hard over short periods, as 2023 showed for most commodities, but their long-term benefits in portfolios remain intact. In our recently published 2024 Diversification Landscape report, Amy Arnott, Christine Benz, and I took a deep dive into how different asset classes performed in the past couple of years, how correlations have evolved, and what those changes mean for investors and financial advisors trying to build well-diversified portfolios. You can also check out Amy’s Portfolio Basics series, where she goes over some fundamentals of assembling sound portfolios—including an installment on how to use gold in your portfolio.
Commodities are traditionally defined as raw materials or other basic ingredients used in manufacturing and industrial processes. As basic materials, they are essentially interchangeable with other commodities of the same type. And because their prices mostly depend on the balance of supply and demand, they often show very low correlations with other classes. They can also be a useful hedge against inflation. Commodities themselves are a major part of most inflation indexes, so it makes sense that their prices tend to rise when inflation is increasing. Some commodities also show seasonal price movement, which can affect returns over shorter periods.
Recent Performance Trends in Commodities
Rising inflation concerns buoyed the performance of many commodities in 2021, while war, spiking interest rates, reinstated lockdowns, and fears of an impending recession complicated matters in 2022. The next year was even more difficult for commodities, which were heavily influenced by geopolitical events, central bank activity, and supply-and-demand dynamics. Other factors, like the fluctuating value of the US dollar, also played a more prominent role in 2023. The Bloomberg Commodity Index lost almost 8% in 2023, while the Morningstar US Market Index gained 26%.
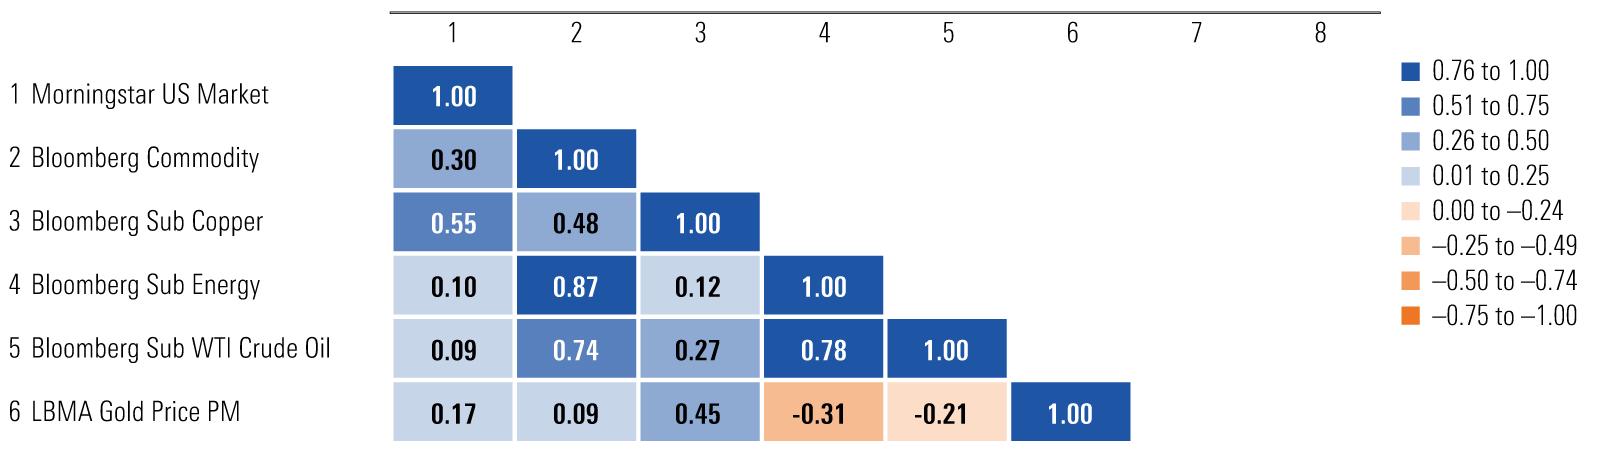
Three-Year Correlation Matrix: Commodities
The Bloomberg WTI Crude Oil Subindex and Bloomberg Energy Subindex lost roughly 2% and 22%, respectively, in 2023—a far cry from the incredible performance both commodities delivered the previous two calendar years. In 2023, the price of West Texas Intermediate crude oil experienced a $5 net loss. The year’s starting price was roughly $77 per barrel, which rocked up and down in the first half of the year, primarily rose in the third quarter to a peak just shy of $94 in late September, then bumped down to $72 per barrel at the end of 2023. Geopolitical conflicts (like the ongoing war between Russia and Ukraine and the Israel-Hamas war) in addition to high production rates in the US and Brazil pushed prices lower. Energy had a particularly challenging year in light of similar factors, which were compounded by the exceptionally high rates of natural gas production in the face of a mild winter.
The same or similar factors are at play in the metals world, but the resulting story differs. While most industrial metals had a challenging 2023, the Bloomberg Copper Subindex returned almost 5% after losing nearly 14% in 2022. Near- and future-term appetite remained high owing to the shift to electric energy sources, but various factors like recession fears across the globe and reinstated lockdowns in China (a substantial buyer of global copper output) in 2022 hindered consumers’ ability to utilize the resource. Production ramped up in 2023, allowing consumers to act on that interest in copper, which is a key element for electrical circuits used in infrastructure and electric vehicles. Late in the year, copper prices climbed even higher as prominent mining companies projected lower-than-anticipated output and because of the closure of a large mine in Panama.
The LBMA Gold Price PM Index delivered 14.6% in 2023 after 2022′s 0.44% return. A confluence of factors contributed to the exceptional year, as gold prices climbed to record highs in 2023. Demand from central banks increased as some governments opted to diversify away from the US dollar, in some cases prompted by geopolitical turmoil, such as the war between Russia and Ukraine, heightened tension related to China and Taiwan, and the Israel-Hamas war. The regional banking crisis early in the year catalyzed prices to rise even higher. All these factors also contributed to an interesting turn in the story between gold and long-term Treasuries: Typically, the price of gold decreases as yields on long-term Treasuries increase. Then, hints that the Federal Bank was likely done increasing interest rates contributed to more demand for the precious metal, as did the threat of the US government potentially defaulting on its debt midyear. Late in the year, the anticipation of impending rate cuts and a weakening US dollar drove gold prices even higher.
Longer-Term Trends in Commodities
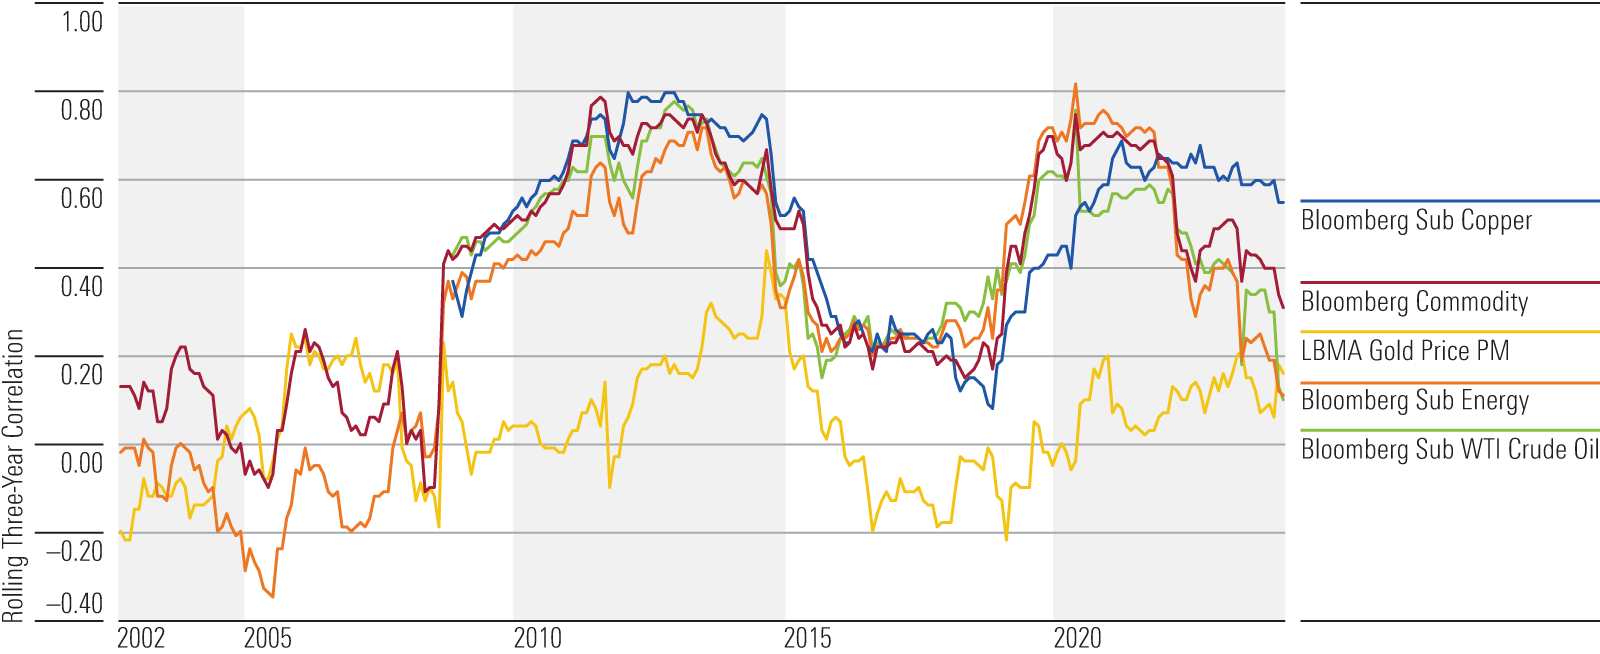
The Bloomberg Commodity Index’s trailing three-year correlation versus the Morningstar US Market Index was 0.30 as of December 2023, which was lower than it was in 2022. During 2021, the index’s rolling three-year correlation was markedly higher, starting at 0.70 in January and then coming down to 0.64 by year-end, mainly reflecting the impact of the 2020 pandemic panic when commodities correlations spiked. As inflation picked up in 2021 and soared in 2022 and persisted in 2023, correlations began to fall to more historically typical levels.
The trailing three-year correlations for energy and oil were also sitting lower in 2023 than in 2022: Those figures dropped to 0.10 and 0.09 from 0.42 and 0.40 for energy and oil, respectively. For both indexes, the rolling three-year correlations hovered well above their historic averages in 2021, whereas the 2022 and 2023 numbers were lower. Copper’s average three-year rolling correlation over the past decade was 0.45. In 2023, copper’s correlation to broader equity markets remained elevated, clocking in at 0.55 at year-end.
Although the trailing three-year correlation for gold was 0.17 in 2023, which was more than 3 times the average over the past decade (roughly 0.05), gold remains the most weakly correlated of the five commodities indexes studied here. In fact, gold had the lowest correlation of any major asset class—excluding cash and 10-plus year Treasuries—over the trailing periods depicted in the Appendix of the 2024 Diversification Landscape (see Exhibits A2 through A7).
Rolling Three-Year Correlations vs. Morningstar US Market Index: Commodities
Commodities have served as a strong hedge versus inflation, but the degree to which this may remain the case is uncertain. Several factors—such as complex market dynamics, ongoing pandemic disruptions, political and regulatory factors (negative sentiment toward mining is on the rise, for example), and environmental concerns (mining sites are increasingly more difficult to access)—have undermined return expectations. It seems likely that such complicating factors will persist. Commodities continue to exhibit negative correlations versus market volatility (as measured by the CBOE VIX Index).
Portfolio Implications of Commodities
Given their low correlations with most other asset classes, commodities often stand out as portfolio diversifiers, particularly during bouts of extreme market stress. While long-term returns relative to other broad asset classes haven’t been that compelling, commodities can excel during certain market environments. Notably, gold should continue to fill a valuable role as a buffer against equity market volatility. It is also worth noting that the way investors gain access to commodities (for example, via mutual funds, exchange-traded funds, or futures contracts; and the kind of commodity/commodities held) plays a major role in the potential outcomes. Roll yield and implementation decisions can all have a significant impact on results.
The author or authors do not own shares in any securities mentioned in this article. Find out about Morningstar’s editorial policies.
/cloudfront-us-east-1.images.arcpublishing.com/morningstar/6ZMXY4RCRNEADPDWYQVTTWALWM.jpg)
/cloudfront-us-east-1.images.arcpublishing.com/morningstar/URSWZ2VN4JCXXALUUYEFYMOBIE.png)
/cloudfront-us-east-1.images.arcpublishing.com/morningstar/CGEMAKSOGVCKBCSH32YM7X5FWI.png)
:quality(80)/s3.amazonaws.com/arc-authors/morningstar/502d0355-28ed-483c-ae9d-b67bfbf5291b.jpg)