
Is Even a Little Bitcoin Too Much for Your Portfolio?
Spot bitcoin ETFs make it easy to add the cryptocurrency to a 60/40 portfolio, but there’s a chance it can turn your portfolio upside down.
/s3.amazonaws.com/arc-authors/morningstar/e29c5118-c52b-4431-99f9-23960f2bcb09.jpg)

Bitcoin has delivered incredible highs and crushing lows over its history. And with the cryptocurrency more widely accessible than ever, some investors may be eager to try and capture the potential for high-flying returns. However, those looking to add exposure could send tremors through their portfolios. A little bit can go a long way.
After much anticipation, the SEC approved 11 spot bitcoin ETFs in early January 2024. Investors can now easily buy and sell the popular cryptocurrency in the same brokerage accounts that they buy stock and bond exchange-traded funds and mutual funds (unless Vanguard is your brokerage). Since the bitcoin ETFs started trading on Jan. 11, investors have poured in more than $1 billion in less than a week. Total assets in the new ETFs, including Grayscale Bitcoin Trust GBTC, which converted from a collective investment trust, were just shy of $30 billion.
Before rushing to add bitcoin, however, you should consider how even a seemingly small amount can have a big impact on the volatility of your portfolio. In this article, we’ll look at how different amounts of bitcoin would affect a traditional 60/40 portfolio’s volatility and returns.
Bitcoin’s History of Booms and Busts
It’s tempting to consider adding bitcoin. It has enjoyed some exceptional returns, including 150% in 2023, 300% in 2020, and a jaw-dropping 1,300% in 2017. But this rocket ship doesn’t only go up, and the crashes can be painful. In 2022 and 2018, for example, bitcoin declined 64% and 74%, respectively.
Exhibit 1 depicts massive differences in how bitcoin and a 60/40 portfolio perform. It shows the rolling one-year standard deviation—a measure of volatility—using the daily returns of the S&P Bitcoin Index (launched in May 2021 with performance dating to January 2014) and a basic 60/40 stock/bond portfolio composed of the Morningstar Global Markets and Morningstar US Core Bond indexes (two broadly diversified indexes representing the global stock and U.S. bond markets), rebalanced monthly.
Rolling One-Year Volatility
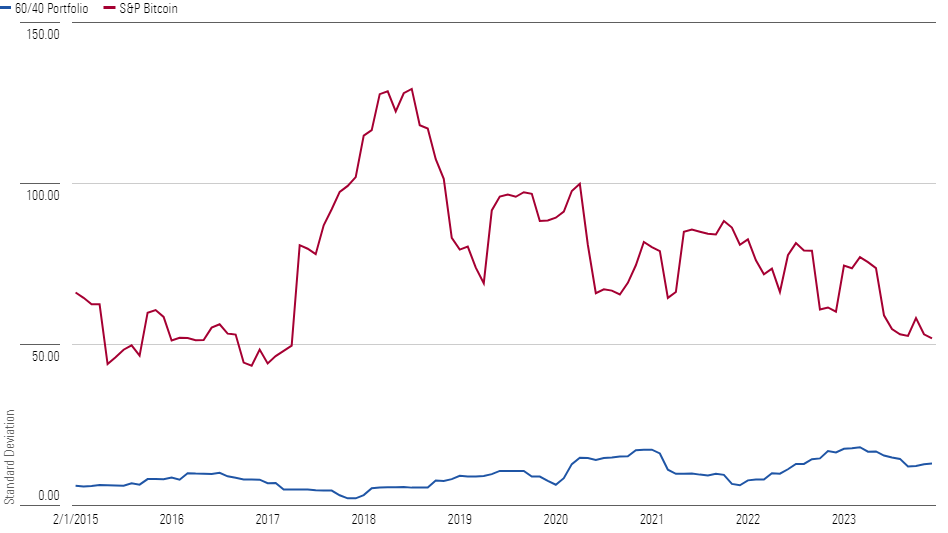
The cryptocurrency has on average been 10 times more volatile since 2014 and 6.3 times more volatile over the trailing one-year period.
Where Does Your Portfolio’s Risk Come From?
The sources of risk for a 60/40 portfolio can be deceiving. It’s easy to assume that 60% of the portfolio’s risk comes from equities and 40% from bonds. However, it is more like 85% of the portfolio’s risk comes from equities because they are more volatile than bonds. In light of this, adding bitcoin, which is much more volatile, can dramatically shift a portfolio’s risk profile.
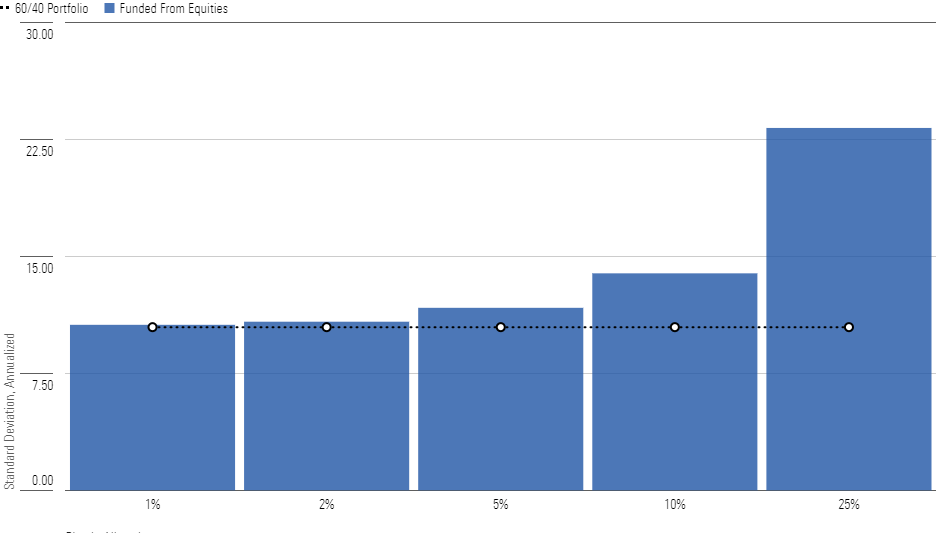
Exhibit 2 depicts bitcoin’s risk contribution to the 60/40 portfolio when holding bitcoin, as approximated by the S&P Bitcoin Index, at various weights (1%, 2%, 5%, 10%, and 25%) and when sourcing the allocation from the stock sleeve (funding something as volatile as cryptocurrency from bonds is not a good idea). Exhibit 3 shows how each hypothetical portfolio’s standard deviation changed over the period given the varying allocations to bitcoin.
Bitcoin - Contribution to Risk (%)
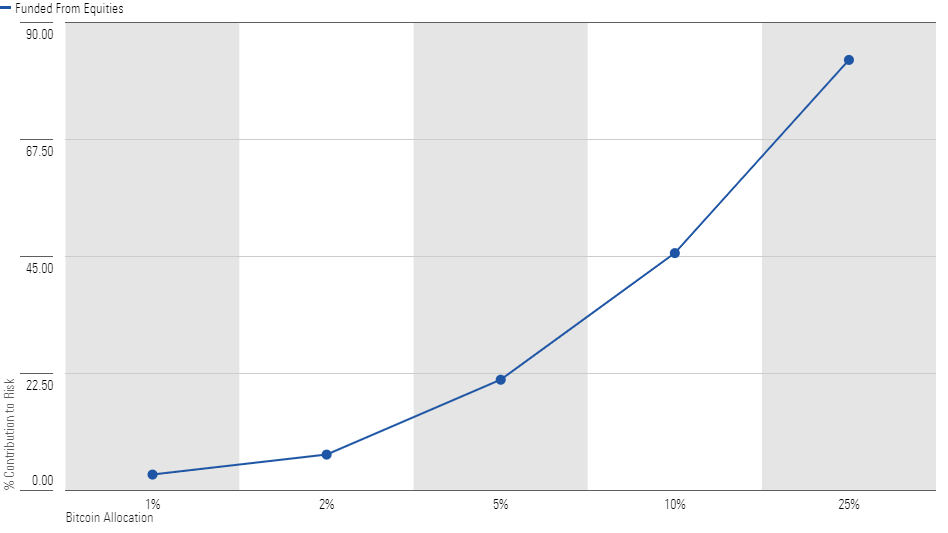
A small dose of 1% or 2% bitcoin doesn’t have a big impact on your portfolio. At these levels, bitcoin contributes roughly 3% and 7% of total risk, respectively, and results in a minimal change to overall volatility, as shown in Exhibit 3.
Bitcoin's Impact on Standard Deviation
5% Is the Tipping Point
While a little bitcoin can go a long way, it is at greater exposures where investors will see the largest shifts in the total risk toward bitcoin. At 5%, the bitcoin allocation contributes over 20% of the portfolio’s total risk and produces a volatility that’s roughly 16% over the 60/40 portfolio. A 10% allocation increases volatility by 41%.
With a 25% allocation, the contribution to risk leaps to 83% when sourced from equities. The overall volatility is more than double that of the 60/40 portfolio. This should serve as a warning to investors that even a small amount could disproportionately increase the volatility of the portfolio, therefore changing the risk composition.
On Paper, Portfolios With Exposure to Bitcoin Have Outpaced the 60/40
Bitcoin is no stranger to drawdowns over 50%. While it can be easy to get skittish in the face of gargantuan losses, holding on and even buying the dip have generally worked well for investors who could handle it. Morningstar research has shown that investors typically have more trouble holding on to volatile portfolios, though.
Exhibit 4 shows the returns of portfolios with 1% to 25% exposures to bitcoin sourced from the 60/40 portfolio’s equity sleeve from February 2014 through December 2023. The higher the allocation to bitcoin, the higher the return of the portfolio. Despite bitcoin’s wild volatility, risk-adjusted returns measured by the Sharpe and Sortino ratios were higher for the bitcoin portfolios than the baseline 60/40. But this assumes holding bitcoin during its many drawdowns, which requires nerves of steel. The portfolio with a 25% allocation to bitcoin experienced a max drawdown for the period of 36%, about 12 percentage points more than the 60/40 portfolio’s max drawdown.
Bitcoin Portfolio Returns and Risk (Feb. 1, 2014 to Dec. 31, 2023)
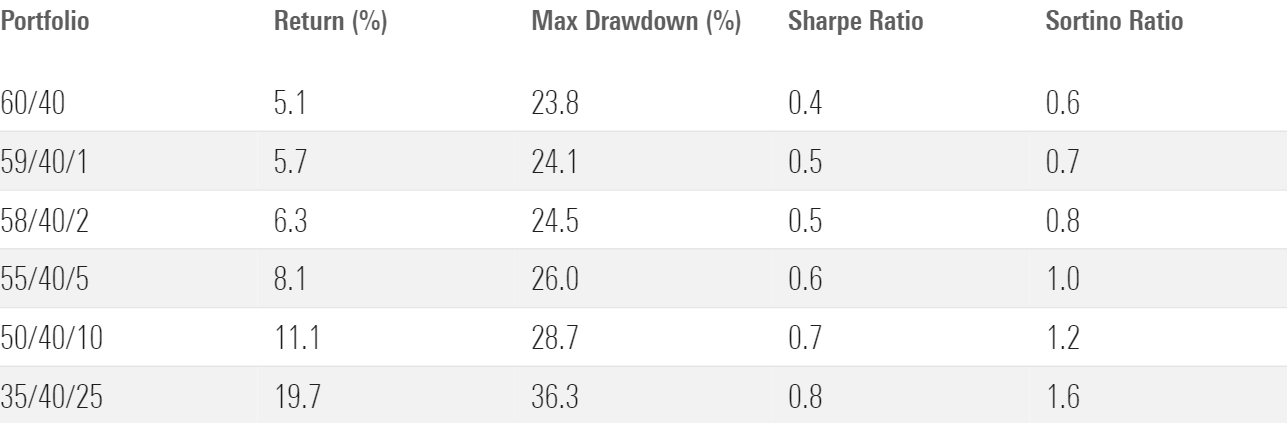
Exhibit 5 shows the returns of 60/40 portfolios with a 5% allocation to bitcoin funded from stocks compared with the baseline 60/40 during the S&P Bitcoin Index’s five largest drawdowns over its nearly 10-year performance record. The index’s drawdowns ranged from negative 31% to negative 83%. Over these five stress periods, the straightforward 60/40 portfolio held up better than the portfolio with a bitcoin allocation by 4.4% on average.
Returns During the S&P Bitcoin Index's 5 Largest Drawdowns
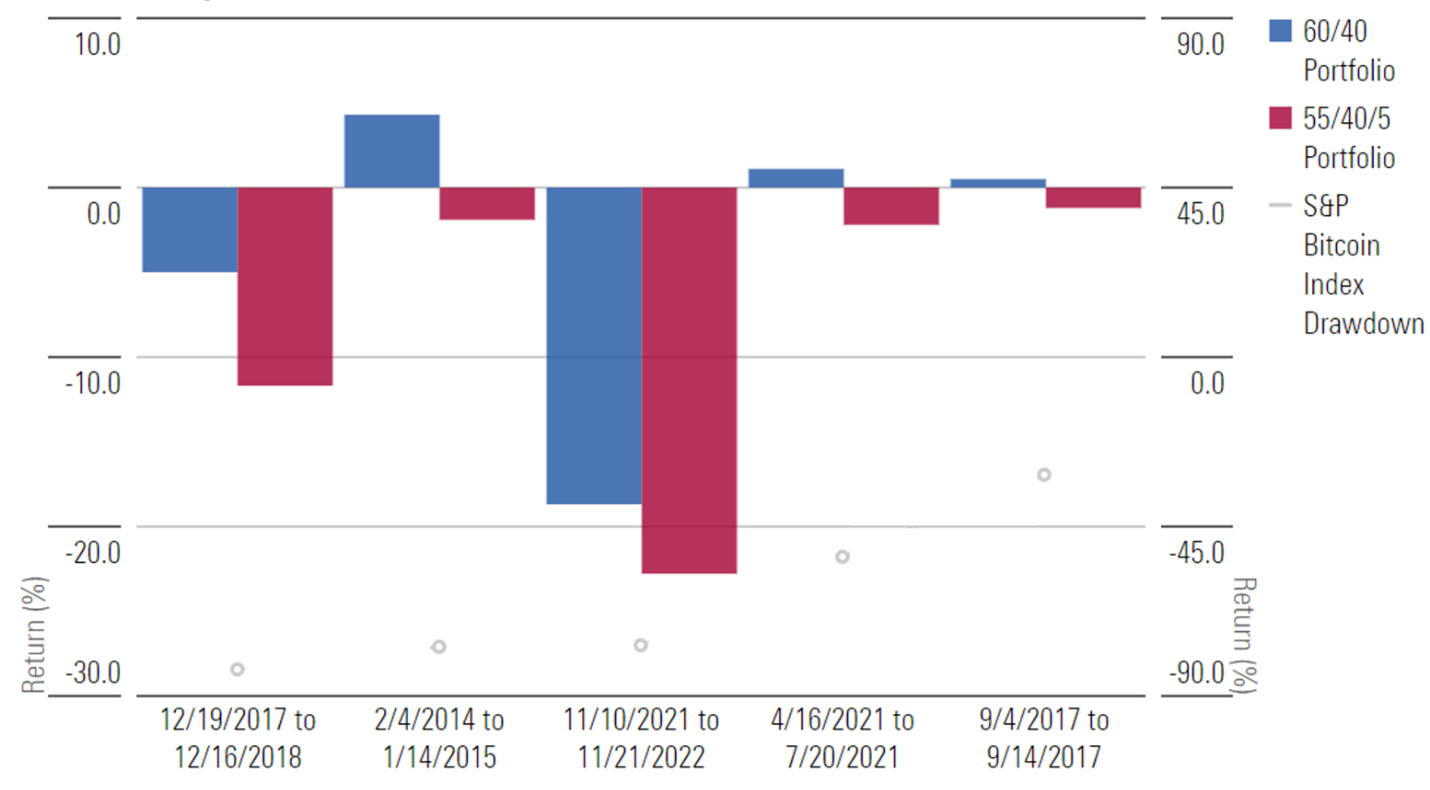
The most recent bitcoin stress period, dubbed by many as the “crypto winter,” lasted from November 2021 through Nov. 21, 2022. While the bitcoin index declined by 77% during that period, the 60/40 portfolio declined 18.7% and the portfolio with a 5% bitcoin allocation was down 4 percentage points more than that. The fall of crypto, and the 60/40, was spurred on by the Federal Reserve’s aggressive rate hikes to stem inflation. Bitcoin’s failure to add diversification when both stocks and bonds were declining by double digits shows that it can’t be counted on as a panacea when the broader economy is going through tough times.
Stocks, Bonds, and Bitcoin
It was once thought that bitcoin could offer returns that were uncorrelated to both stocks and bonds. Bitcoin’s correlation with broader equity and fixed income hovered around zero from its 2009 inception through much of the 2010s, meaning the impact of funding from stocks or bonds was negligible. But things have been different recently, particularly on the equity side. Exhibit 6 shows the rolling one-year correlations of the Morningstar Global Markets and Morningstar US Large-Mid Cap Broad Growth indexes to bitcoin using monthly returns.
Rolling One-Year Correlations to the S&P Bitcoin Index
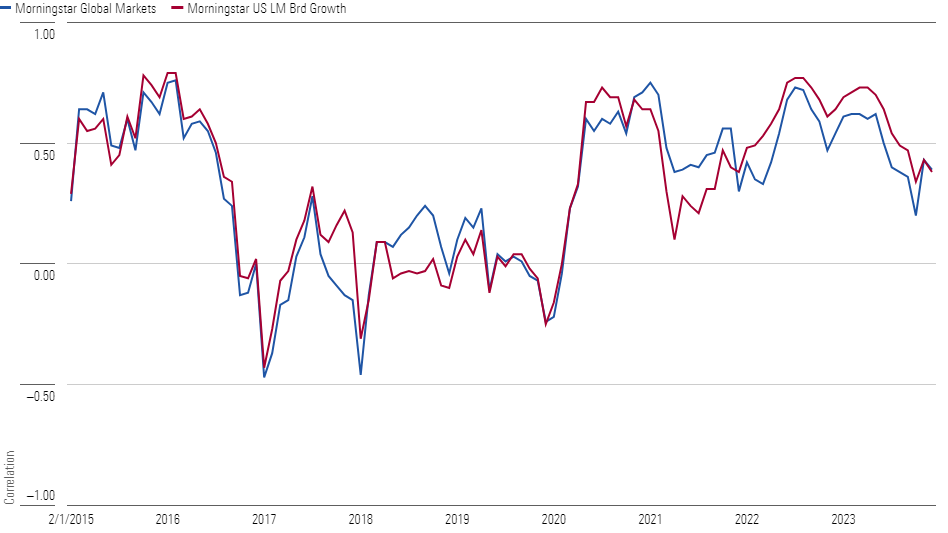
Over the past few years, bitcoin’s one-year rolling correlation to broader equity markets has risen, hovering between 0.20 and 0.75 from April 2020 through December 2023. That is a wide range, and there is always a chance that bitcoin’s correlation will settle back in around zero, but it’s still significant that correlations to equity have been elevated for nearly four years. It makes sense that a risk asset like bitcoin would have a higher correlation to another risk asset like equities.
Given bitcoin’s extreme volatility, instead of sourcing that allocation from broad equities, an investor could pull from the riskiest areas of the equity sleeve like innovative growth companies. One might assume that the cryptocurrency has a higher correlation to riskier stocks. However, bitcoin’s correlation to the broad growth index from April 2020 through December 2023 was similar to its correlation to the broad global index, ranging from 0.10 to 0.77, so this avenue likely wouldn’t result in a different outcome.
Altogether, bitcoin’s volatility can have an outsize impact on a standard 60/40 portfolio. With bitcoin’s newfound accessibility through ETFs, many investors will look at its sizable returns and be keen to add it to their portfolios. But before doing this, they should consider the cryptocurrency’s significant volatility and how even a little bit can dramatically change a portfolio’s risk profile.
The author or authors do not own shares in any securities mentioned in this article. Find out about Morningstar’s editorial policies.
/cloudfront-us-east-1.images.arcpublishing.com/morningstar/MNPB4CP64NCNLA3MTELE3ISLRY.jpg)
/cloudfront-us-east-1.images.arcpublishing.com/morningstar/SIEYCNPDTNDRTJFNF6DJZ32HOI.png)
/cloudfront-us-east-1.images.arcpublishing.com/morningstar/ZHTKX3QAYCHPXKWRA6SEOUGCK4.png)
:quality(80)/s3.amazonaws.com/arc-authors/morningstar/e29c5118-c52b-4431-99f9-23960f2bcb09.jpg)