
Bad Timing Cost Investors One Fifth of Their Funds’ Returns
Our study finds investors enjoyed greater success by favoring simpler solutions.
/s3.amazonaws.com/arc-authors/morningstar/550ce300-3ec1-4055-a24a-ba3a0b7abbdf.png)

We just published an update of our annual “Mind the Gap” study. The study estimates the return of the average dollar invested in funds and exchange-traded funds (that is, “Investor Return”) and compares it with the average fund’s total return, with any difference attributable to the timing of investors’ purchases and sales. The smaller the gap, the more investors captured their funds’ total returns and vice versa.
In this year’s study, we found the average dollar invested in funds earned a 6% annual return over the 10 years ended Dec. 31, 2022, while the average fund gained about 7.7% per year over that same span, for a gap of about 1.7% annually. What this means is that investors missed out on about one fifth of their fund investments’ average net returns, a significant shortfall.
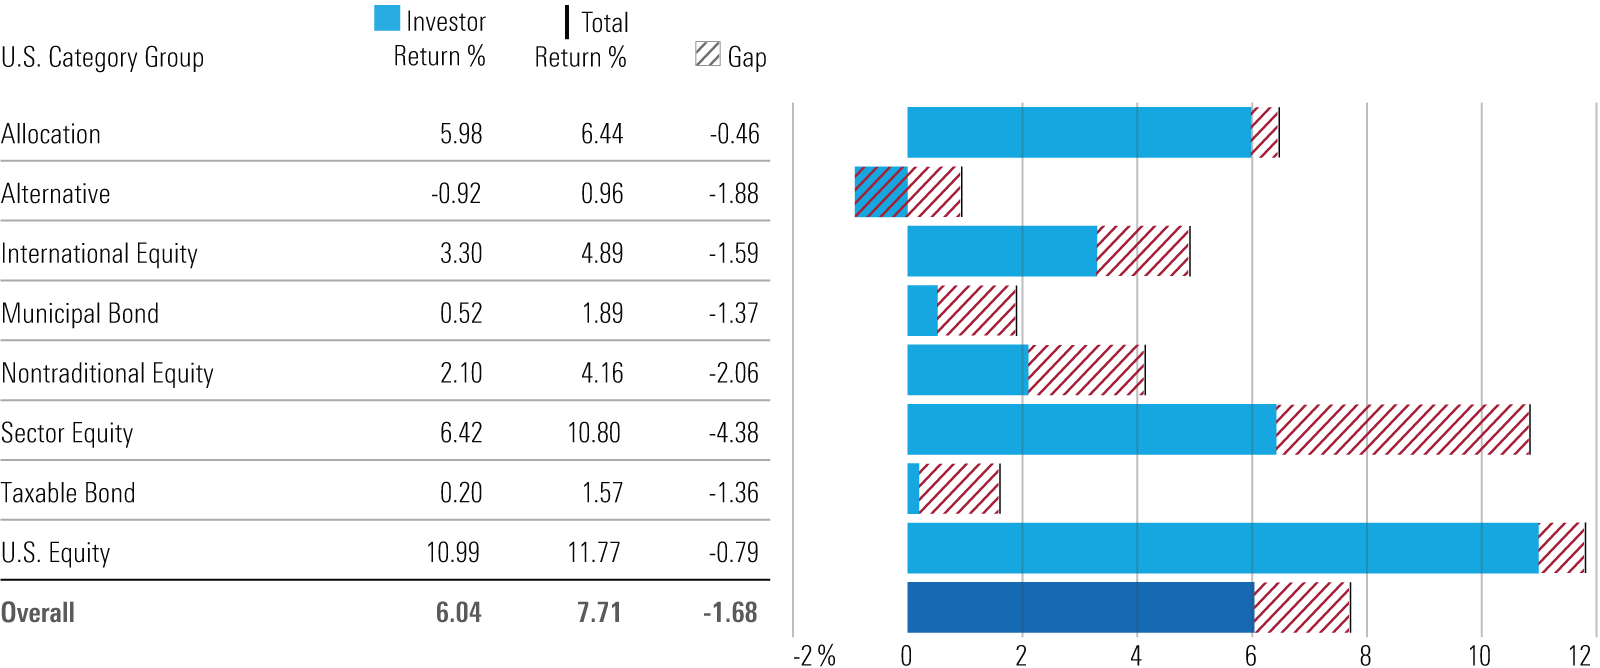
The Gap by U.S. Category Group (10-year Annual Returns)
That gap is more or less in line with what we’ve found when estimating the dollar-weighted return gap for the 10-year periods ended December 2021 (-1.7% gap), 2020 (-1.7%), 2019 (-1.5%), and 2018 (-1.6%), suggesting that timing costs are a persistent drag on the returns investors earn.
Gaps by Asset Class
The gap varied when we grouped funds by certain dimensions like asset class. For example, as shown in the first chart, the average dollar invested in allocation funds gained 6% per year versus a 6.4% return for the average fund, the narrowest gap of any asset class. On the flip side, investors in narrower sector equity funds earned only 6.4% per year on their average dollar, which was 4.4% less per year than the average fund’s return, a large deficit reflecting mistimed flows.
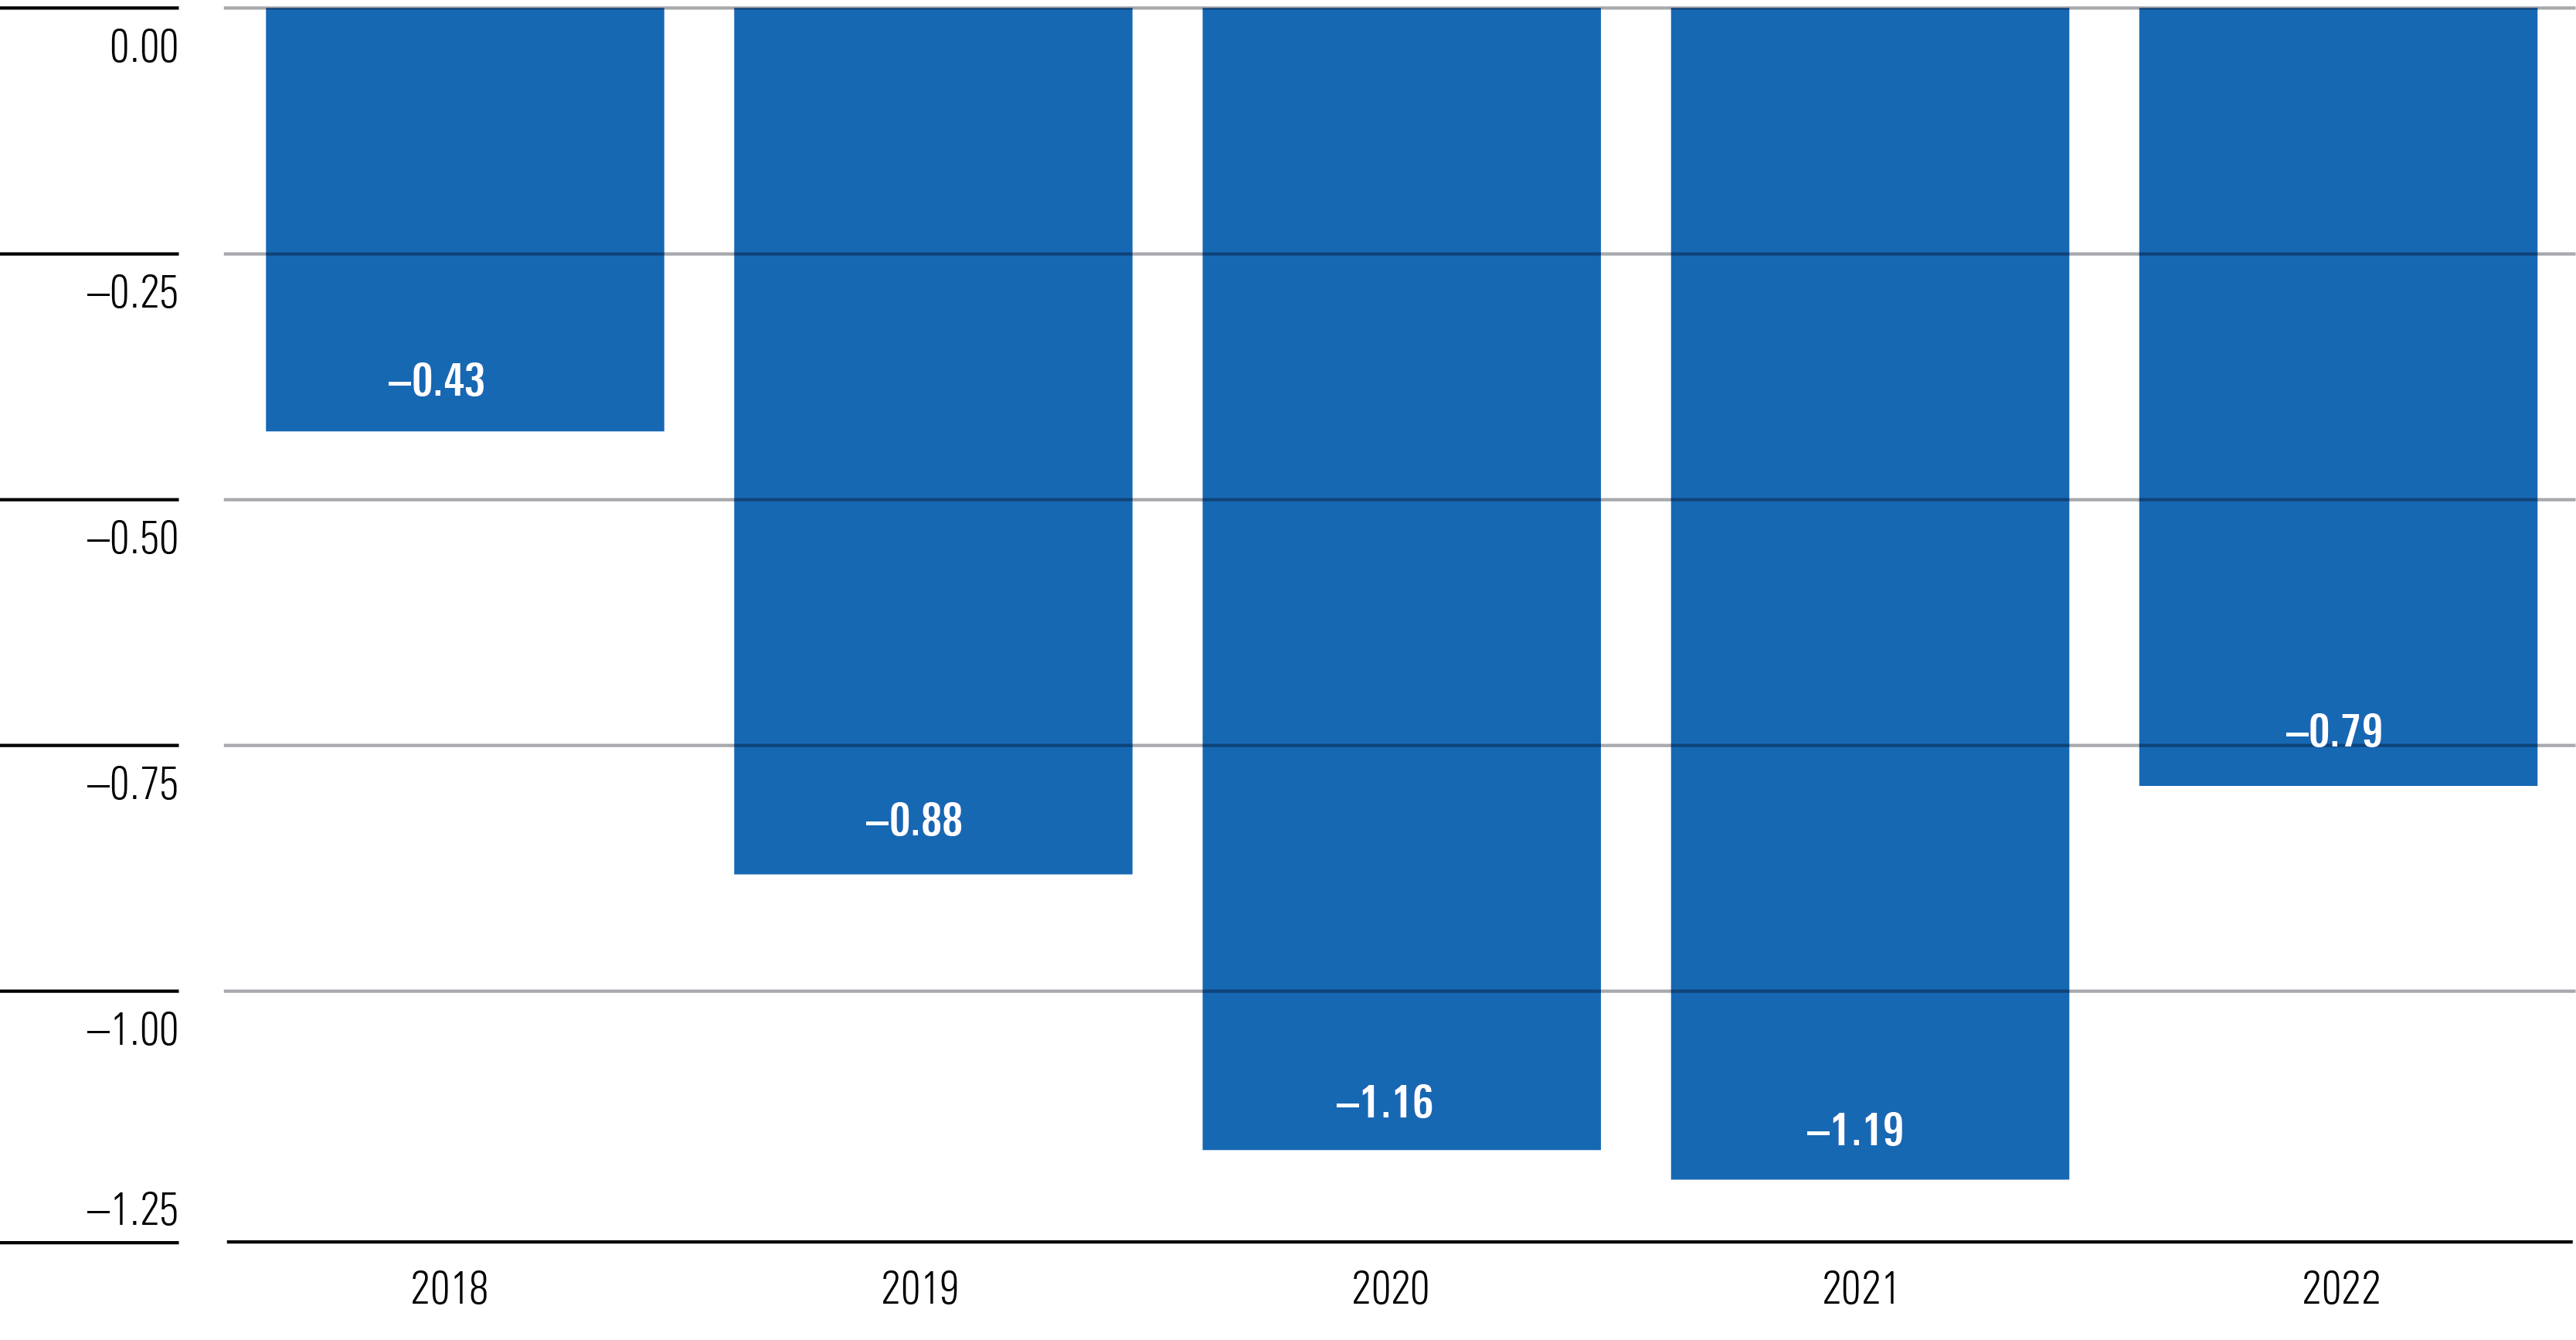
Encouragingly, the average dollar invested in U.S. stock funds earned 11% per year over the decade ended December 2022. That was only 0.8% less than the average fund’s return, which was narrower than the gap we estimated over the 10-year periods ended 2019 through 2021, as shown in the chart below. While it would be preferable to see U.S. stock fund investors capture even more of their average fund’s return, it appears that mistimed purchases and sales were less costly as a share of returns than in other asset classes.
U.S. Equity Funds: 10-Year Annual Return Gaps Over Time
That was quite apparent with alternative funds, where the average dollar lost almost 1% per year while the average fund rose about 1% per year. To be sure, the average alternative fund’s return was nothing to write home about, but it is still concerning that investors in these funds ended up frittering away even those modest gains and then some.
Gaps by Category
We also estimated the dollar-weighted returns of the 10 largest Morningstar Categories by net assets, as shown in the chart below.
10-year Annual Return Gaps for the Largest Morningstar Categories
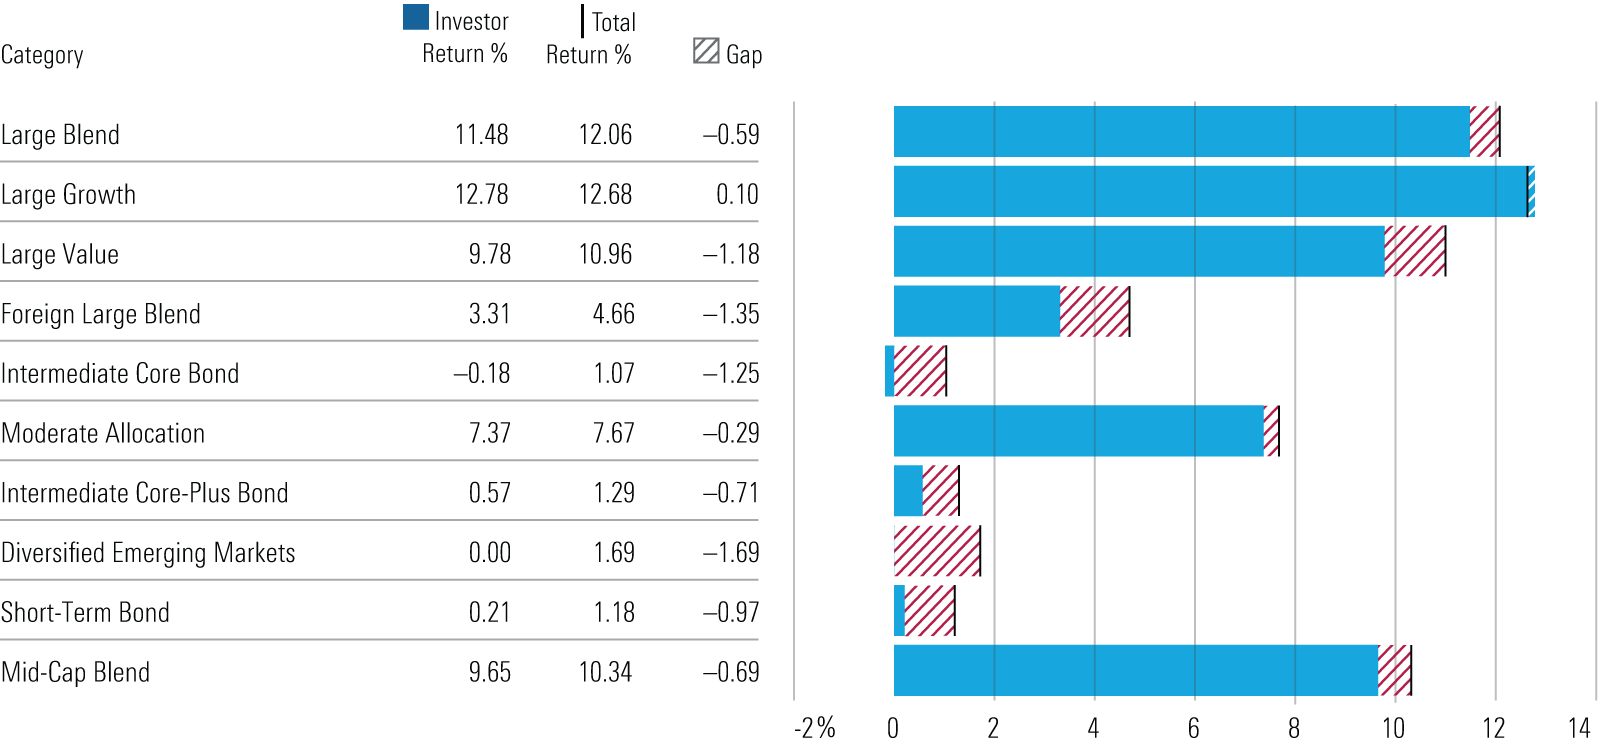
The average dollar invested in the most popular U.S. stock categories earned almost as much as the average fund, as evidenced by the relatively small gaps for large-blend, large-growth, and mid-blend. Similarly, the average dollar-weighted return of moderate-allocation funds nearly matched the average fund’s total return.
Investors struggled to a greater degree in timing their investments in foreign-stock funds, with larger gaps seen between the dollar-weighted and time-weighted returns of foreign large-blend and diversified emerging-markets funds. Indeed, the average dollar invested in emerging-markets funds earned nothing over the 10 years ended Dec. 31, 2022, a disappointing outcome. Investors also earned meager dollar-weighted returns in bond funds. In fact, the average dollar invested in intermediate core bond funds lost about 0.2% per year over that span.
Gaps by Volatility
One of the clearer takeaways from our Mind the Gap study is that investors are more likely to mistime their investments in highly volatile funds than they are in less-volatile funds. That relationship held over the 10 years ended Dec. 31, 2022, as shown in the table below, which groups funds by category group and standard-deviation quintile (the first quintile containing the least-volatile funds).
Less Volatility Translated to Smaller Gaps
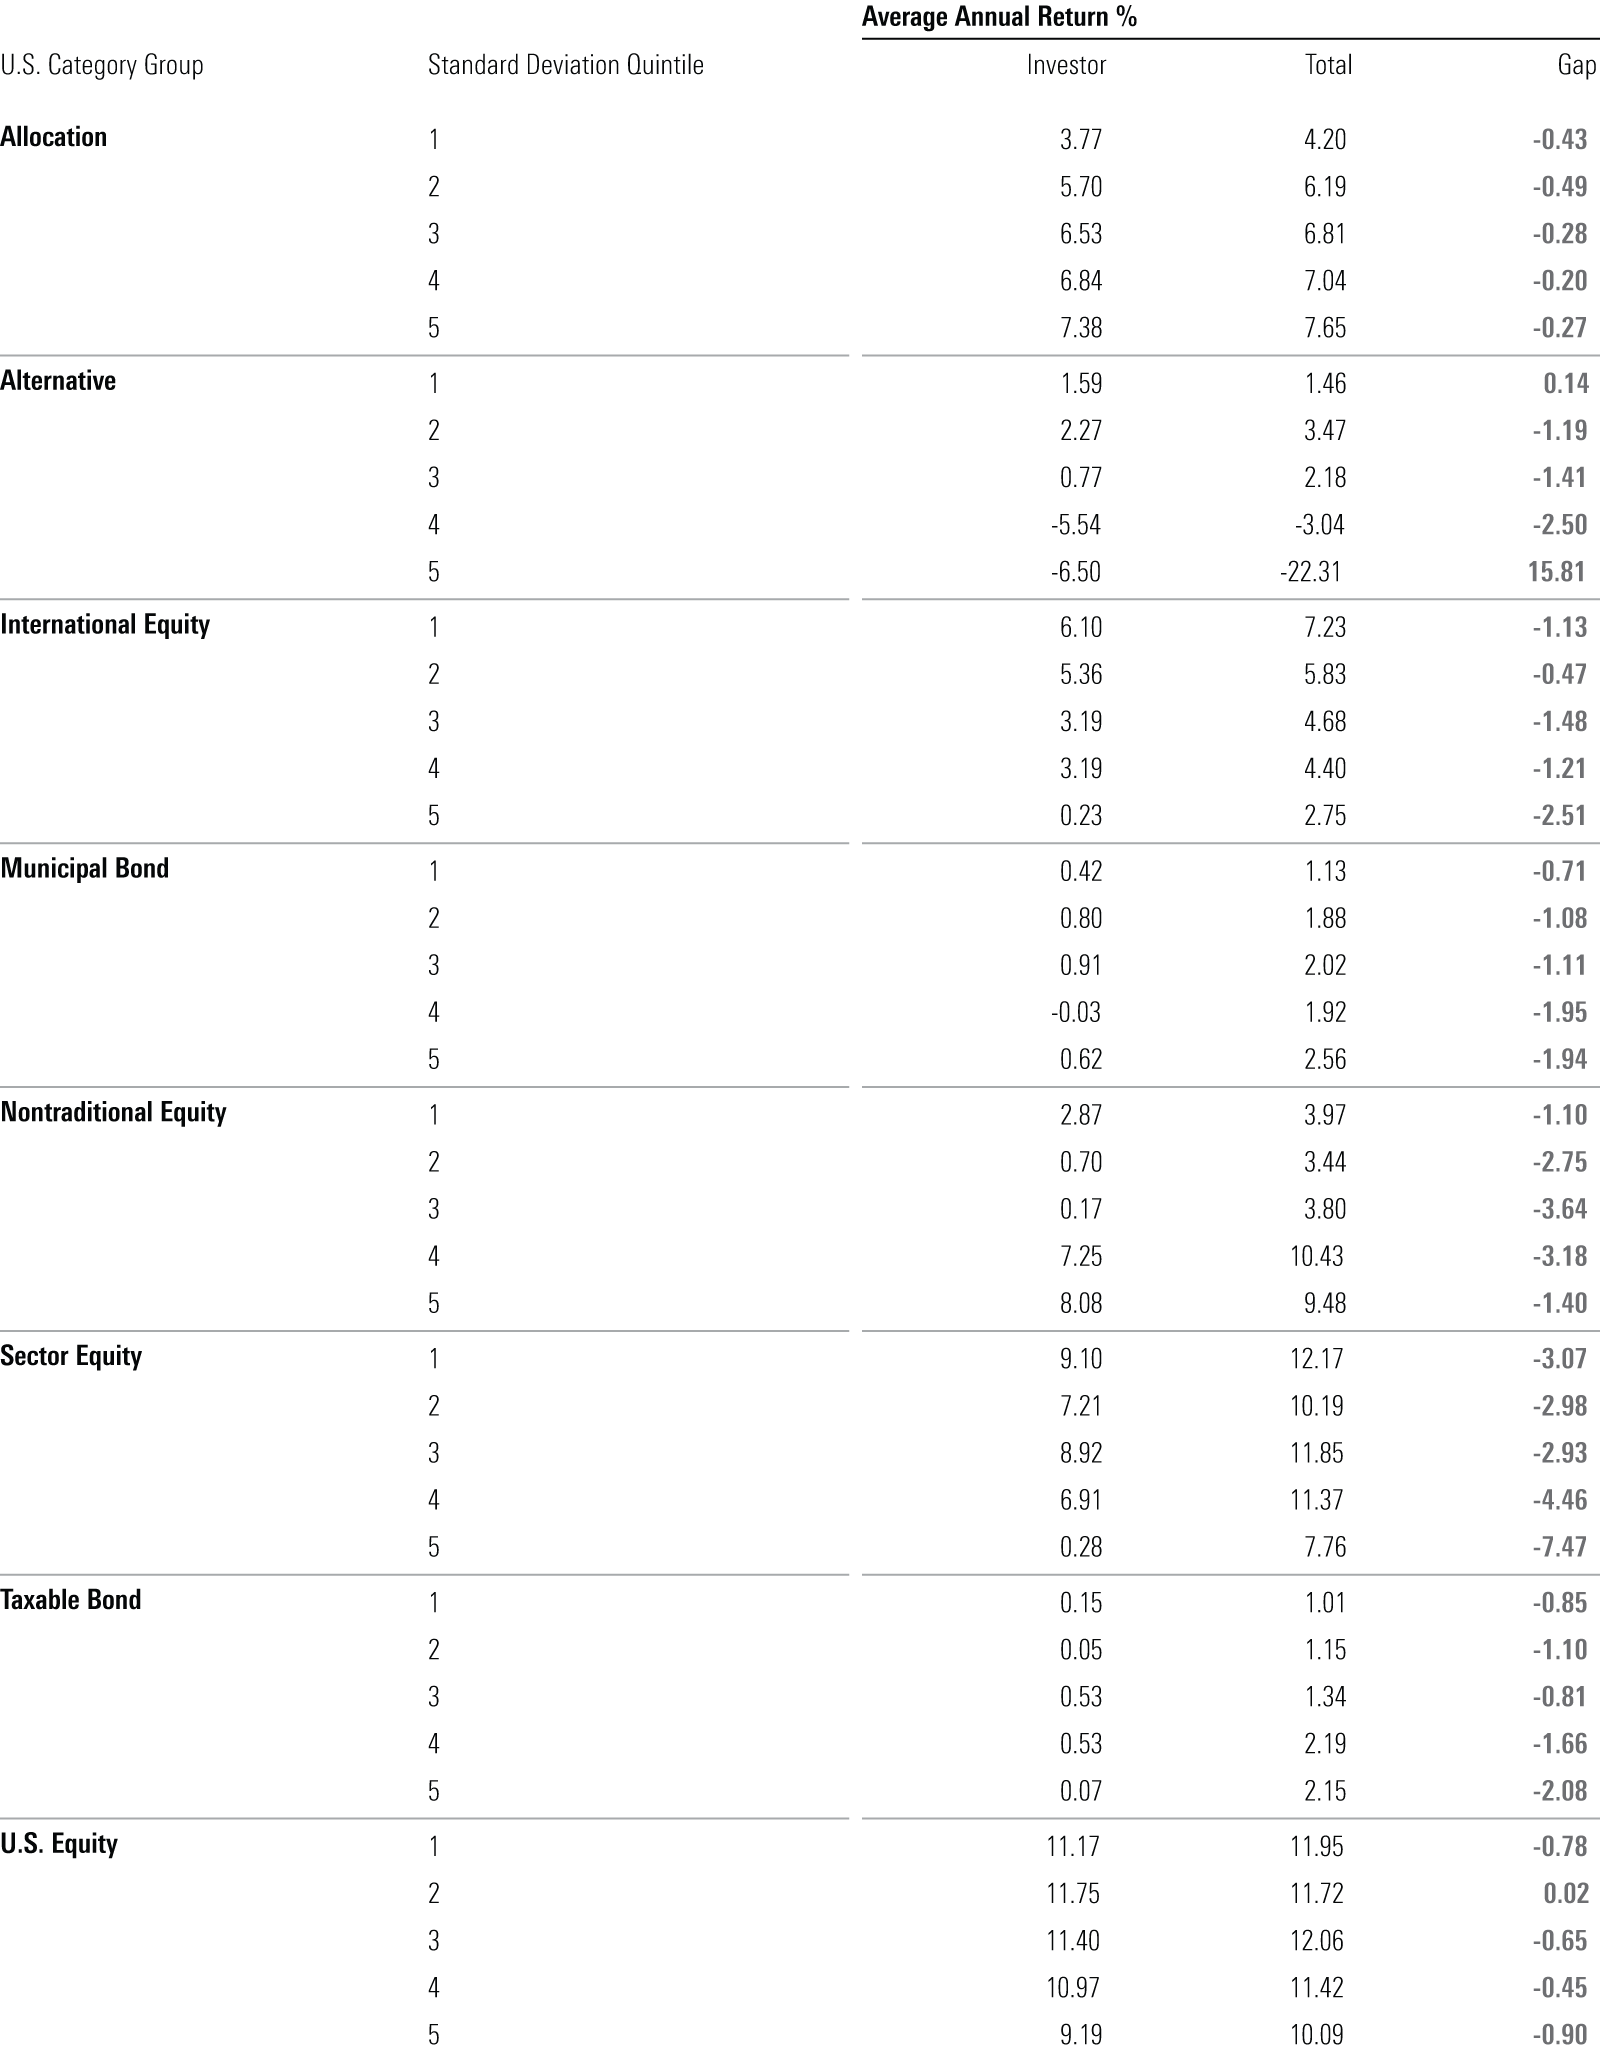
The least-volatile quintile had a smaller gap than the most-volatile quintile in six of the eight category groups. On average, the least volatile funds’ dollar-weighted returns lagged their total returns by around 0.9% per year, which was a full percentage point narrower than the gap for the most-volatile funds.
Takeaways and Lessons
While investors have made strides in many ways, our research finds that there’s still room for improvement when it comes to timing their investments. What can investors do to earn more of their fund investments’ total returns? Here are a few lessons to be drawn from our findings:
Less Is More
Time and again, we have found that investors in allocation funds capture a greater share of the funds’ total returns. Why? They are designed to be all-in-one holdings given they span multiple asset classes and rebalance on a regular basis, sparing investors from having to do much maintenance. Allocation funds also help mitigate the risk of mental-accounting mistakes that investors are prone to, such as buying more of a high-performing stand-alone strategy and selling a lagging one when they should be doing the opposite. Allocation funds combine these separate strategies to form a cohesive whole, and thus the performance divergences that otherwise might push investors’ buttons are largely unseen.
More (Focus and Volatility) Is Less
Another clear finding from the study is that investors have struggled to successfully use narrowly focused or highly volatile funds. These types of funds—whether they were nontraditional equity offerings or those that were among the most volatile in their category group—saw some of the heftiest return gaps that we measured. Most investors would likely be better off keeping it simple in ways that emphasize wide diversification and low costs, which means steering clear of strategies like these.
Good Beats Perfect
The evidence suggests investors enjoyed greater success by favoring simpler solutions like allocation funds. Interestingly, we found larger gaps in areas and styles for which there is robust academic support, like tilting to value, smaller-company stocks, or emerging markets, suggesting that the added volatility these strategies entail cost investors any excess return they might have earned and then some. The same held for more-exotic strategies that on paper might push a portfolio closer to the efficient frontier but in real life confound investors into costly mistakes.
Correction: Aug. 2, 2023: A previous version of this article contained an error in our estimate of the Allocation category group’s 10-year annual investor return for the 10-year period ended Dec. 31, 2022, that stemmed from a merger of two target-date fund series in 2022.
The author or authors do not own shares in any securities mentioned in this article. Find out about Morningstar’s editorial policies.
/cloudfront-us-east-1.images.arcpublishing.com/morningstar/T2LGZCEHBZBJJPPKHO7Y4EEKSM.png)
/d10o6nnig0wrdw.cloudfront.net/07-25-2024/t_56eea4e8bb7d4b4fab9986001d5da1b6_name_file_960x540_1600_v4_.jpg)
/cloudfront-us-east-1.images.arcpublishing.com/morningstar/BU6RVFENPMQF4EOJ6ONIPW5W5Q.png)
:quality(80)/s3.amazonaws.com/arc-authors/morningstar/550ce300-3ec1-4055-a24a-ba3a0b7abbdf.png)