
IMF Finally Sees Slowing Growth Just as Other Signs Turn Positive
Many world-growth indicators have looked better recently; meanwhile, the IMF checks in with yet another reduction in its 2016 forecast.

/s3.amazonaws.com/arc-authors/morningstar/54a49476-491f-4995-97f9-3a1f5e565321.jpg)
It was a good week for equity and commodity markets around the world. Weekly equity returns ranged from a low of 1.6% for the U.S. S&P 500 to a robust 3.6% for Europe. Commodities fell in the middle of that range at 2.26%, as investors await results of an oil producers' conference this weekend. More signs that U.S. production was finally being reined in also helped along commodities. Better economic news from China, especially from the housing and industrial sectors, provided an additional lift to the commodities sector. Equity markets were also helped along by better-than-expected earnings from some of the big U.S. banks, although the bar had been seen as unusually low for that group. U.S. economic news, at least on a headline basis, was modestly disappointing. Interest rates were little changed on the week, as the U.S. 10-year Treasury increased from 1.72% to 1.75%.
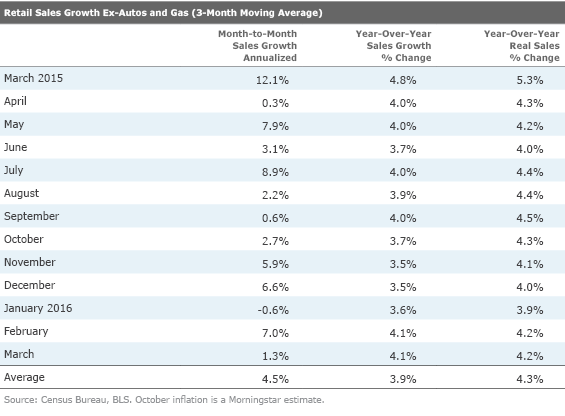
U.S. economic data seemed uniformly disappointing on a headline basis this week, with retail sales and industrial production coming in short of forecasts, as did headline inflation--all indicating potential weakness. We continue to believe that oscillating inflation and faulty seasonal factors are largely to blame and that year-over-year data remains indicative of an incredibly steady economy. A 1.1% decline in clothing prices and a 0.5% decline in food prices pummeled headline retail sales. We rate these as positives and not negatives. The retail sales report is not adjusted for these price declines. Year-over-year retail sales growth remained at 4%, the same as its 12-month average. Hardly a time to be sounding the alarm on consumer spending, as many did this week.
Industrial production also improved on a year-over-year basis, with year-over-year growth improving from just 0.2% in December to 0.7% in March, despite a sequential decline for the month. The annual gain is nothing to get too excited about, but at least the sector is moving in the right direction. However, the statisticians took a serious whack to historical 2014 and 2015 data points in their big annual revisions. Now 2014 grew just 2% instead of 3.4%, and 2015 grew 0.2% instead of 0.9%. On a side note, a big portion of the sequential decline in manufacturing industrial production was a 1.6% decline in auto production. That was partly due to what we believe to be faulty seasonal factors and partly due to the idling of an FCA small-auto plant. That plant will eventually be shifted to large pickup trucks.
CPI inflation came in below forecasts because of the big drops in clothing and food noted above, as well as a moderation in healthcare inflation that had been red-hot in the prior two months. The inflation data was little changed on a year-on-year basis with a core inflation rate at 1.8%, though the year-over-year headline average did creep up to 1.1%, closing some of broad gap between headline and core inflation.
As we mentioned, some of the news out of China was much better this week, including a GDP estimate for the first quarter. A lot of other forward-looking indicators of the Chinese and the world economy have continued to look better over the past several weeks. That has not been enough to keep the IMF from checking in this week with yet another reduction in its world growth forecast for 2016, this time from 3.4% to 3.2%.
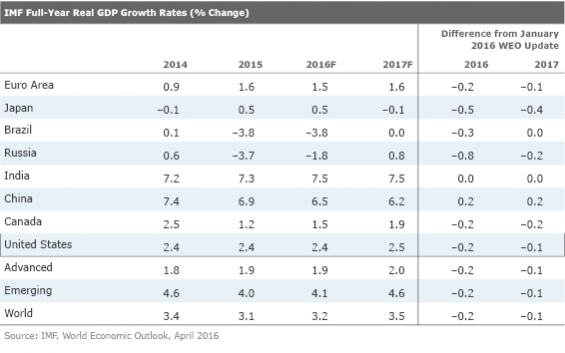
IMF Figures Out World Growth Has Slowed Just as Other Indicators Turn Positive This week the IMF reduced its world growth forecast for 2016 to 3.2% from 3.4%, acknowledging what was already pretty well-known by the market. Both developing and developed markets saw their growth rates cut by 0.2%. However, the 3.2% growth rate would still be better than the 3.1% growth rate of 2015 but well off the 4%-5% rates experienced immediately after the Great Recession.
Slower forecasts for the more commodity-oriented economies (Brazil, Russia, and to a lesser degree, the U.S.) were all factors in the lower estimates. Japan, which has a particularly strong demographic challenge, also hurt the growth calculations. Interestingly, the IMF raised its relatively conservative China forecast from 6.3% to 6.5%. This week, China reported first-quarter GDP growth of 6.7%, and some other positive short-term data on exports, home prices, and industrial production.
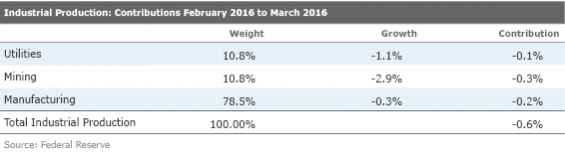
Industrial Production Manufacturing Shows Year-Over-Year Improvement A lot of pundits are ranting about another month of disappointing industrial production numbers. The headline industrial production was down 0.6%, and even the manufacturing-only data showed a 0.3% decline. Both of these figures were also below consensus averages.
We always warn that this sequential single-month data is nearly useless because of the volatility of some of the components, especially autos. We also tend to disregard the utilities measure, which typically reflects mainly weather conditions and mining data, which we already know is weak. In fact, markets are cheering strongly for some slowing in oil production. (Lower production would slow the fall in energy prices and avoid financial Armageddon for the riskier oil producers and their lenders.)
However, we prefer to use the year-over-year averaged data that paints an improving story, albeit at a glacial pace, for manufacturing. After some rough comparisons with some very strong months a year ago, the year-over-year data is improving. From a low of 0.1%, the data has improved to 0.7%. Given stronger purchasing manager data from around the world, we expect even better results next month. Note the huge improvement in the ISM purchasing manager results for the most recent two months, which bodes well for industrial production over the next several months.
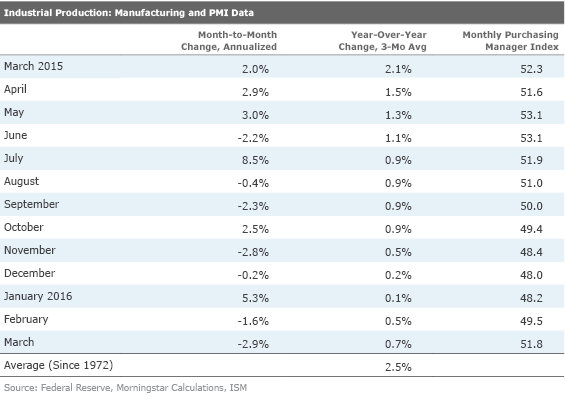
Even the Monthly Numbers Aren't as Bad as They Look We note that even in the month-to-month data (left-hand column above), volatile auto production figures skewed recent results. Auto production was down 1.6% in March most likely because of a too-good-to-be true 5% jump for the single month of January. The proper set of seasonal factors for the auto sector continues to elude government statisticians. In general March was not a wash out. Five of the top 10 categories that we track closely were up in March, including chemicals and computers, two large and important sectors.
Revised History Shows the Past Three Years Were Worse Than Previously Thought for Manufacturing This month's report also brought some rather large reductions in manufacturing data for the past three years. An outlier 3.4% growth rate for 2014 has turned into a below-average performance of just 2.0%.
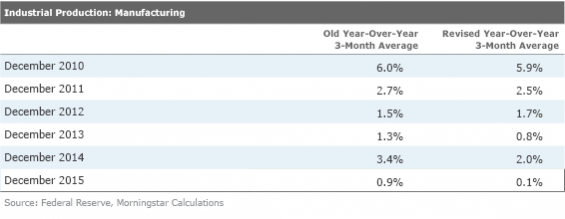
Data for 2015 barely evaded an outright decline, now growing just 0.1%. The revisions were broad-based, though there were a few categories that were revised higher, including computers.
We are unsure exactly how all of this data will flow through the other government and GDP-related accounts, but it would seem to suggest the economic growth may not have been as strong as previously believed and productivity factors may look even worse. The good news is that things seem to be on the mend now, and we still think manufacturing growth for 2016 could come in at 2% or higher, especially because the goal posts were moved a little closer by the big downward revision for 2015.
Inflation Takes a Break The headline Consumer Price Index increased just 0.1% in March, surprising most analysts, including us. Expectations were that higher gasoline prices would push the index up to 0.2% or 0.3%. However, the combination of a slower-than-expected increase in gasoline as well as an outright decline in grocery prices held back the headline inflation rate. A huge decrease in clothing prices, hotel prices, airline tickets, and moderation in healthcare inflation also managed to hold back monthly core inflation growth to just 0.1% versus expectations of 0.3% growth. This followed two months of sequential 0.3% core inflation growth that was quite worrisome. That will potentially help consumers in April, although gasoline prices continue to press higher.
However, the year-over-year data is not quite as benign.
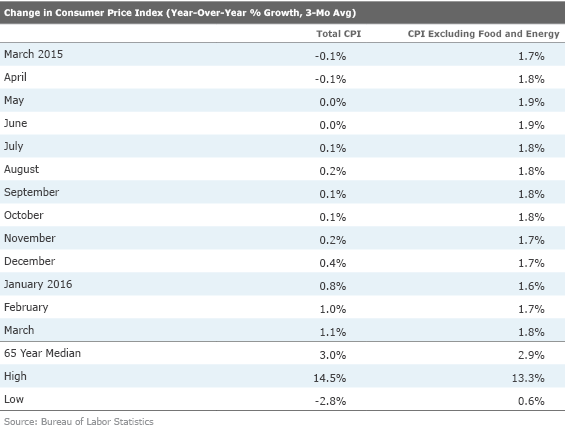
The signs of an end to the massive deflationary pressures are evident in the total CPI data above. However, those pressures may abate some for a couple of more months (gasoline prices soared last spring before settling back in late fall). By the end of the year, we believe that falling energy prices will provide no help at all, potentially lifting overall inflation to the core rate of 1.8%
As shown below, services inflation--our biggest worry--did not get any worse in March because of moderating medical services costs and falling airline ticket prices. Services inflation is running at 3% on a year-over-year basis. Rents still remain out of control, up 3.7% year over year. A collapse in hotel prices helped to moderate the overall shelter number, the key driver of the services number.
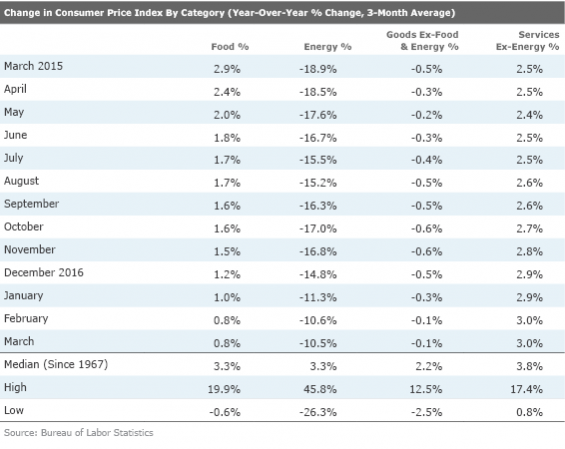
So, a slowing in the rate of energy deflation, a weaker dollar reining in goods deflation, and higher services inflation are all driving the year-over-year headline inflation rate higher. However, a surprising slowing in food price inflation is helping mitigate these other changes. Food prices could continue to moderate, helping assuage some of our concerns about headline inflation. Still, we remain relatively confident that the headline, year-over-year, inflation rate will be up by over 2% from just 1.1% currently, using our three-month averages. It's not great news for the consumer, but we had feared that the inflation results could have been even worse.
Worries About Consumer Spending Overblown Yet Again A lot of the analyses for retail sales focused on headline numbers that showed a 0.3% decline, as auto data along with their problematic seasonal adjustments managed to kill the headline number. Volatile month-to-month inflation numbers are also destroying the value of this report. Month-over-month goods inflation has been +0.2%, +0.3%, and negative 0.3% over the past three months. That turns the random negative 0.1%, +0.6% and +0.1% month-to-month retail sales (excluding autos and gasoline) numbers into a more logical negative 0.3%, +0.3%, and +0.4%. We aren't fans of month-to-month numbers, but we though it important to point that when adjusted for inflation, these numbers show just the opposite of what the pundits are claiming.
This is one of those very unusual months when we got the retail sales data and the inflation data in the same month to make these adjustments. We admit to being modestly concerned about some of the retail trends until we read the inflation report, which showed grocery prices down 0.5%, explaining the poor grocery sales number (no month-to-month growth) and clothing prices that dropped 1.1%, more than explaining the 0.9% decline in the apparel category of the retail sales report.
The year-over-year retail data remains incredibly boring, with continued growth of about 4%, as shown below. Current inflation-adjusted growth is at its 12-month average, hardly a matter of concern.
U.S. Data All About Housing Next Week The calendar lined up right next week, so we will get builder sentiment, housing starts and permits and existing-home sales all in one week. Builder sentiment has been running a little off of its highs in recent months, as a combination of worker shortages and the potential for higher interest rates weighed on their minds. We suspect that sentiment may have improved a bit given that the Fed seemingly put some their planned interest rate hikes for 2016 on hold at their most recent meeting. The consensus is for sentiment to improve from 58 to 59, but still below its October high of 65. We think the consensus might be too low and sentiment could cross into the 60s again for the April reading.
Housing starts had a big breakout month in June, led by a boom in single-family starts. The February number had a certain too-good-to-be-true element to it. That's why the consensus is for starts to drop from 1,178,000 in February to 1,170,000 in March. That would still be massively above last March's unusually depressed 954,000 units. We wouldn't be surprised if starts didn't drop a bit more, given the unexplained surge in single-family starts. Anything above 1,100,000 would be acceptable to us.
Existing-home sales had a slip in February with ongoing paperwork issues noted yet again. Given that pending home sales had a nice jump in the latest reading, we expect sales to bounce back in March. Expectations are for existing-home sales to bounce back nicely to 527,000 from 508,000 in February, which seems just about right to us. Housing continues to be one of the bright spots in the U.S. economy.
/cloudfront-us-east-1.images.arcpublishing.com/morningstar/CGEMAKSOGVCKBCSH32YM7X5FWI.png)
/cloudfront-us-east-1.images.arcpublishing.com/morningstar/BAG2H5VQKBERZKT5SM7JTWM6CY.jpg)
/d10o6nnig0wrdw.cloudfront.net/04-29-2024/t_eae1cd6b656f43d5bf31399c8d7310a7_name_file_960x540_1600_v4_.jpg)
:quality(80)/s3.amazonaws.com/arc-authors/morningstar/54a49476-491f-4995-97f9-3a1f5e565321.jpg)