4 min read
Advisors, Here's How the Morningstar Wide Moat Focus Index Has Performed

When we launched the Morningstar Wide Moat Focus Index in October 2007, we were not anticipating the boom in smart-beta ETFs, factor investing, or rules-based passive indexes. We were simply looking to package the work of Morningstar equity analysts into a strategy we would invest in ourselves.
What Makes the Wide Moat Focus Index Unique
Buying great businesses at great prices isn’t a novel approach to equity investing. But the Wide Moat Focus Index is unique in its use of active inputs in a passive format. Instead of screening stocks with backward-looking accounting measures like return on equity, we use the Morningstar Economic Moat Rating—a Warren Buffett-inspired, analyst-assigned gauge of sustainable competitive advantage. Rather than determining whether stocks are cheap on price/book or price/earnings ratios, we employ valuation—share price relative to the intrinsic value of the business.
In constructing the Wide Moat Focus Index, we subscribed to the philosophy that investing with the herd will deliver market-like returns. So the index takes a contrarian approach, selecting a compact group of high-quality companies when their stocks are unduly out of favor. Stock and sector weights deviate significantly from those of the market.
How the Wide Moat Focus Index Has Performed
The Wide Moat Focus Index now has an 18-year track record. That’s a rare distinction in an industry rife with back-tested returns. The index has weathered up and down markets, ridden out cycles in housing and commodities, and withstood markets led by both growth and value.
The graph below illustrates how $10,000 invested in the Wide Moat Focus Index at launch would have fared compared with our measure of the broad US market. The Wide Moat Focus Index turned $10,000 into $80,898.69 by May 31, 2025, while the same investment in the Morningstar US Market Index would have become $57,063.88. In terms of annualized return, the Wide Moat Focus Index averaged 11.50% compared with 8.99% for the market.
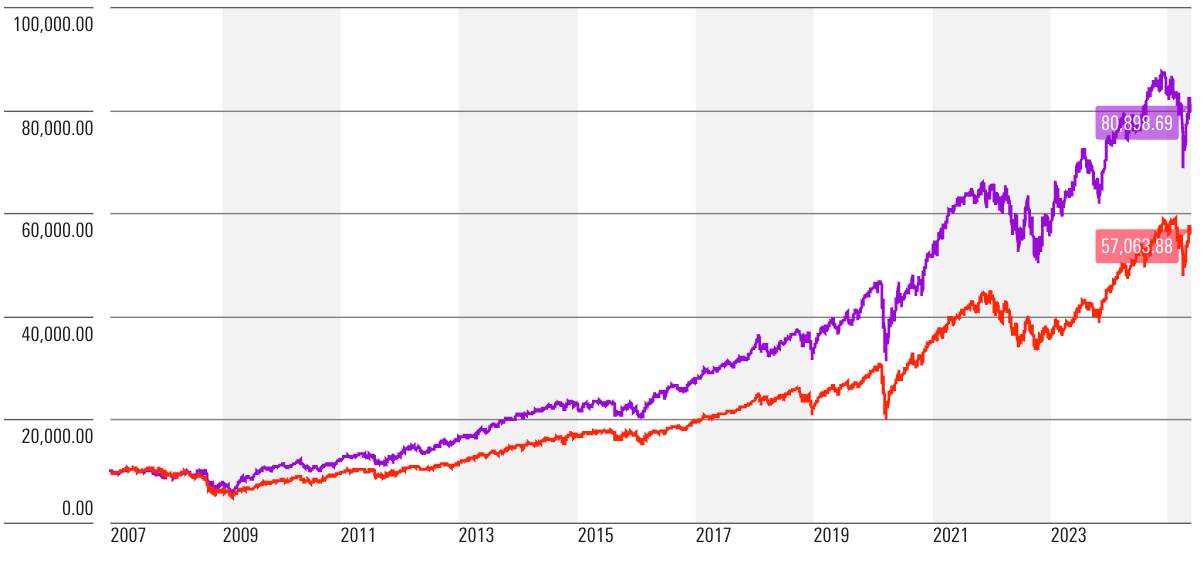
Source: Morningstar data as of May 30, 2025.
The index can undergo periods of underperformance, such as 2013-15. But as high-conviction strategies often do, the index made up lost ground quickly. It gained 22.4% in 2016 versus 12.4% for the market. The biggest contributors of 2016 included stocks as disparate as LinkedIn, St. Jude Medical, Harley Davidson, and Norfolk Southern.
Further, the index has benefited from both the moat screen and the valuation input. A strategy focused simply on high-quality stocks would not have performed as well.
Why It Pays to Be Selective
Even when the stock market looks pricey, there are always pockets of undervalued opportunity. For the long-term investor, the Wide Moat Focus Index has proved that it pays to be selective.