
Why Did Investors Keep Pumping Money Into a Flailing ETF?
The upside-down world of leveraged exchange-traded funds and investor demand.


There are two exchange-traded funds. One gained 29.4% per year from its March 11, 2010, inception through Nov. 6, 2026, making 72 times its original investment. Another lost nearly 100% of its value over that span.
Growth of $10,000: Dismal vs. Exceptional Performer (March 11, 2010 - Nov. 6, 2026)
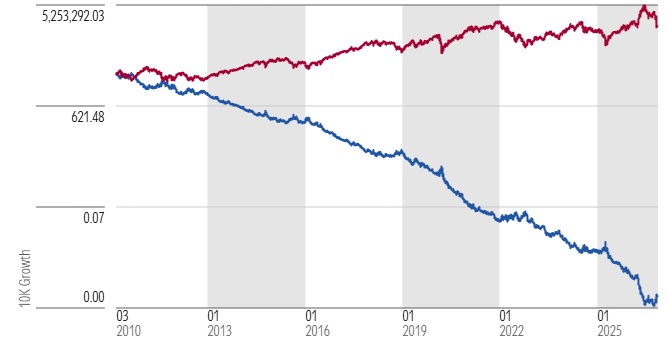
Guess which of these two ETFs outsold the other—the exceptional performer or the ETF that lost nearly everything? Answer: The dismal failure.
Est. Cumulative Net Flows: Dismal vs. Exceptional Performer
The dismal performer gathered nearly $9.6 billion in net inflows from inception through Nov. 6, 2026, while the exceptional performer saw $4.2 billion in net outflows during that same period.
Buy the Dips, Sell the Rips
I know what you’re thinking: There’s no way this could have happened. Investors ordinarily chase returns and flee losses, but the exact opposite of what took place here. What explains it?
Before I get to that, I should reveal the identities of these ETFs. The stalwart is Direxion Daily Semiconductor Bull 3x ETF SOXL, which seeks three times the daily return of stocks in the NYSE Semiconductor Index. The dismal performer is Direxion Daily Semiconductor Bear 3x ETF SOXS, which aims for three times the inverse daily return of that NYSE index.
The semiconductor bull ETF has done stupendously well thanks to chipmakers’ surging stock prices, while the latter’s been dealt blow after blow amid those stocks’ meteoric rise. But, of course, that alone doesn’t explain why the first ETF saw redemptions while the second raked in assets.
What’s striking when you compare these two ETFs is that you find investors used them in more-or-less the same way: They bought the dips by adding money on losing days, and sold the rips by redeeming assets on winning days. To illustrate, here’s what it looked like when I plotted the semiconductor bull ETF’s daily organic growth rate—its flow on a given day divided by net assets entering that day—against its daily returns.
Direxion Daily Semiconductor Bull 3x ETF: Daily Organic Growth Rate vs. Daily Total Return
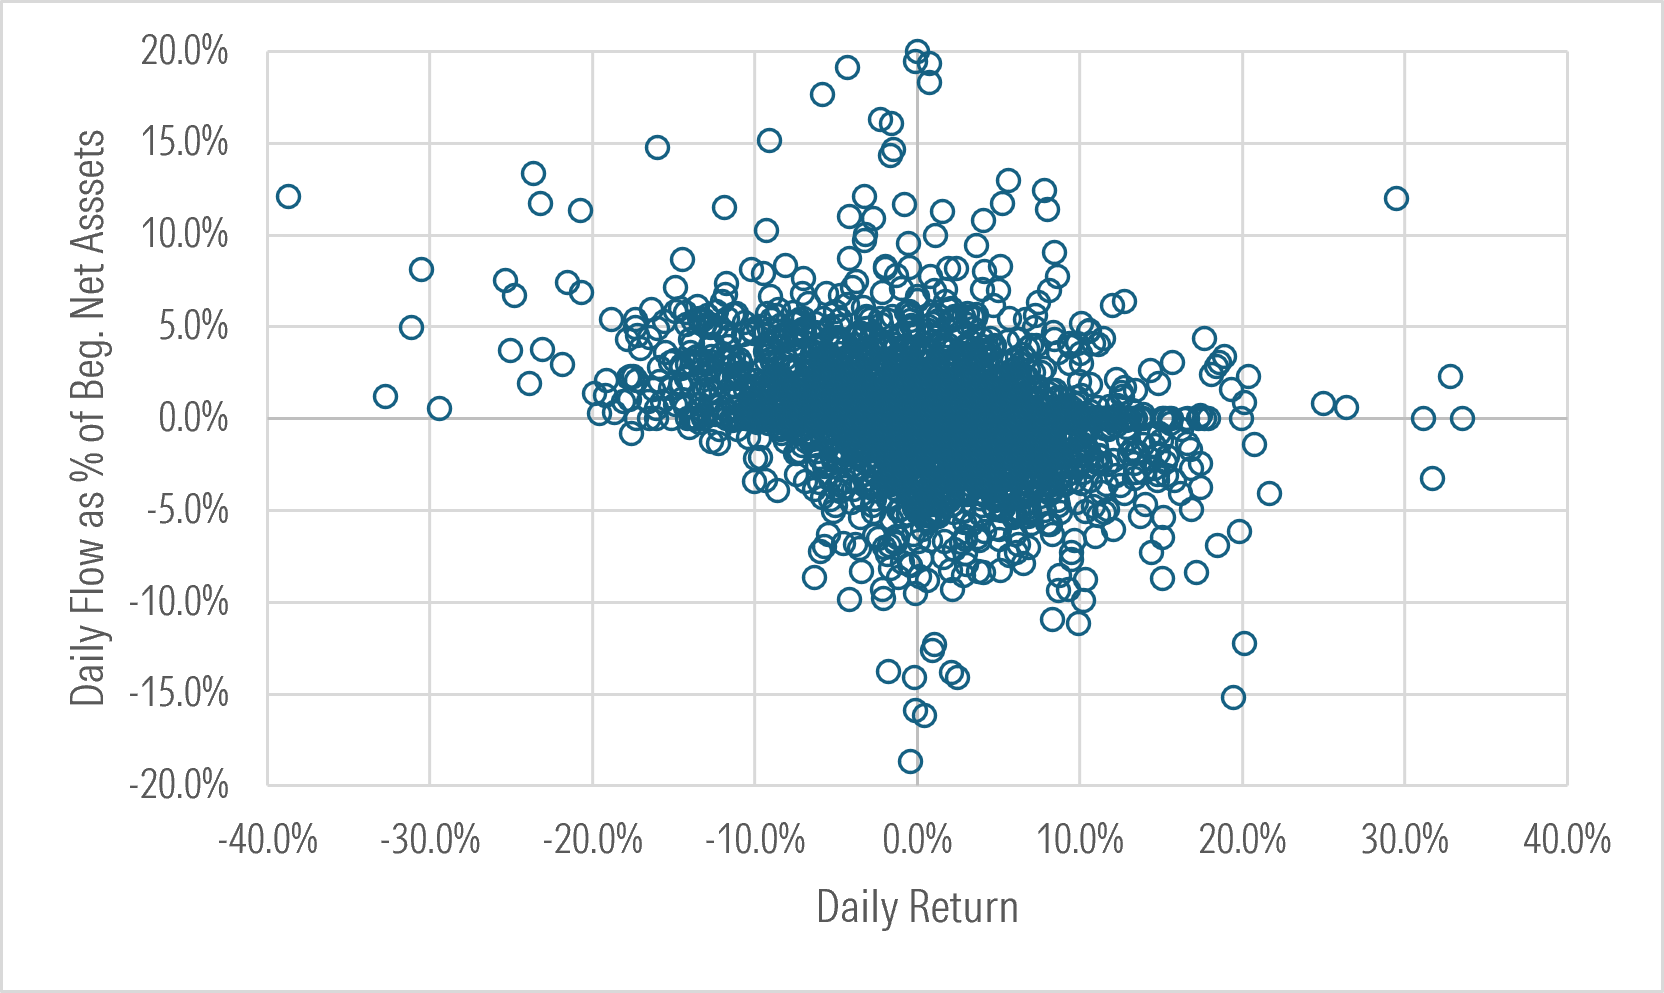
The upper-left quadrant is dip-buying; the lower-right quadrant is rip-selling. I estimate the bull ETF gathered a total of $118 billion on days it was in inflow, with nearly $92 billion of that coming on days it had fallen to a loss. On the flip side, of the roughly $122 billion in total redemptions on days it was in outflow, more than $97 billion came on days it had gained.
Direxion Daily Semiconductor Bull 3x ETF: Est. Aggregate Purchase and Sale Activity by Daily Return
Turning to the semiconductor bear ETF, investors used it essentially the same way as the bull ETF, buying when it fell and selling when it rose, as shown below.
Direxion Daily Semiconductor Bear 3x ETF: Daily Organic Growth Rate vs. Daily Total Return
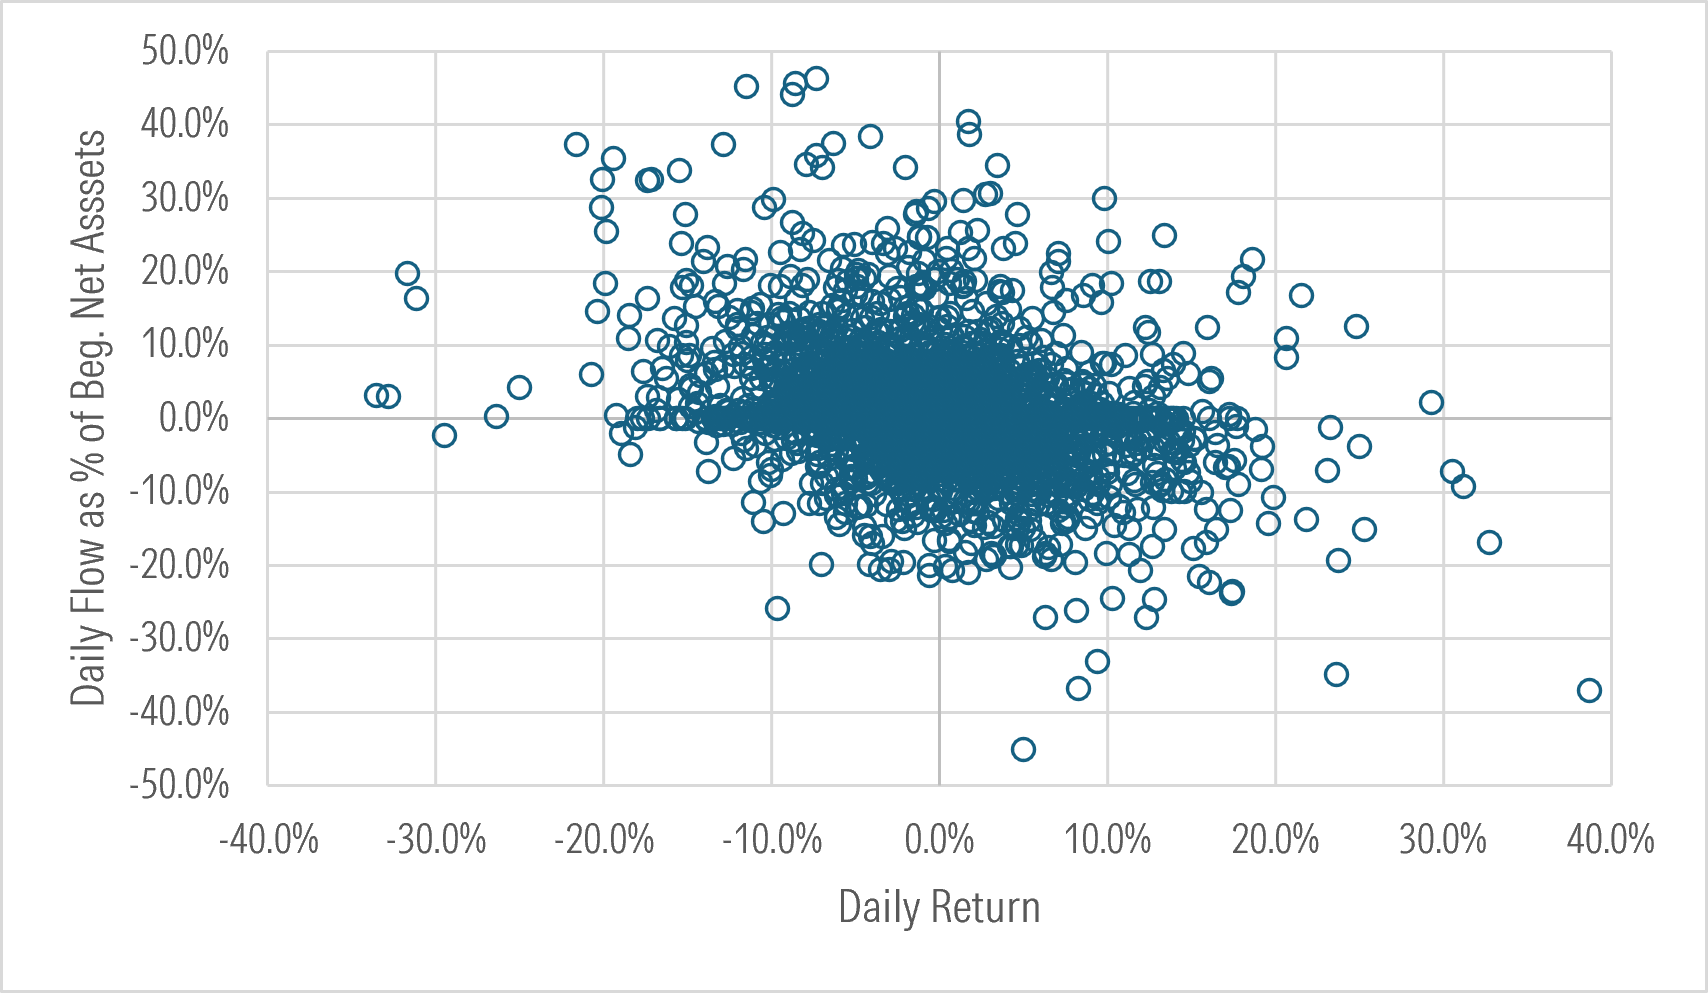
The semiconductor bear ETF gathered a total of $41 billion on days it was in inflow, with about $31 billion of that coming on days it had lost. Of the nearly $32 billion in total outflows on days it was in redemption, more than $24 billion came on days it had gained.
Direxion Daily Semiconductor Bear 3x ETF: Est. Aggregate Purchase and Sale Activity by Daily Return
Savvy Trading Results in Net Outflows
If investors used these two ETFs very similarly, but the bull ETF soared and the bear ETF crashed, why did the former cough up billions in assets while the latter ended up awash in inflows?
Let’s start with the bull ETF: It’s the rare instance where hefty gains—stoked by the index’s huge returns and the ETF’s 3x gearing—triggered rapid sales from investors eager to take profits. Those redemptions overwhelmed new demand.
Think of it this way: Imagine a $1 billion ETF gets a $100 million inflow. The next day it surges 10% higher and the investor who contributed the $100 million redeems his stake, now worth $110 million. Though the ETF finishes with the same number of shares outstanding as it had before the $100 million inflow came along, the initial investment ($100 million) and subsequent withdrawal ($110 million) net to a $10 million outflow.
It appears that sort of scenario played out repeatedly for the bull ETF. For instance, on June 2, 2026, the ETF had 112 million shares outstanding. By June 22, 2026, that figure had risen slightly to around 112.6 million shares. Yet, the ETF saw $1 billion in outflows over this period because investors routinely sold at higher net asset values per share ($263.47 per share, on average) than they bought at ($195.91 per share).
Direxion Daily Semiconductor Bull 3x ETF: Daily Changes in Shares Outstanding vs. NAV
Opportune buying and selling of this sort arguably made the bull ETF the most successful fund investment in history: I estimate the average dollar made almost 37% per year from inception through Nov. 6, 2026, exceeding the ETF’s 29.4% yearly return during that time. That translated to a cool $19.7 billion in lifetime gains, but also billions in outflows because the value of shares redeemed so often well exceeded the value at which they were bought.
Gluttons for Punishment?
If seemingly no good deed went unpunished at the bull ETF, no sin went unrewarded at the bear ETF. As mentioned, it lost virtually 100% of its value from its March 2010 inception through Nov. 6, 2026, soaking shareholders with $4.6 billion of cumulative losses. Yet, investors kept shoveling assets into it, to the tune of $9.6 billion in lifetime net inflows.
Why did investors keep throwing good money at it? There are a few possible explanations. For one, those trying to use the ETF to hedge positions in a certain dollar range would have had to almost constantly replenish the investment following deep losses. To illustrate, here are the average maximum peak-to-trough drawdowns an investor would have seen over rolling periods of various durations.
Direxion Daily Semiconductor Bear 3x ETF: Average Maximum Drawdown by Duration of Rolling Period
There’s also the math of placing a leveraged short bet: A short position has limited upside—the shorted asset can fall by only 100%, after all—but unlimited downside, and that’s torqued by the leverage. Though investors showed a contrarian streak, buying on down days, they often failed to reap the benefits of mean reversion because losses clustered.
Indeed, when I sorted the bear ETF’s daily returns and focused on the 20 losing days where it saw the largest inflows, I found it more often tumbled than gained in the days that followed.
Date | Flow (USD) | T+1 Return | T+7 Return | T+30 Return |
|---|---|---|---|---|
| 6/18/2026 | 437,023,849 | -7.5% | 2.3% | 55.2% |
| 4/24/2026 | 431,447,520 | 3.9% | -4.0% | -42.9% |
| 5/25/2023 | 415,472,943 | -19.3% | -17.1% | -18.1% |
| 4/8/2026 | 415,153,225 | -6.5% | -22.4% | -67.2% |
| 5/12/2025 | 341,251,741 | -8.4% | -5.6% | -24.2% |
| 5/5/2026 | 307,839,032 | -14.9% | -22.1% | -54.7% |
| 6/2/2026 | 305,967,000 | -5.1% | 14.7% | -11.8% |
| 9/19/2024 | 294,698,917 | 4.7% | -12.7% | -6.0% |
| 9/21/2026 | 293,114,346 | -8.3% | -2.3% | 25.5% |
| 4/9/2026 | 292,285,150 | -6.1% | -19.5% | -64.9% |
| 8/31/2023 | 282,439,733 | -0.7% | 8.9% | 23.3% |
| 5/26/2026 | 274,776,765 | 3.7% | -18.0% | -42.0% |
| 8/4/2026 | 274,292,593 | 6.1% | 3.6% | 21.3% |
| 6/30/2026 | 267,379,404 | 19.6% | 48.6% | 66.6% |
| 1/6/2025 | 261,175,456 | 4.4% | 16.5% | 7.0% |
| 4/1/2026 | 259,087,411 | -0.8% | -25.6% | -64.2% |
| 1/12/2023 | 254,154,319 | -1.1% | 8.6% | -26.5% |
| 6/24/2025 | 250,374,400 | -2.5% | -2.7% | -7.4% |
| 1/18/2024 | 245,230,050 | -11.7% | -17.1% | -22.0% |
| 11/16/2023 | 241,087,686 | -1.9% | -1.7% | -27.9% |
For instance, investors pumped $415 million into the ETF on May 25, 2023, a day it fell 20.1%. But it skidded another 19% the following day. In fact, it would take another five months before the ETF regained the level investors came in at on May 25 because the initial cluster of losses put it in a deep hole that took months to dig out of.
As an accounting matter, the ETF records net inflows over periods like these, as the value of investors’ initial purchases exceeds the depreciated value they later sell at—the reverse of what we saw at the semiconductor bull ETF.
Rebalancing Act
Judging from these two ETFs’ flows and dollar-weighted returns, you might conclude that the bull ETF investors were brilliant and the bear ETF investors were incomprehensibly daft. But it’s not that simple.
Rather, this resembles rebalancing, with investors pruning their winners and using those proceeds to shore up their stake in the laggards. Consider that the short ETF collected around 82% (roughly $33.7 billion) of its aggregate inflows on days when the long ETF was in redemption and saw 84% (around $26.5 billion) of its total outflows on days the long ETF was receiving inflows.
Direxion Daily Semiconductor Bear 3x ETF: Est. Aggregate Net Flows by Direction of Direxion Daily Semiconductor Bull 3x ETF's Daily Net Flows
On the flip side, the long ETF gathered around 72% of its aggregate net inflows on days the short ETF was in redemption and 90% of its total outflows came on days the short ETF was getting inflows.
Direxion Daily Semiconductor Bull 3x ETF: Est. Aggregate Net Flows by Direction of Direxion Daily Semiconductor Bear 3x ETF's Daily Net Flows
Does that mean the same group of investors allocated to both ETFs and then sloshed capital between them? No. But it could be the case that those in the long ETF underweighted semiconductor exposure elsewhere and, conversely, those in the short ETF were hedging overexposure somewhere else. Rebalancing flows would be a predictable outcome in such a scenario.
For instance, if semiconductor stocks popped, a bull ETF investor seeking to keep their exposure within a certain range would prune at least some of their stake, bagging gains in the process while triggering an outflow. Whereas a bear ETF investor would do the opposite, adding money to rebuild the stake, ensuring it was large enough to hedge any long position held elsewhere.
Zooming Out
This phenomenon doesn’t seem to be unique to these two Direxion ETFs. It’s also apparent at other leveraged long-short ETF pairs.
Take ProShares UltraPro QQQ TQQQ and ProShares UltraPro Short QQQ SQQQ, the largest leveraged long and short ETFs, respectively, by net assets. The long QQQ ETF gained 57.4% per year over the three years ended Oct. 31, 2026, while the short QQQ ETF lost 54.4% yearly. Despite this, the long ETF saw $35 million in cumulative net outflows, while the short ETF gathered $9.6 billion in net inflows.
Here’s a scatterplot comparing the long ETF’s daily flows to the short ETF’s over the three years ended Oct. 31, 2026.
Daily Flows: ProShares UltraPro QQQ vs. ProShares UltraPro Short QQQ
Though daily flows were positively correlated in some instances, they were usually opposed, with one ETF in inflow and the other in redemption, and vice versa, similar to what we saw with the Direxion semiconductor ETFs.
When I analyzed the recent flows and returns of leveraged long and short ETFs as a whole (excluding single-stock ETFs), I found the leveraged long ETFs—which had posted standout returns—in net redemption and the short ETFs in net inflow despite hefty losses.
Aggregate Est. Net Flow and Average Annual Returns of Leveraged Long Equity and Leveraged Short Equity ETFs
Over the three years ended Oct. 31, 2026, the leveraged long ETFs saw nearly $43 billion in aggregate outflows ($12.5 billion excluding the long versions of the Direxion semiconductor and ProShares QQQ ETFs). The leveraged short ETFs, on the other hand, gathered almost $19 billion in net inflows ($3.7 billion excluding the short versions of the Direxion semiconductor and ProShares QQQ ETFs).
When you consider that the average leveraged long ETF gained 30.3% per year over this period while the average leveraged short ETF lost 29.9% annually, it makes the direction of these flows all the more stark.
Conclusion
At first glance, the pattern of flows to leveraged equity ETFs seems to defy logic. Though leveraged long ETFs generated eye-popping gains, investors pulled money from them. And while leveraged short ETFs’ performance was putrid, it apparently wasn’t awful enough to deter investors from plunking new money into them.
But upon closer review, the evidence suggests something more mundane is going on. Both sets of investors are buying on dips and selling on rips or, put another way, paring winners and padding losers. There’s a word for that: Rebalancing.
Switched On
Here are other things I’m reading, watching, and listening to:
- Daniel Sotiroff on the trade-offs active equity ETFs face
- Christine Benz on why boring is beautiful
- “One Bad Day: A Levered QQQ ETF Case-study” by Dave Nadig
- Jason Zweig asks whether value indexes are still a bargain bin
- An extraordinary, marvelous story
- No Country for Old Men by Cormac McCarthy
- One Battle After Another
- The Record by boygenius
- XO by Elliott Smith
Don’t Be a Stranger
I love hearing from you. Have some feedback? An angle for an article? Email me at jeffrey.ptak@morningstar.com. If you’re so inclined, you can also follow me on Twitter/X at @syouth1, and I do some odds-and-ends writing on a Substack called Basis Pointing.
The author or authors do not own shares in any securities mentioned in this article. Find out about Morningstar’s editorial policies.

 United States