
Market Wizards Wave Their Wands but Investors Miss the Magic
Trend-following managers have enjoyed a resurgence, but investor behavior has led to a muted experience.


Why the Interest in Trend-Following?
Systematic trend strategies primarily trade long and short liquid global futures, options, swaps, and foreign-exchange contracts to implement their trend-following, price-momentum mandates. These portfolios typically obtain exposure to a mix of diversified global markets, including commodities, currencies, government bonds, interest rates, and equity indexes. In Morningstar’s broad grouping of alternatives, we consider systematic trend along with macro trading to be in a different universe than other diversifying alternatives—such as event-driven, relative value, or multistrategy funds—because of the differing return profiles.
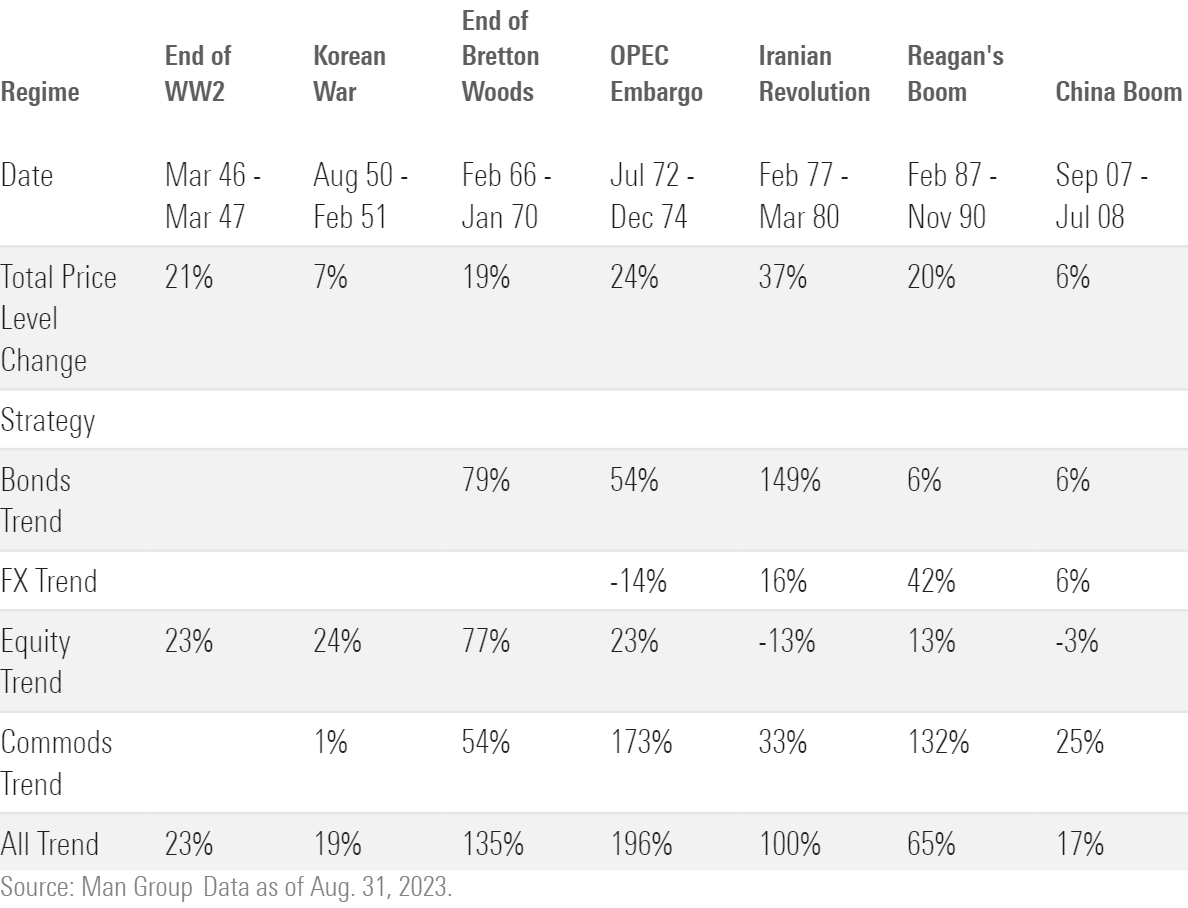
After a challenging period in the mid-2010s, market dispersions over the past five years have provided systematic trend-followers with an environment much like that of their 1970s heyday of the original “Market Wizards.” This was a period characterized by a commodities boom and multiple inflation regimes during which trend recorded growth of over 100%.
Trend Following During Inflationary Regimes
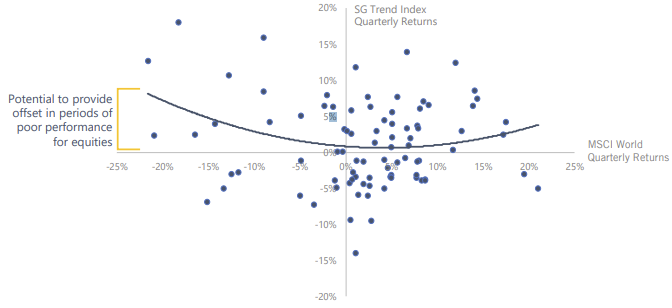
Today, however, investors are more likely to associate trend-followers with a potential to deliver returns during weaker periods for equities. Although many confuse this potential with a law of physics, providing uncorrelated returns during normal times and positive returns in market downturns does not equate to negative correlation. This potential is also coupled with instances of positive correlation with equity markets. A downturn is not a crash, and the lack of protection by trend-followers during the fourth quarter of 2018 should be a recent reminder of this.
The Potential of Trend to Offset Weak Equity Markets
Greater Awareness Delivers Flows Surge
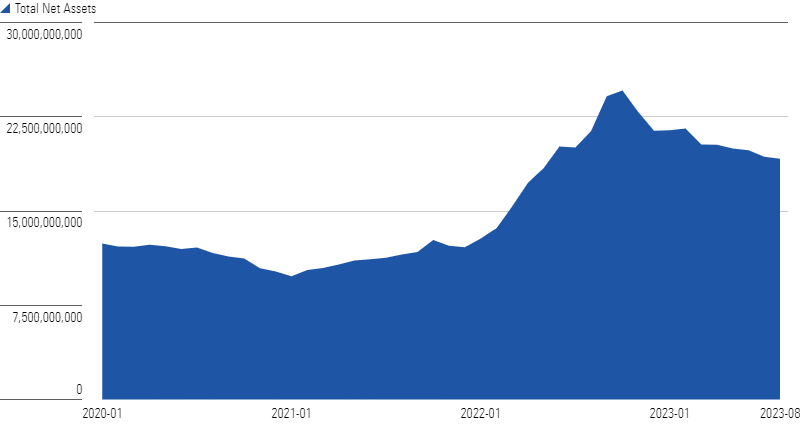
This long-dormant category started finding a new lease on life in early 2021. Many investors only became aware of the category after the strong performance during the market struggles during the onset of the coronavirus in February to March 2020. In this period, the category average fell by 3.17% versus over 33% for the S&P 500. In early 2021, the first net inflows appeared since mid-2016. By year-end, $1.67 billion of new moneys had accumulated, as highlighted in our report “Winners Take It All in Liquid Alternatives.” As equities struggled continuously during 2022, inflows ramped up. During the first nine months of 2022, the relative performance gap between the category average and the S&P 500 was 43%. This coincided with the category taking in $8.5 billion in the first 10 months of the year, bringing total assets up to just shy of $25 billion, doubling in 18 months. This interest has even led to the ultimate sign of mass market adoption, a trend-following exchange-traded fund, iMGP DBi Managed Futures Strategy DBMF.
The Investor Experience
While trend has always been a popular area for institutional clients, the relative performance in 2020 and 2022 led to mutual fund investors climbing aboard while equities and bonds were falling, which, in effect, meant selling equities after they had fallen and buying into the rising trends. Our annual “Mind the Gap” reports illustrate this phenomenon of investor behavior and demonstrate the fallacy of market-timing. It is even harder to time those that themselves are market-timers.
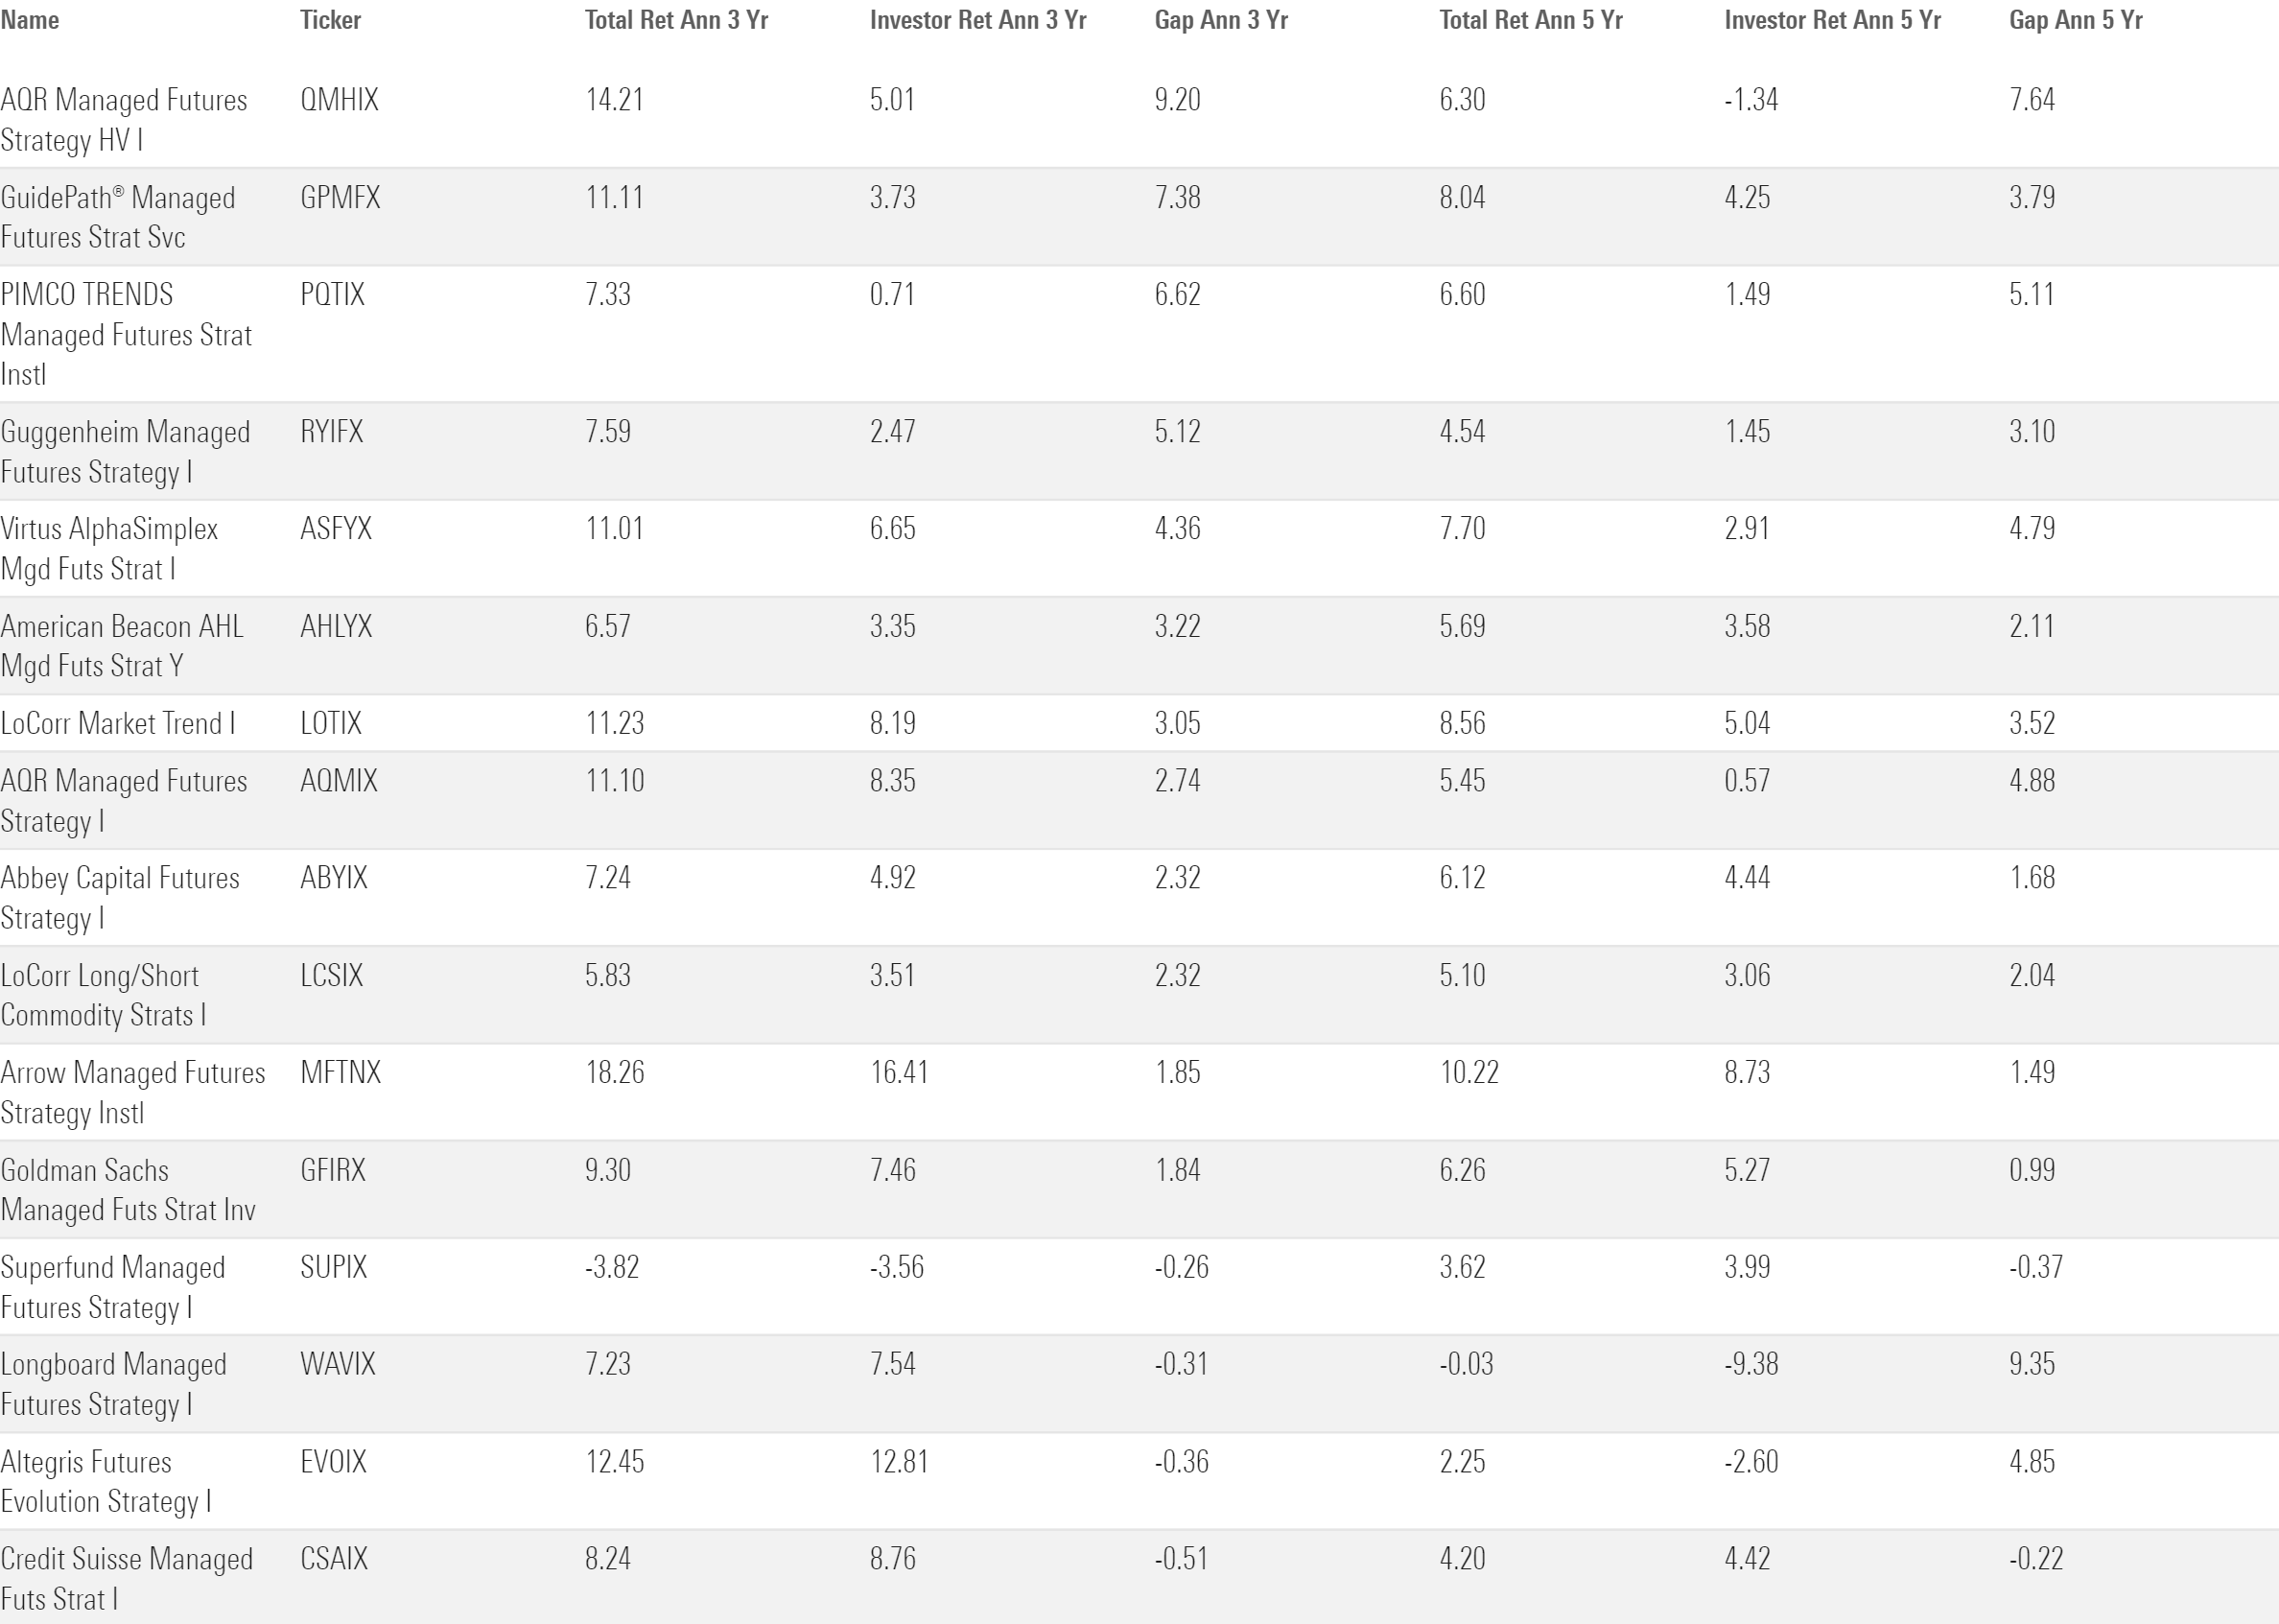
The past three years to August 2023 have seen annualized double-digit returns in several funds. Yet the average investor return is far from that. The Morningstar Investor Return data point in Morningstar Direct uses a dollar-weighted return to measure how the average investor fared in a fund over a period. This considers the impact of cash inflows and outflows from purchases and sales and the growth in fund assets.
Systematic Trend Total Net Assets
Investor returns have lagged over three and five years. One of the top-performing funds, AQR Managed Fund HV QMHIX, has had an investor gap of 9.2% per year, meaning many of its investors only saw 5% annualized returns versus 14.2% for the fund for the trailing three years to August 2023. One of the fastest-growing liquid alternatives funds is Pimco Trends Managed Futures PQTIX, which rose sevenfold between 2020 and 2022 to $4.8 billion in October 2022. Yet investors have missed the boat here, too, receiving a measly 71 basis points despite a 7.33% annualized return for the fund. This may have contributed to the $1.4 billion in outflows it has experienced since that high point. Five years later and the story is the same, as one of the strongest performers over that period, Virtus AlphaSimplex Managed Futures ASFYX, with a Morningstar Medalist Rating of Bronze, returned an annualized 7.7%. Yet investors have given up over 60% of this return, receiving only 2.91% per year.
Investor Return of Systematic Trend Managers
Staying the Course
The systematic trend category contains some of the largest dispersion between managers of all mutual fund categories. Strategy nuances make both tactical timing of entry and exits and selecting the right fund for a strategic allocation incredibly hard, as investors need to be aware of the following:
- Number of Markets Traded—The number of individual futures markets traded can range from the early 50s up to over 500. The reason for adding a new market is largely for diversification. However, because of market correlations, performance may plateau, which limits the benefits of expansion. Managers tend to expand with asset size, as their positions in smaller markets affect execution and liquidity.
- Esoteric Markets—As financial markets have exploded, there is now ample liquidity in what were smaller markets such as European energy, Chinese onshore futures, or African rates. Traded assets have gone beyond futures into credit default swaps and other assets with price series momentum. AQR has taken this further, including momentum signals on macro indicators themselves.
- Volatility Level—While the choice of a product’s volatility target may come down to manager selection, the exchanges, and markets in which they trade, also affect it—with more-volatile and newer commodities contracts often requiring higher margins for trading. Individual strategies’ average volatility targets range from 8% up to 17%, with peak levels being much higher.
- Signal Speed—This is how much of a look-back period is used to determine if a trend is in place. This may vary from days to years but tends to avoid intraday trading. While a shorter signal may allow a strategy to move from long to short quickly, and vice versa, it may also result in many small losses, as markets oscillate ahead of a newly forming trend.
- Nontrend Influence—Increasingly, strategies are moving beyond price-series momentum and using other modulating factors when trends aren’t present. This may stop the small losses incurred when trends are absent but introduces another group of risk factors such as seasonality, value, and carry.
Choosing between strategies is hard, and a multimanager option in the category, like Silver-rated Abbey Capital Futures Strategy ABYIX, may be worth the extra layers of fees for a professional approach to manager selection, portfolio rebalancing, and ongoing diligence. But whatever the choice, while a smoother return path may be welcome, it is important to maintain the key strategy characteristics mentioned at the beginning of this article. When considering systematic trend for a portfolio, it needs to be considered as a strategic allocation. Again, don’t time a timer.
3 Biggest Mutual Fund Downgrades of 2023
The author or authors do not own shares in any securities mentioned in this article. Find out about Morningstar’s editorial policies.
/cloudfront-us-east-1.images.arcpublishing.com/morningstar/5WSHPTEQ6BADZPVPXVVDYIKL5M.png)
/cloudfront-us-east-1.images.arcpublishing.com/morningstar/OMVK3XQEVFDRHGPHSQPIBDENQE.jpg)
/cloudfront-us-east-1.images.arcpublishing.com/morningstar/BNHBFLSEHBBGBEEQAWGAG6FHLQ.png)