
How to Find Sustainable Fund Flows
How to filter for the fund companies with the most sustainable flows and a suggestion on how to illustrate the results.
/s3.amazonaws.com/arc-authors/morningstar/ac242d77-42e4-4165-951a-b300b089a834.jpg)
Sustainable fund flows continue to draw more attention as investors become more aware of the environmental, social, and governance risks of their investments. Fund companies are delivering more ESG-friendly strategies to meet growing demand, and some are taking advantage of this wave more than others. Morningstar analysts keep tabs on asset flows to follow this and other trends, slicing fund flows data in many ways to see which funds investors are buying.
Here’s how to find sustainable fund flows data by fund family for the last five calendar years, year-to-date 2022 data, and tips on visualizing it.
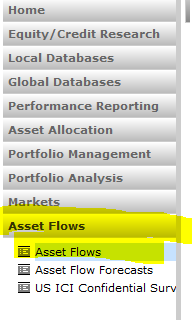
To start, go to the Asset Flows module, which can be found on the left side of the Direct screen.
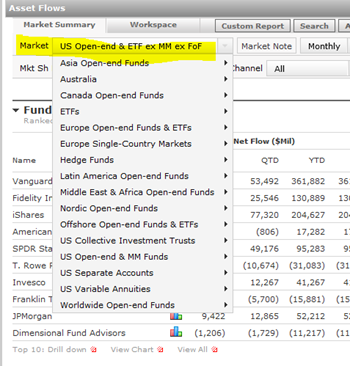
Then, choose the investment universe. There are choices for various vehicles and global markets. For this example, we’ll pick U.S. open-end and exchange-traded funds, excluding money market funds and funds of funds.
Next, click on the Custom Report tab at the top of the page. A pop-up window will appear. The top of the pop-up window shows the originally selected market (in this case, U.S. Open-end and ETFs ex MM ex FoF). Below it, there is the option to give the search a query name, which you can save to run the same search in the future. You can further refine flows data by selecting a broad fund group in the Group By dropdown box. For this example, we'll select Sustainable Fund by Prospectus because we want to examine sustainable fund flow trends.
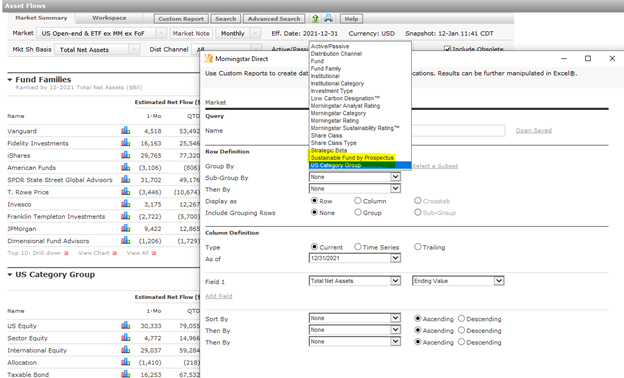
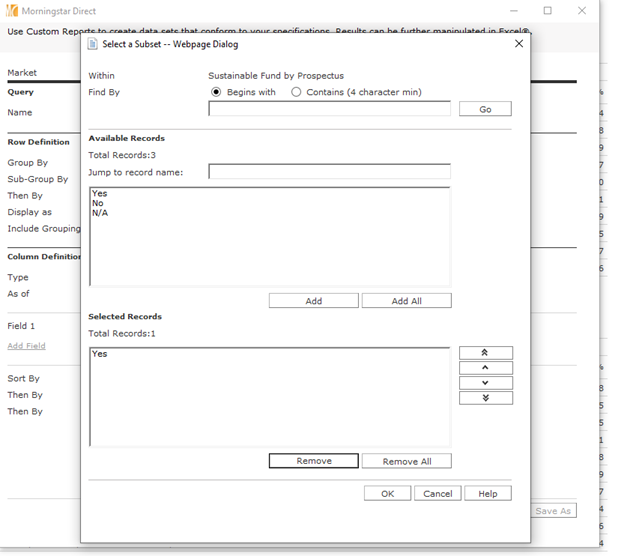
Then click Select a Subset next to the Sustainable Fund by Prospectus and remove the No and N/A options in the Selected Records box at the bottom. This excludes funds whose prospectuses either do not declare they are sustainable or that lack the data for consideration.
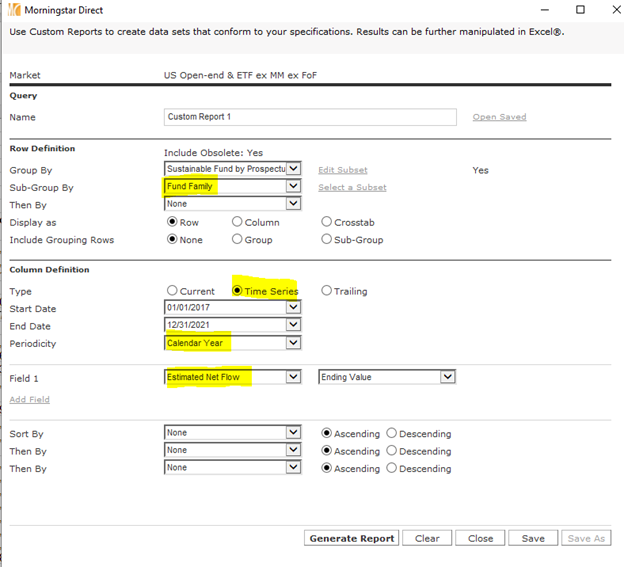
These parameters leave us with U.S. open-end funds and ETFs that label themselves as sustainable funds. To find the fund families with the most sustainable fund flows, select Fund Family under Sub-Group By. In the Column Definition box, select a time frame to analyze. Here, we will use a time series for the calendar years 2017 to 2021. In the Field 1 dropdown, select Estimated Net Flow. Finally, we can presort the data output by different quantitative or qualitative metrics. Here, sort the estimated net flows in descending order. The final custom report dialog box should look like this:
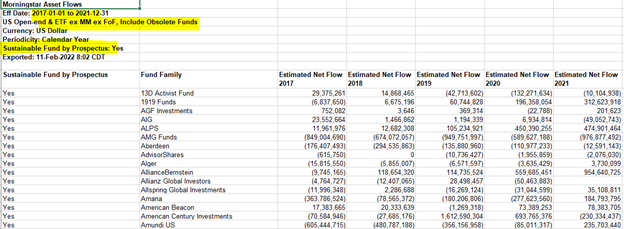
To export the data, go to Generate Report, which should open an Excel spreadsheet that shows the estimated new flows of sustainable funds by calendar year. The data shows that Parnassus took in the most flows in 2017 with just over $1.4 billion inflows.
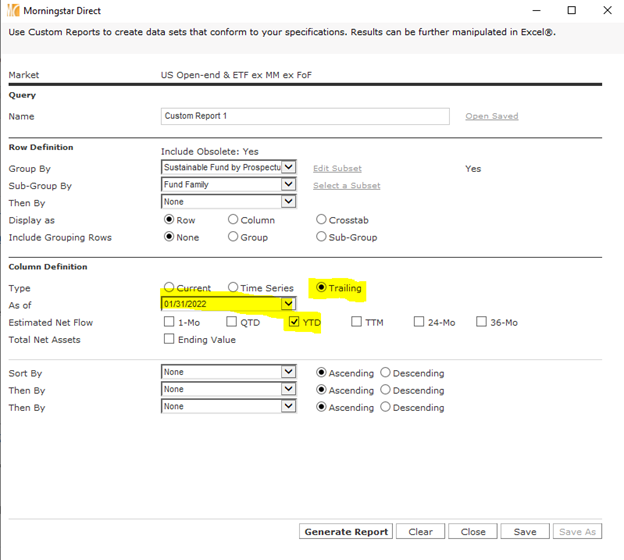
To add the 2022 year-to-date flows, simply go back to the search and change the Type under Column Definition to Trailing. From there, change the As of date to the most recent month-end and change the trailing period to be as of YTD. From there, the report will generate a year-to-date column, which you can add to the existing data.
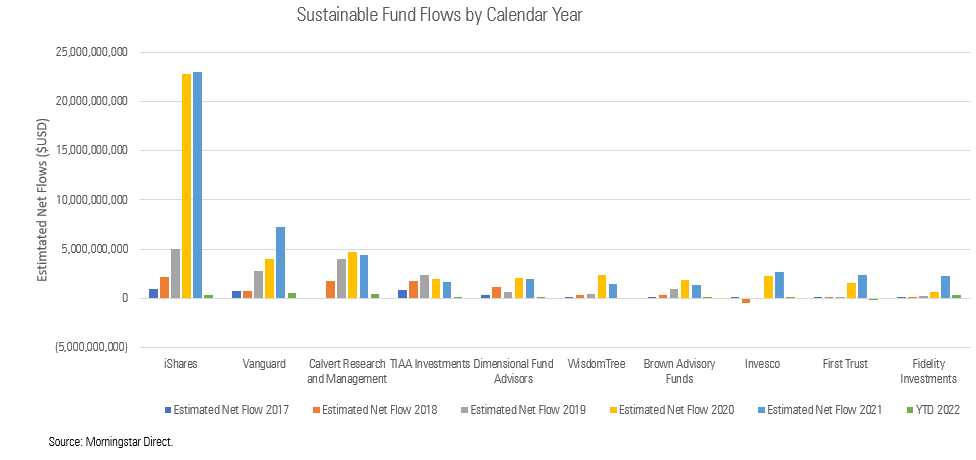
Once you add the year-to-date data, you can sum and sort the rows and columns to add up each family’s total flows since 2017 through January 2022. The results show iShares in the lead with more than $54.1 billion in sustainable fund flows since 2017, far more than second-place Vanguard.
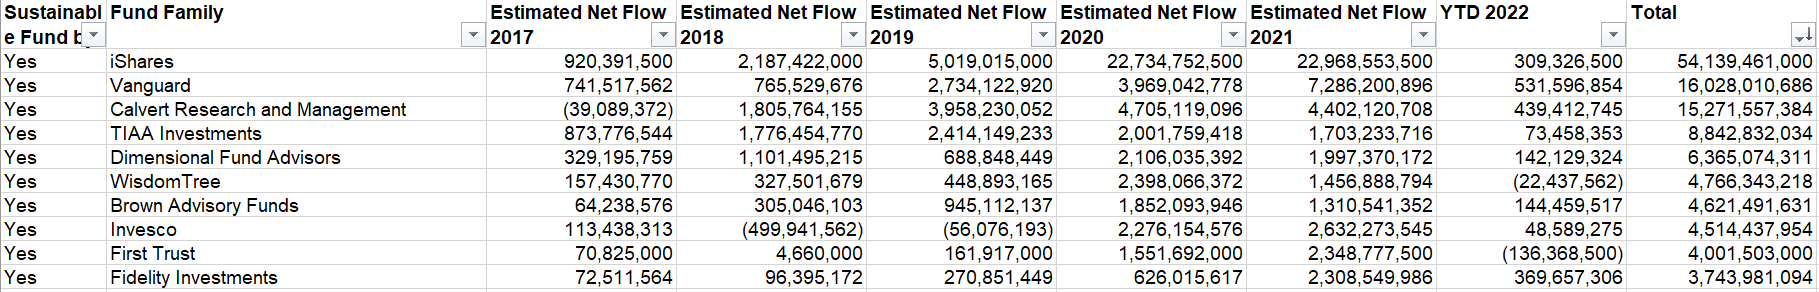
Users can then create a chart to visually display the data by year, such as a bar chart that breaks down flows by year. The chart below shows iShares, Vanguard, Invesco, and FirstTrust have started to garner more flows over the last two calendar years, while flows into TIAA and Xtrackers funds have fallen over the last five calendar years.
/cloudfront-us-east-1.images.arcpublishing.com/morningstar/T2LGZCEHBZBJJPPKHO7Y4EEKSM.png)
/d10o6nnig0wrdw.cloudfront.net/07-25-2024/t_56eea4e8bb7d4b4fab9986001d5da1b6_name_file_960x540_1600_v4_.jpg)
/cloudfront-us-east-1.images.arcpublishing.com/morningstar/BU6RVFENPMQF4EOJ6ONIPW5W5Q.png)
:quality(80)/s3.amazonaws.com/arc-authors/morningstar/ac242d77-42e4-4165-951a-b300b089a834.jpg)