
Reading the Fine Print of Mid-Cap ETFs
A look under the hood of the indexes underpinning some of our highly rated mid-cap ETFs.
/s3.amazonaws.com/arc-authors/morningstar/ab0b7979-59e4-461f-be92-19c328d94d6f.jpg)

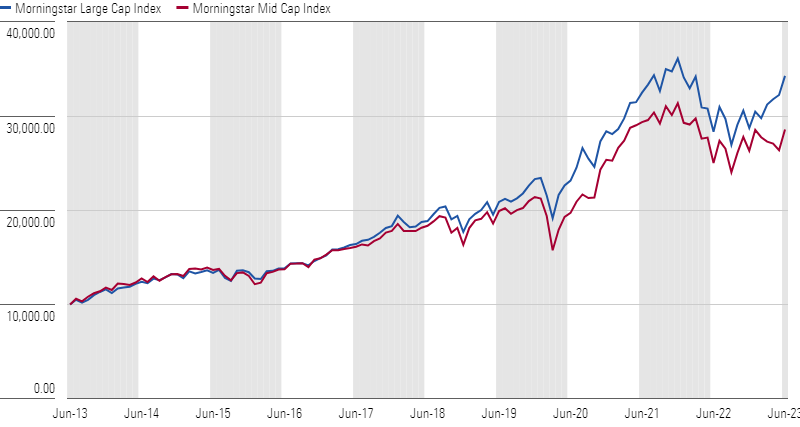
After besting large-cap stocks in the early 2000s, mid-cap stocks’ returns stagnated over the past decade. Morningstar US Mid Cap Index lagged the Morningstar US Large Cap Index by 2.97 percentage points annualized over the 10 years through June 2023. Consequently, investor attention shifted away from mid-cap stocks, and mid-cap funds hemorrhaged $106 billion in estimated net outflows over the past five years. It might seem easy to conceptualize what a typical, index-tracking mid-cap fund looks like. But index providers do not have a uniform definition, warranting more attention and scrutiny from investors before selecting a mid-cap fund. This article looks under the hood of the indexes underpinning some of our highest-rated mid-cap exchange-traded funds to better understand their performance patterns.
The Growth of Morningstar Large Cap Index vs. Morningstar Mid Cap Index
Drawing the Borders
Mid-cap stocks can take a variety of shapes. Some are companies with established business models and sound financials but are not industry leaders. Others are less established but carry high growth prospects that tend to come with volatile performance.
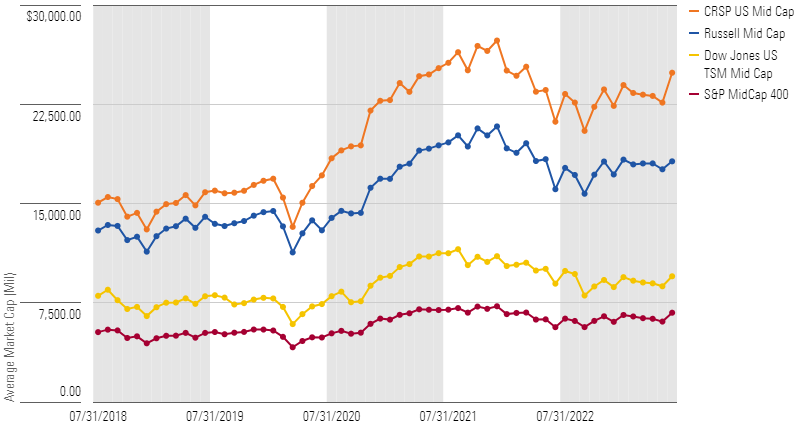
Although this description is intuitive, practitioners and index providers such as Dow Jones, CRSP, S&P, and Russell disagree on what constitutes the middle class of public companies. For example, the CRSP U.S. Mid Cap Index, which underpins the Vanguard Mid-Cap ETF VO, targets those between the 70th and 85th percentile of the total U.S. market capitalization, which ultimate leads it to hold more large-cap stocks than its peers. Count-based S&P MidCap 400 Index, which underpins both iShares Core S&P Mid-Cap ETF IJH and SPDR S&P Midcap 400 ETF Trust MDY, selects the 400 next-biggest stocks after the S&P 500. Similarly, the Dow Jones U.S. Total Stock Market Mid Cap Index, which the Schwab US Mid-Cap ETF SCHM tracks, and the Russell Midcap Index are count-based as well. The former selects stocks ranking from 401 to 1,100 by market cap, while the latter, which the iShares Russell Mid-Cap ETF IWR tracks, targets those between 201 and 1,000. The exhibit below highlights the resulting average market cap for each index.
Average Market Cap of Mid-Cap Indexes
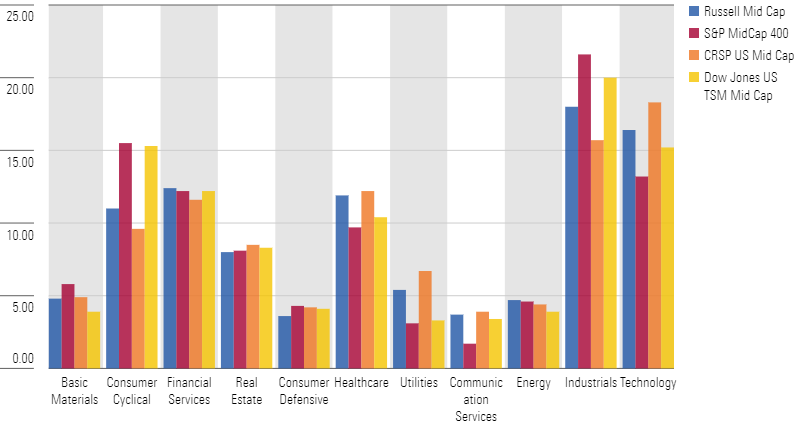
Deciding where to draw the lines along the market-cap ladder affects the resulting complexion of each index. For example, comparing CRSP U.S. Mid Cap Index—which reaches the furthest up the market-cap ladder—to the S&P MidCap 400 Index—which reaches the lowest along the market-cap spectrum—reveals sector tilts by virtue of their targeted market. The CRSP index allocates more than 5 percentage points more to technology stocks than the S&P index at the expense of holding 6 percentage points less in industrial stocks, as of June 2023.
Mid-Cap Indexes Sector Exposure
Furthermore, the indexes’ style, valuation, and moat profiles are affected by the providers’ definition of mid-cap. For example, the Russell Midcap Index and CRSP U.S. Mid Cap Index trade at richer valuations and hold more stocks with wide Morningstar Economic Moat Ratings than Dow Jones U.S. Total Stock Market Mid Cap Index and S&P MidCap 400.
Mid-Cap Indexes Characteristics
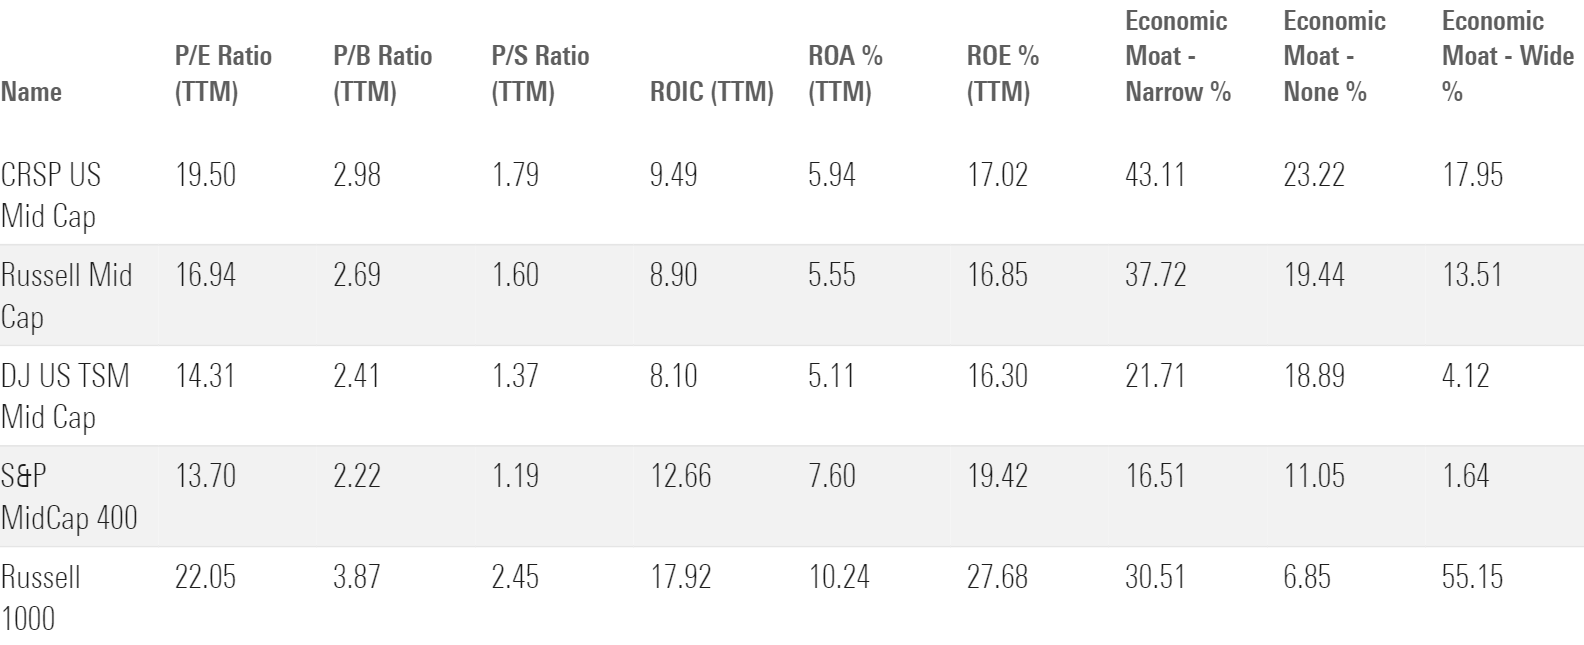
On the other hand, the S&P MidCap 400 Index presents a unique case. Despite holding a greater portion of smaller stocks with higher volatility, it screens out stocks that do not have positive net income using generally accepted accounting principles over the past four quarters, pushing its profitability (proxied by return on invested capital) higher than all other indexes. This limits exposure to unprofitable but fast-growing stocks, behaving like a value tilt, which can be an edge when value stocks outperform. The S&P MidCap 400 reaped the benefits of this screen when value stocks rebounded between late 2020 and the end of 2022. It outperformed the Russell Midcap Index by 3.47 percentage points annualized over that time.
Differences Wash Out
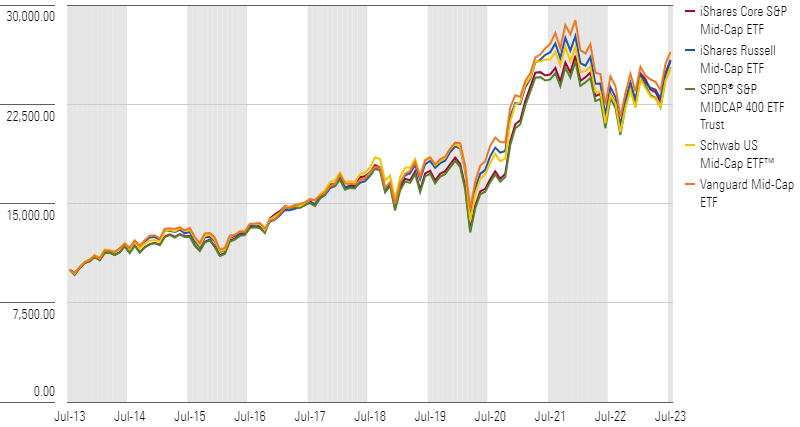
Despite the subtle variance in construction philosophies, the differences tend to wash out over the long run. Aided by low turnover, buffers on the lower bound, and market-cap weighting, the indexes have performed similarly over the past 10 years through June 2023. The largest return difference between them is only half a percentage point annualized.
Growth of Mid-Cap ETFs
Broad Diversification Benefits
Despite their size differences, these indexes do a stellar job constructing broadly diversified, market-cap-weighted portfolios that limit turnover and stock-specific risk. These qualities make for worthwhile options for investors looking for mid-cap exposure.
Market-cap weighting harnesses the market’s collective wisdom on the relative value of each stock, limiting turnover and the associated transaction costs. These index providers also implement buffers to limit deletions and additions along the lower market-cap bound, further reducing turnover. Funds tracking such indexes have an average turnover of only 15% over the past 10 calendar years, which was 52 percentage points lower than their average category peer. The top 10 holdings of these indexes hovered between 4% and 8.5%, compared with the Russell 1000 Index’s 22% and 27%, reducing the impact of concentration risk on performance.
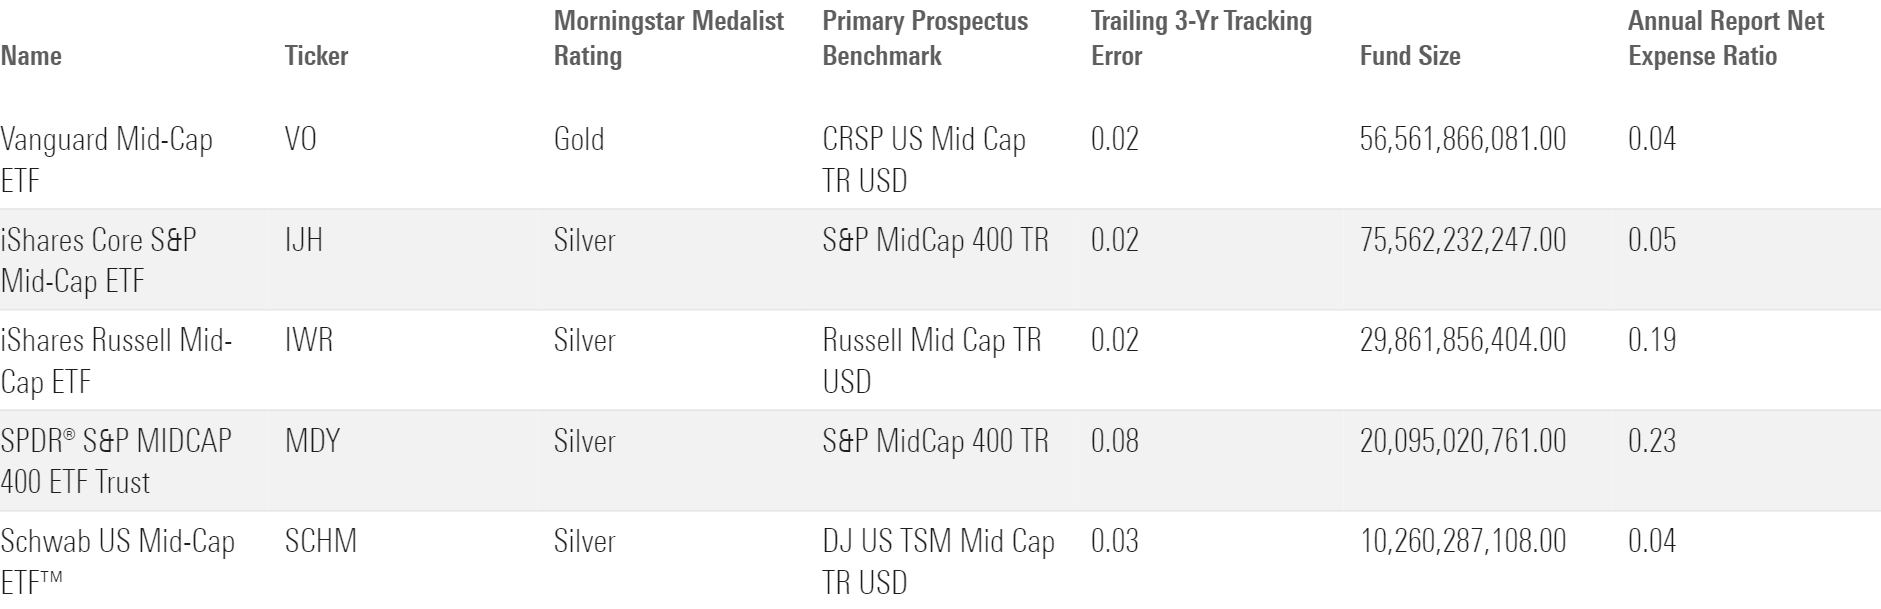
Funds tracking these mid-cap indexes merit a High Process Pillar rating, reflecting our confidence in the indexes’ qualities and ability to provide accurate exposure to mid-cap stocks. Below are our favorite mid-cap ETFs.
Top-Rated Mid-Cap ETFs
The author or authors do not own shares in any securities mentioned in this article. Find out about Morningstar’s editorial policies.
/cloudfront-us-east-1.images.arcpublishing.com/morningstar/24UPFK5OBNANLM2B55TIWIK2S4.png)
/d10o6nnig0wrdw.cloudfront.net/04-25-2024/t_29c382728cbc4bf2aaef646d1589a188_name_file_960x540_1600_v4_.jpg)
/cloudfront-us-east-1.images.arcpublishing.com/morningstar/T2LGZCEHBZBJJPPKHO7Y4EEKSM.png)
:quality(80)/s3.amazonaws.com/arc-authors/morningstar/ab0b7979-59e4-461f-be92-19c328d94d6f.jpg)