
Did Strategic-Beta Products Pass the Test?
Lackluster recent performance may accelerate the category’s maturation.
/s3.amazonaws.com/arc-authors/morningstar/a90ba90e-1da2-48a4-98bf-a476620dbff0.jpg)
After a decade-plus of strategic-beta exchange-traded products growing more rapidly than the broader ETP market, the space’s market-share gains have stalled. Strategic-beta ETPs’ growth was driven by new cash flows, new launches, the entrance of new players, and a roaring bull market, but more recently, this market segment has begun to show signs of maturity. New product launches have dwindled, closures have become more frequent, fees have come under pressure, and flows have slowed.
The coronavirus-driven sell-off earlier this year roiled markets, reinforcing important lessons about strategic-beta approaches to portfolio construction and teaching some new ones about how these products perform under stress.
Strategic beta is an active approach to building a portfolio. Strategic-beta ETPs' performance through recent market volatility underscores the fact that--like discretionary active portfolios--no two of them are created equal. These products' performance during the first half of 2020 revealed the differences between them and underscored the importance of thorough due diligence when selecting from the strategic-beta ETP menu.
After 2 Decades of Growth, the Strategic-Beta ETP Market Is Maturing The first generation of strategic-beta ETPs, launched in May 2000, introduced systematic style tilts to a market that was already well-versed in a style-based approach to equity investing. Two of the first funds in this space--iShares Russell 1000 Growth ETF IWF and iShares Russell 1000 Value ETF IWD--are presently still two of the five largest strategic-beta ETPs.
By the end of June 2020, as shown below, strategic-beta ETPs numbered 632 and had collective assets of $869.7 billion, representing roughly 20% of the $4.38 trillion invested in ETPs.
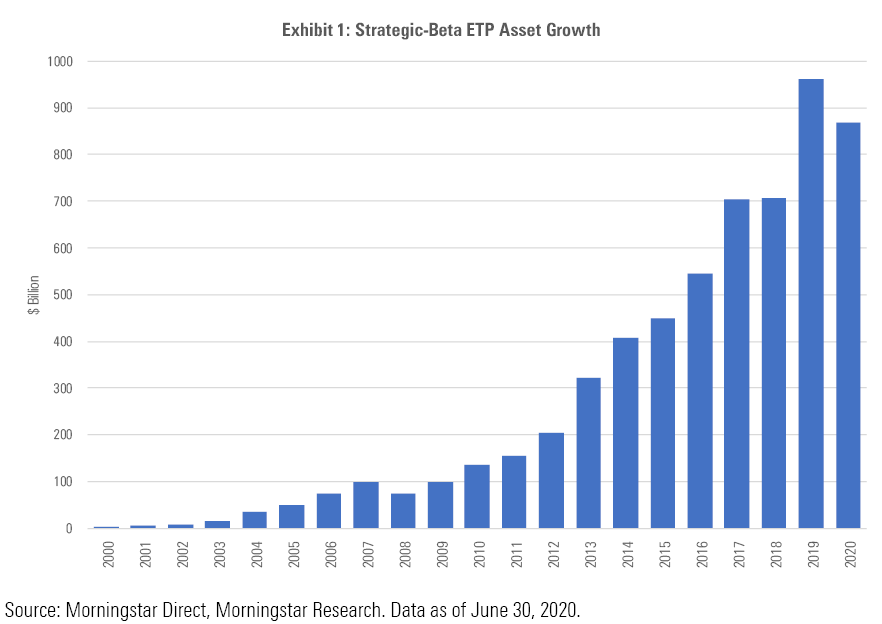
This swift growth has been driven primarily by new adopters across the investor spectrum, ranging from individuals to central banks. Approximately 72% of the aggregate growth in strategic-beta ETP assets over the past two decades has come from net new inflows; the remaining 28% reflects asset appreciation.
In many ways, the U.S. market was well primed for strategic beta. Consider that when the first strategic-beta ETPs were launched in 2000:
- The Morningstar Style Box had popularized the concept of style investing among U.S. investors.
- Exchange-traded funds had been around for about seven years, though they were still novel to many investors and being used predominantly as trading vehicles.
- Vanguard had introduced its first value and growth index mutual funds in 1992.
- Within the advisor space, there were pockets of familiarity with factors, owing in part to a rapidly growing and loyal army of Dimensional Fund Advisors converts who were well-versed in size and value.
What's Behind the Maturation of Strategic-Beta ETPs? However, in recent years, the strategic-beta market has been showing signs that it is maturing. New launches have slowed, closures have spiked, fees have come under pressure, and--in 2020--flows have floundered.
Strategic-beta ETP launches boomed in the years following the global financial crisis, with 587 strategic-beta ETPs coming to market between January 2010 and June 2020. That number represents 73% of the total dating back to May 2000.
As asset managers rushed to fill out their suite of factor ETFs, investors were overwhelmed with choice, and the market became oversaturated. In 2019, closings of strategic-beta ETPs outnumbered new launches for the first time. During the first half of 2020, there were more than 6 times as many strategic-beta ETPs pulled from the menu than there were new additions.
This crowded and competitive landscape has put pressure on fees. Among the 563 strategic-beta ETPs that reported annual report net expense ratios for their 2018 and 2019 fiscal years to Morningstar’s database:
- 120 (21%) saw their fees decrease during 2019. The median decline in fees among this group was 0.02%.
- 44 (8%) strategic-beta ETPs saw their fees inch higher, by a median level of 0.02%.
- The toll taken by the remaining 398 (71%) products remained unchanged.
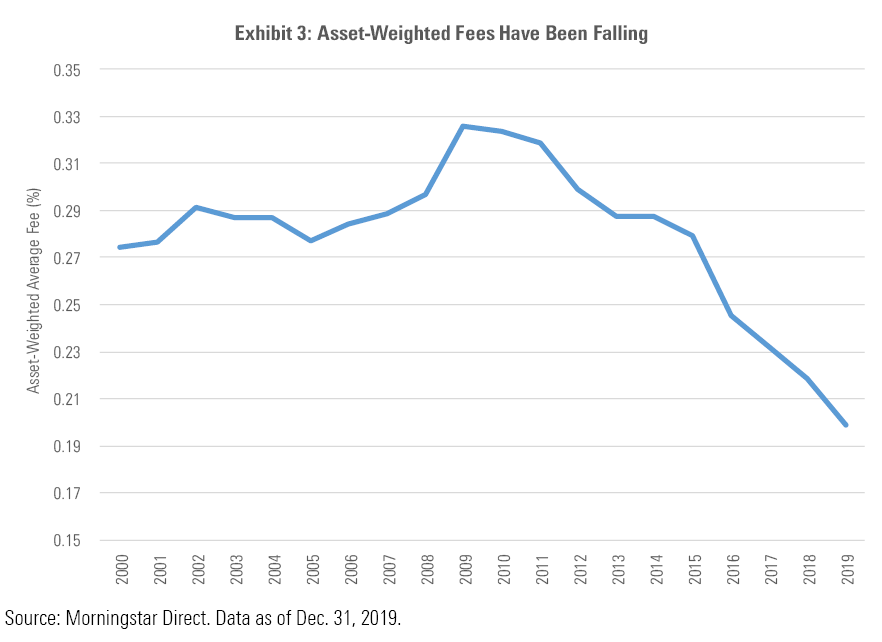
We expect that fees for strategic-beta ETPs will only continue to trend lower with time. We’ve already seen instances of proactive fee cuts: For instance, in 2019, Vanguard reduced fees for its S&P and Russell value and growth ETFs, and Alpha Architect pared fees for its focused single-factor funds. These most recent volleys are unlikely to be the last in a years-long fee fight.
And investors will continue to favor less expensive options. This preference is evidenced by the 39% decline in the asset-weighted average expense ratio among all strategic-beta ETPs from 2009 to 2019, as shown on the chart below.
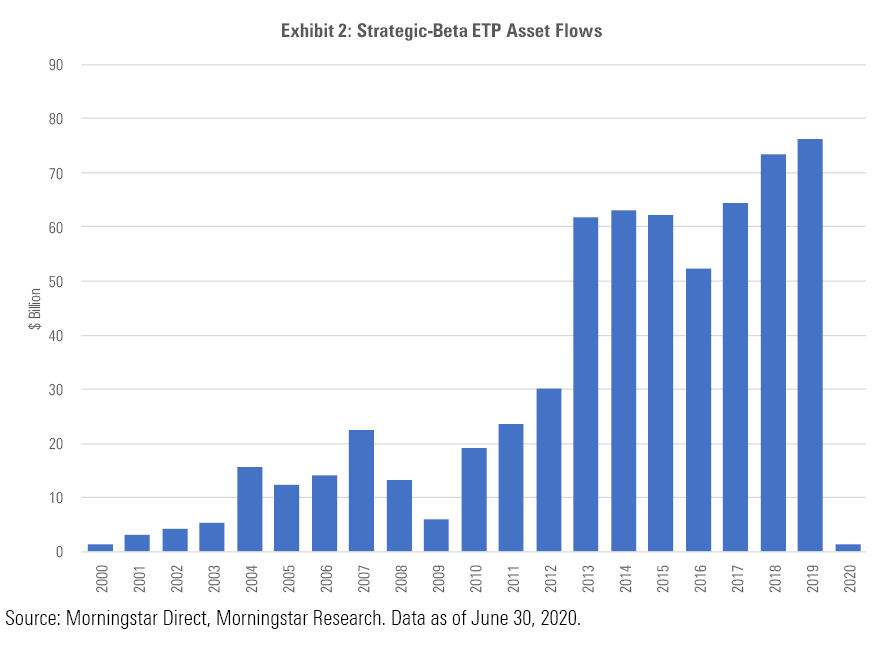
While strategic-beta ETPs witnessed record net inflows of $76.3 billion in 2019, the rate of growth in new flows has slowed as the category has expanded--as have its market-share gains. Thus far in 2020, flows have fizzled. Strategic-beta ETPs amassed a meager $1.4 billion in net new money through the first half of the year, representing a tiny fraction of the nearly $200 billion that’s flowed into all ETPs.
This can be partly attributed to the fact that flows have favored fixed-income ETFs and gold-backed ETPs, categories where strategic beta is either under-represented or not represented at all. It may also owe in part to the dismal recent performance of value relative to growth. ETPs belonging to the dividend, fundamentals, and multifactor Morningstar Strategic-Beta groups all shade toward value and many have lagged both the broader market and growth-leaning funds this year.
Another factor has been the exodus from low-volatility ETFs. These funds have been market darlings in recent years, netting $46.6 billion in new flows between 2016 and 2019. But in the first six months of 2020, investors have pulled $4.6 billion from them. This movement may be partly attributable to their mixed performance during the market drawdown earlier this year.
How Have Strategic-Beta ETPs Fared Through the Coronavirus Crisis? This year served up the first real test for many strategic-beta ETPs, given that the majority of them didn't enter the market until after the global financial crisis. Their performance during the first six months of the year has been generally poor.
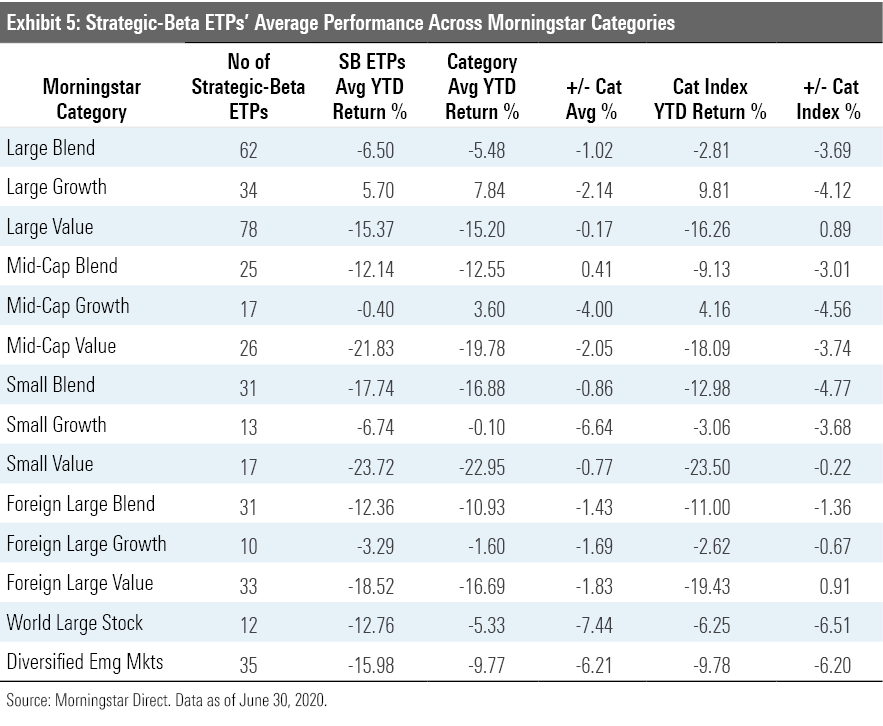
The chart below shows the year-to-date returns for the average strategic-beta ETP relative to both the average fund in their respective Morningstar Categories as well as their category indexes during the first half. In 11 of 14 categories, the average strategic-beta ETP underperformed both its average category peer and its category index. This isn’t a report card that will get hung on the refrigerator.
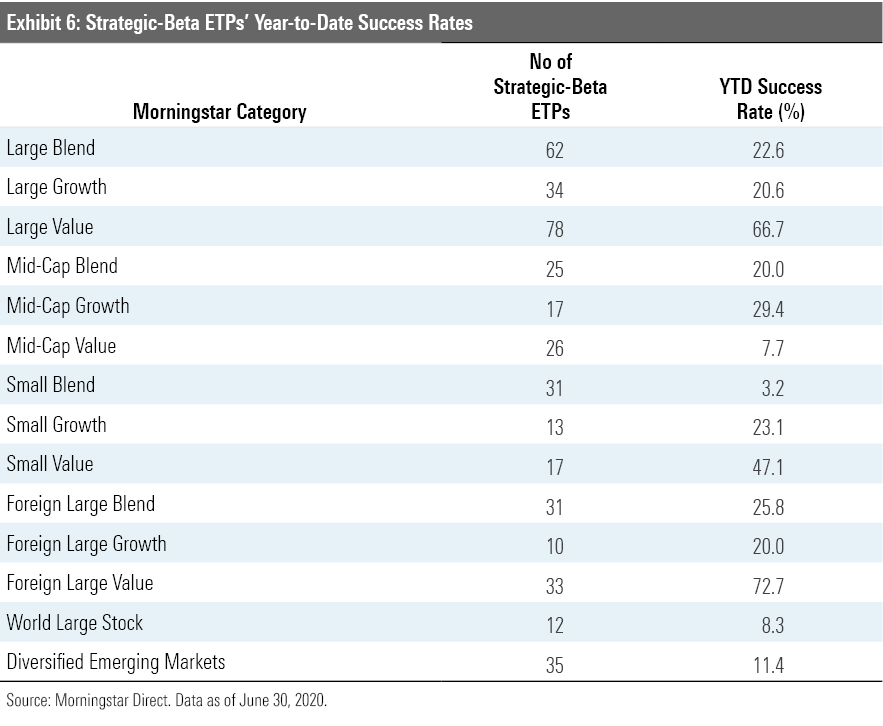
That said, not all strategic-beta ETPs fell short. The chart below shows the success rate among strategic-beta ETPs across those same categories, which measures products that outperformed their category index for the year to date through June.
The picture here is mixed. Just one strategic-beta ETP in the small-blend category beat its category bogy, while two thirds of the strategic-beta ETPs in the large-value category outperformed the category index. Given that these are in essence active strategies, they are subject to the same factors that influence active managers' success rates. In the case of the large-value category, the fact that value has been getting clobbered has worked to the benefit of many of the strategic-beta ETPs in the category, which tend to lean toward higher-quality names than the category index.
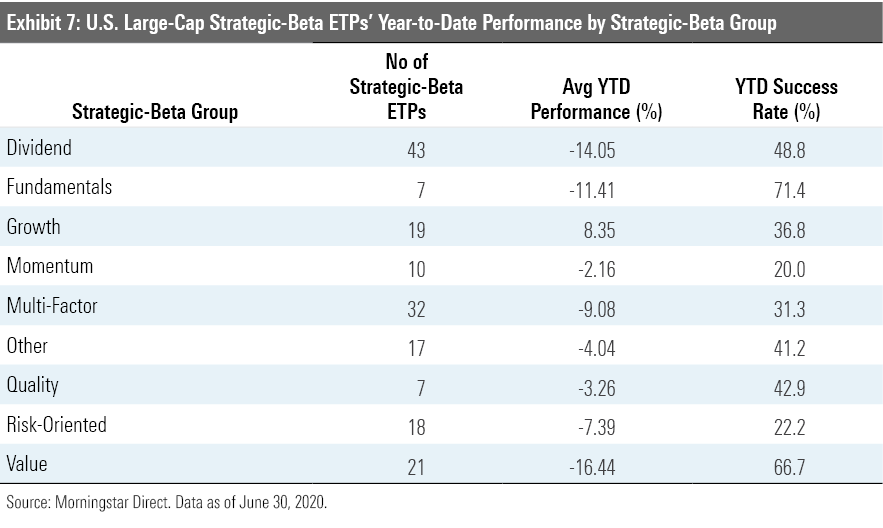
The chart below shows the average returns and success rates for strategic-beta ETPs in the large-value, large-blend, and large-growth categories sorted by their respective strategic-beta groups. Through this lens, ETPs belonging to the fundamentals and value groups performed relatively well versus their category indexes, while those in the momentum and low-volatility (which dominate the risk-oriented group) camps generally lagged.
This is another case in which the bar was relatively lower for the value-leaning strategies (including fundamentally weighted indexes, which tend to tilt toward cheaper stocks) and relatively higher for those investing in "growthier" fare.
Doing the Diligence of Evaluating Strategic-Beta ETPs These statistics belie just how diverse a set of strategies can be encompassed by some of these groupings. For example, the chart below shows the distribution of year-to-date returns for large-cap equity ETPs in the dividend strategic-beta group. The spread of returns across these strategies, which are often labeled similarly and draw from similar pools of stocks, shows just how important it is to vet them before investing.
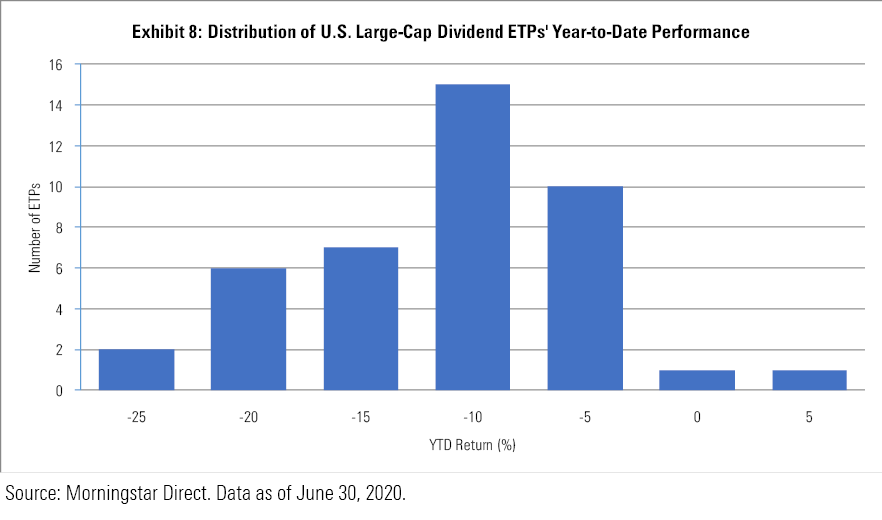
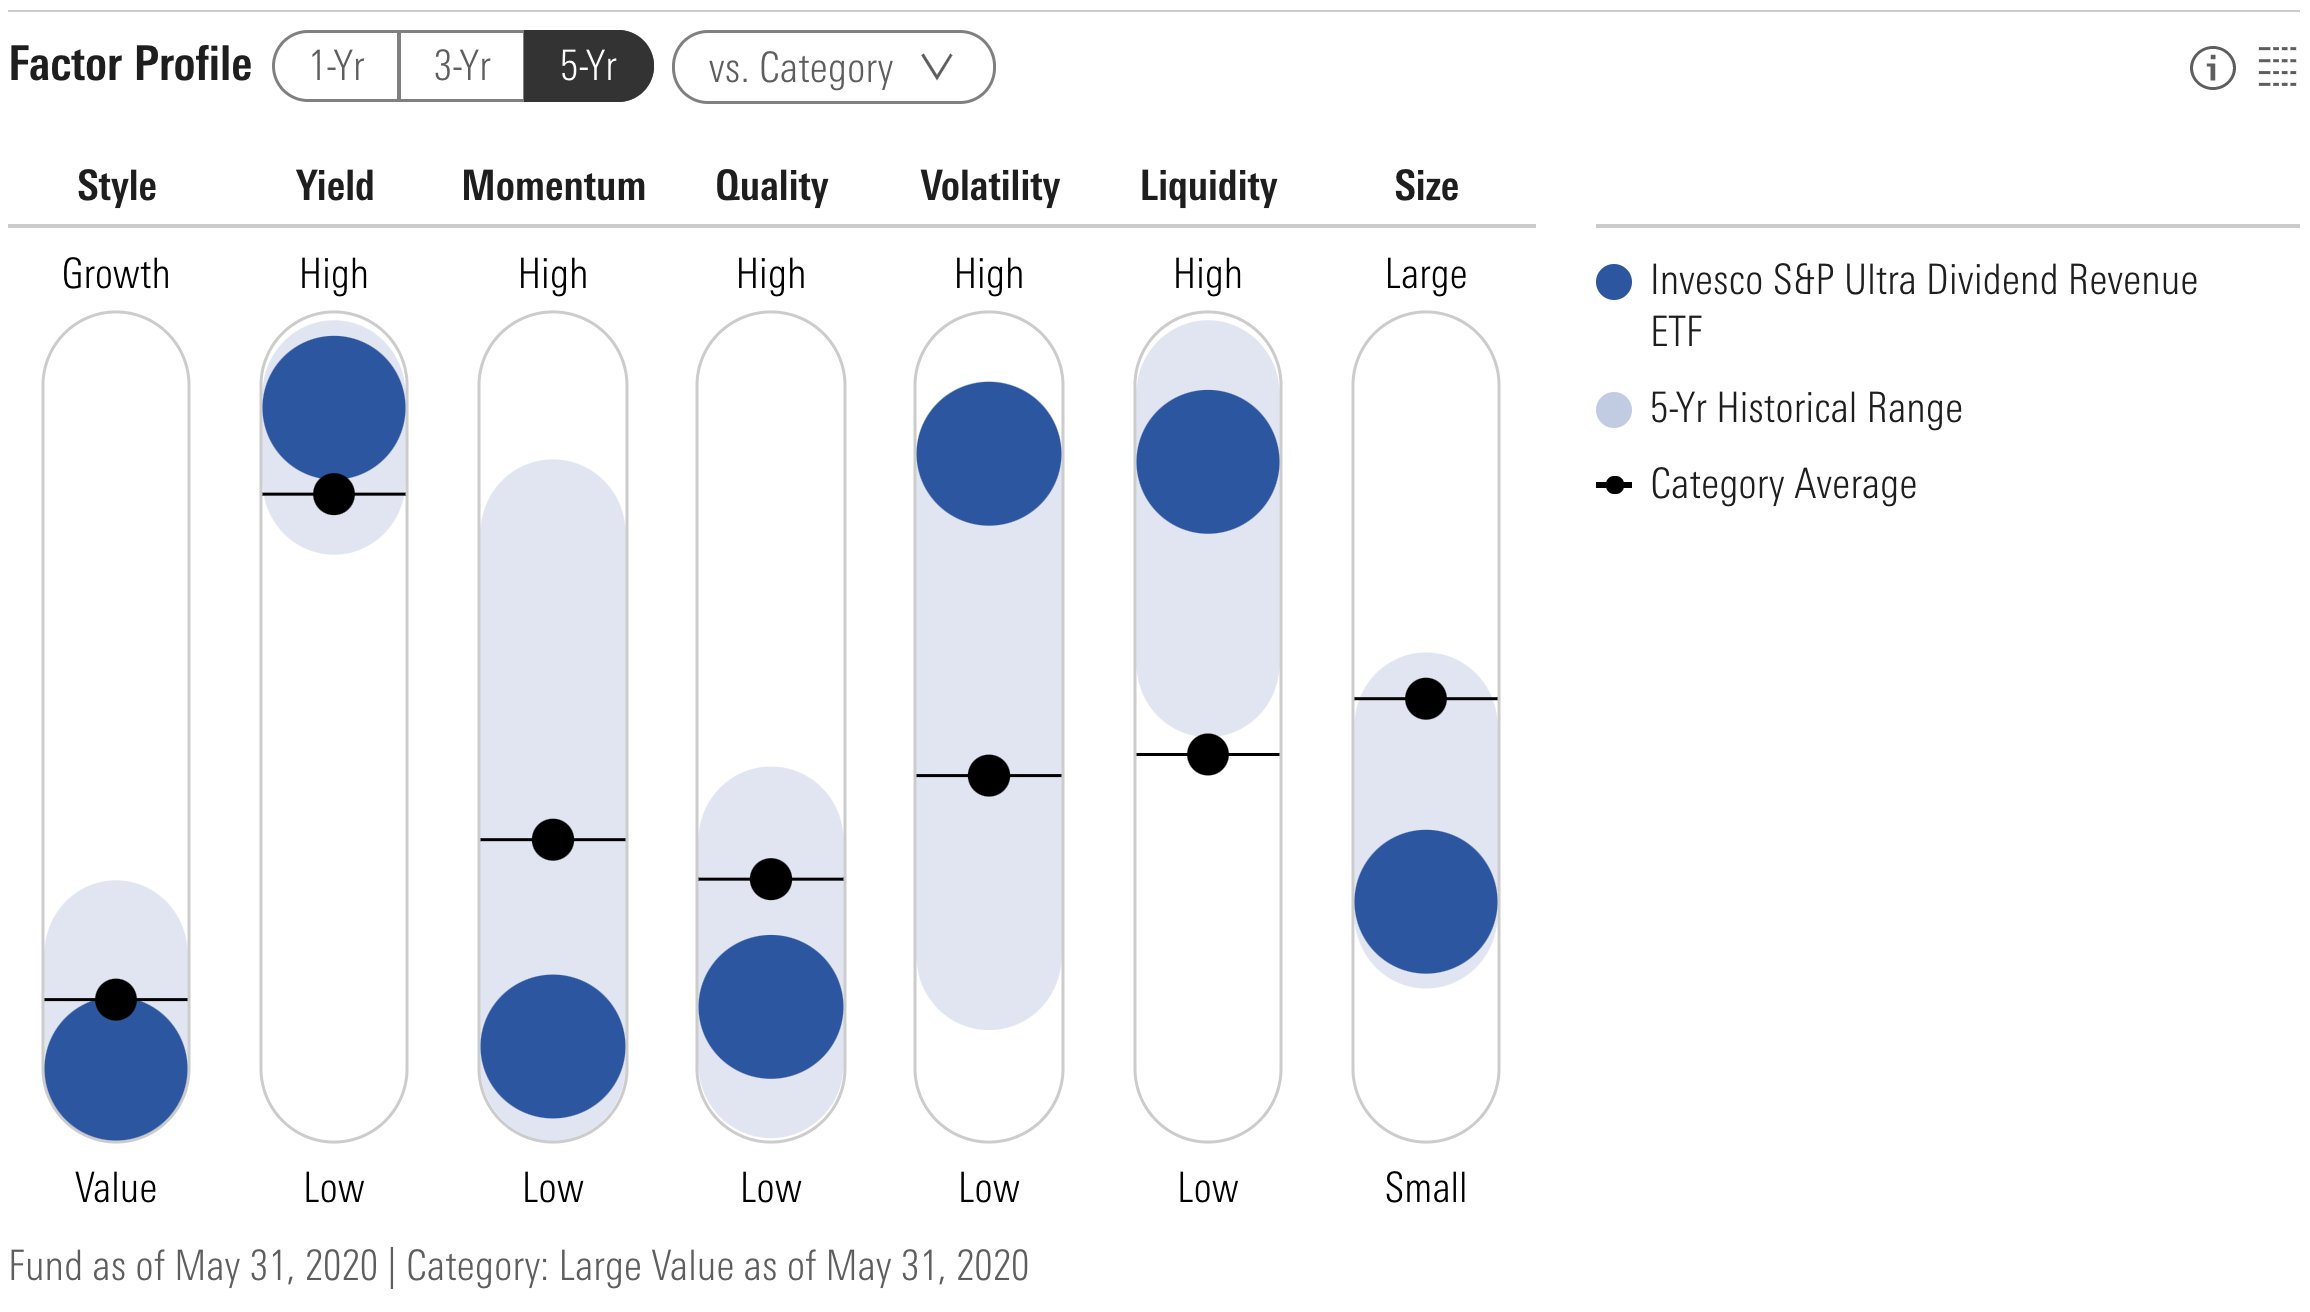
The extremes can be instructive. Consider the difference between Invesco S&P Ultra Dividend Revenue ETF RDIV, which fell nearly 29% in the first six months of the year, and DIVCON Leaders Dividend ETF LEAD, which gained almost 4% for the year to date through June.
RDIV draws stocks from the S&P 900, which is a mashup of the large-cap-focused S&P 500 and the S&P Midcap 400 Index. After screening out the top 5% of stocks by dividend yield and the top 5% within each sector with the highest payout ratios, it picks the 60 remaining stocks with the highest dividend yields and weights them based on their revenue. Single-stock exposure is capped at 5%, and there are no sector constraints. The result is a portfolio with a deep-value orientation that loads up on smaller, more volatile, lower-quality stocks.
This comes through loud and clear in the fund's Morningstar Factor Profile, illustrated below, and goes a long way toward explaining its dismal performance during a period when small-value has lagged by some of the widest margins on record.
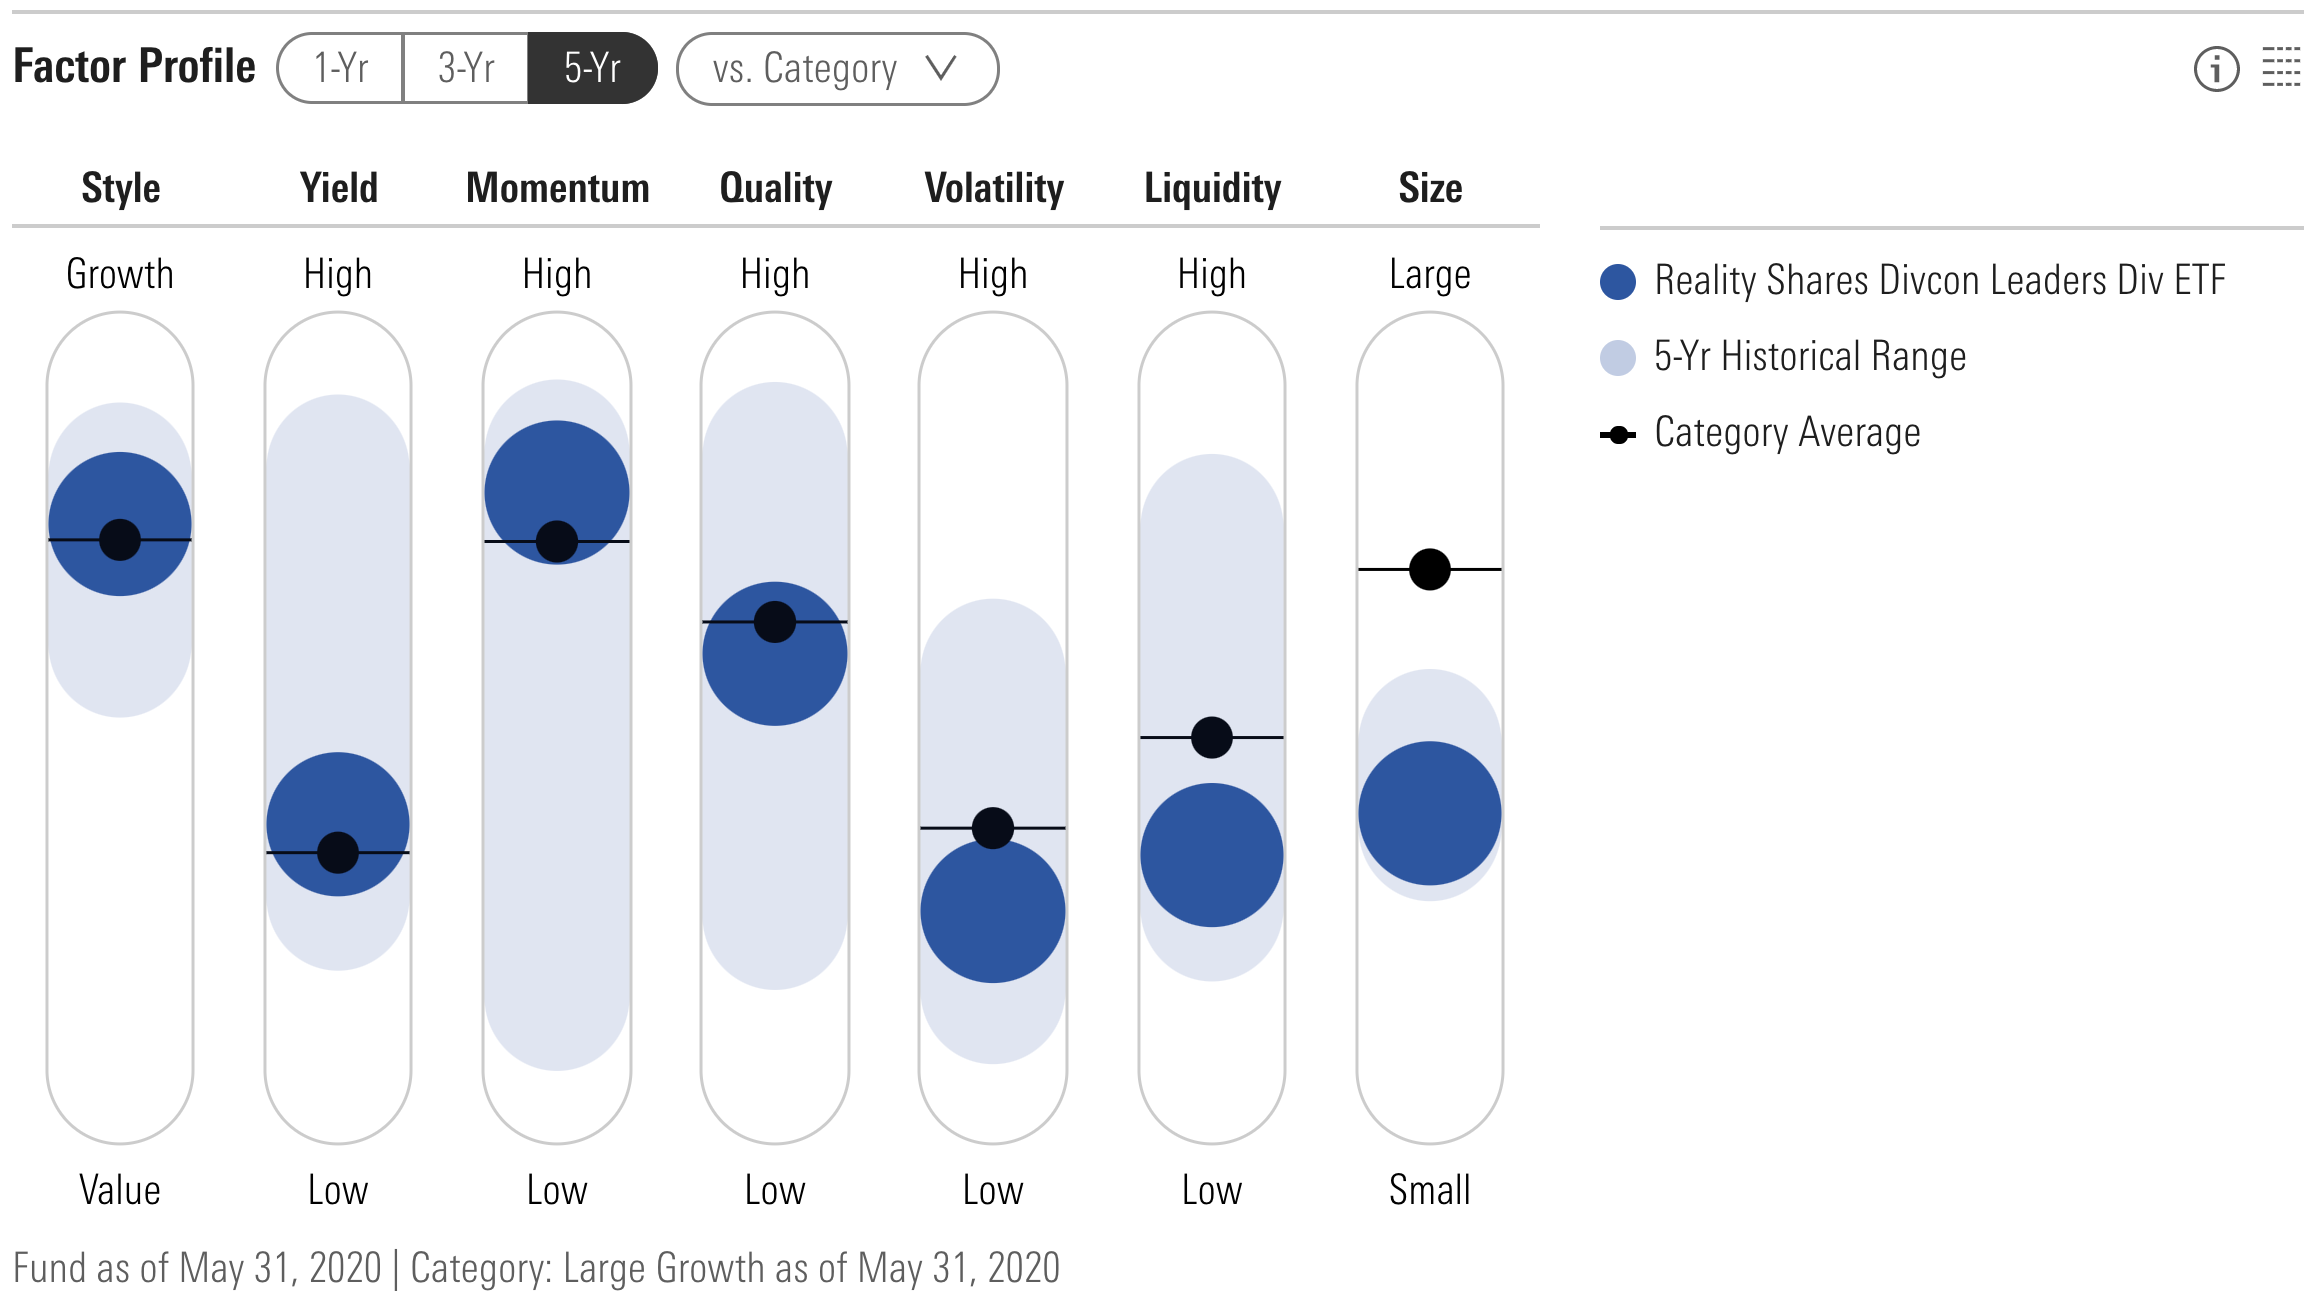
Conversely, while LEAD sits in the same strategic-beta group as RDIV and also favors large caps, the fund draws from the S&P 500, so it tends to own larger stocks than RDIV. It uses proprietary criteria to select those S&P 500 stocks that are most likely to increase their dividends in the next 12 months. It also weights them using these same criteria, favoring those that are most likely to boost their payout.
A focus on prospective dividend growth versus current yield results in a portfolio with characteristics that are nearly a mirror image of RDIV’s. As shown below in the fund’s Morningstar Factor Profile, LEAD has a growth orientation and tilts toward higher-quality, less volatile names. Its emphasis on dividend growth also means its current yield is lower relative to yield-centric RDIV.
Learnings From the Year's Test on Strategic-Beta ETPs The menu of strategic-beta ETPs has expanded in recent years, offering investors some compelling alternatives to more traditional actively managed funds.
But, as with discretionary active managers, the only guarantee is that investors will get something different from owning a broad market-cap-weighted index fund--not necessarily something better or worse. And, as is always the case, thorough due diligence is a must.
This blog post is adapted from research that was originally published in Morningstar Direct's Research Portal. If you're a user, you have access. If not, take a free trial.
/cloudfront-us-east-1.images.arcpublishing.com/morningstar/T2LGZCEHBZBJJPPKHO7Y4EEKSM.png)
/d10o6nnig0wrdw.cloudfront.net/07-25-2024/t_56eea4e8bb7d4b4fab9986001d5da1b6_name_file_960x540_1600_v4_.jpg)
/cloudfront-us-east-1.images.arcpublishing.com/morningstar/BU6RVFENPMQF4EOJ6ONIPW5W5Q.png)
:quality(80)/s3.amazonaws.com/arc-authors/morningstar/a90ba90e-1da2-48a4-98bf-a476620dbff0.jpg)