
Why Do Active Managers Do Better in Some Periods Than Others?
A new Morningstar study evaluates whether active managers' index-relative performance is driven by the returns to their investment style.
/s3.amazonaws.com/arc-authors/morningstar/56fe790f-bc99-4dfe-ac84-e187d7f817af.jpg)
/s3.amazonaws.com/arc-authors/morningstar/64dafa24-41b3-4a5e-aade-5d471358063f.jpg)
Morningstar's Active/Passive Barometer and other studies have demonstrated that most active managers have struggled to beat their index counterparts over the long term. But active managers have had greater success in some periods than others. A theory known as Dunn's Law suggests that this pattern can be explained by stylistic differences between active and index portfolios (1). The idea is that indexes tend to be more style pure than their active counterparts, so they should be more difficult to beat when the style they represent has strong relative performance. Conversely, they should be easier to beat when their style has weak relative performance.
We conducted a study to put Dunn's theory to the test, using data from the Morningstar Active/Passive Barometer for 12 Morningstar Categories. The study found:
- Dunn's Law has some merit, though the results didn't always align with the theory's predictions.
- Although the relationships we examined didn't always match the predictions of Dunn's Law, the returns to various investment styles and risk factors explained much of the variation in the success rates observed from September 2002 through December 2017.
- Active managers' success rates are noisy and tough to predict. Attempting to time exposure between index and active managers is akin to timing just about anything else in the market and not advisable.
The full study is available here.
Research Design This study starts with the results of Morningstar's Active/Passive Barometer, which compares the performance of active managers against actual index funds in 12 Morningstar Categories.
The Active/Passive Barometer defines success rates as the percentage of active managers in each category that both survived and outperformed a composite of all index mutual funds and index-tracking exchange-traded funds in their category over a given period. Success rates tend to be more volatile over shorter horizons, so we focused this analysis on the quarterly rolling one-, three-, and five-year success rates from September 2002 through December 2017.
We built a regression model to explain the variation in active managers' success rates within each category over time. For the nine U.S. equity categories, the explanatory variables in the model included the returns to market risk, small size, value, and international relative to U.S. stocks. We calculated each of these explanatory variables (or factors) using index return spreads.
We set up similar regression models for the foreign large-blend and diversified emerging-markets categories, using region-specific indexes to construct the explanatory factors. Similar to the U.S. model, we included market risk, small size, and value factors in these regressions. To capture potential differences in geographic exposure between active and index funds, we added a U.S. and emerging-markets factor to the foreign large-blend model, and a developed-markets factor to the model for diversified emerging-markets funds. We also added a currency risk factor to both models.
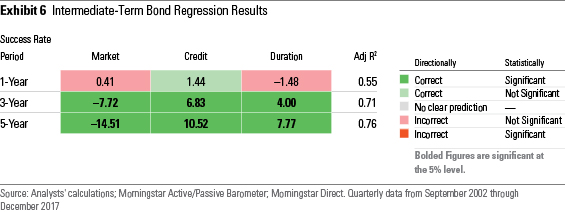
The model for the intermediate-term bond category included market, credit, and interest-rate risk factors.
These regression models measure how closely the variation in active managers' success rates is linked to the payoff of potential style differences between active and index managers. For example, if active managers in the large-value category have greater exposure to mid-cap value stocks than their index peers, their success rates should improve when smaller stocks beat larger stocks. The regression would detect that relationship.
However, these models don't capture every way in which active funds differ from their index peers. For example, they ignore differences in security selection and sector exposure unrelated to the factors, which may limit the models' explanatory power.
Predictions With this caveat in mind, the models allow us to test the predictions of Dunn's Law. If Dunn's Law is accurate:
- The success rates in all categories should be negatively related to the performance of the market. This is because index funds are always fully invested, while active managers tend to carry larger cash balances. So, it should be harder for active managers to beat their index peers during strong rallies, and less difficult during downturns.
- The success rates in the value categories should be negatively related to the performance of the value factor, while this relationship should be positive in the growth categories. The rationale is that active value managers likely have greater exposure to growth stocks than their index counterparts, since they are less constrained. Similarly, active growth managers likely have greater exposure to value stocks than growth indexes.
- The success rates in the large-cap (and diversified emerging-markets) categories should be positively related to the performance of the small size factor, since many index funds are market-cap-weighted, pulling them toward the largest stocks. This relationship should be negative in the small-cap categories, since many active managers have the flexibility to venture further into mid-cap territory than their index peers.
- The success rates in all U.S. categories should be positively linked to the performance of international stocks, since many active managers have some exposure to these stocks, while their index counterparts generally do not.
Success rates in the intermediate-term bond category should be positively related to the payoff to:
- Credit risk, based on the expectation that active managers have tended to take greater credit risk than their index peers.
- Interest-rate risk, based on the idea that the average active manager took greater interest-rate risk than index funds over much of the sample period (though that is probably no longer the case).
Results The results of this analysis demonstrate that differences in investment style between active and index funds can help explain the variation in success rates. However, the data did not clearly follow all the predictions of Dunn's Law.
The nine U.S. equity categories offer a cleaner test of Dunn's Law than the two international-stock categories because the index funds in each category have specific style constraints and are likely more style pure than their active counterparts.
Exhibits 1-3 show the results of the regression analysis for the nine U.S. equity categories. The numbers in all but the last column are the regression coefficients. The bolded coefficients are statistically significant. The cells highlighted in dark green are statistically significant with the sign Dunn's Law predicts (that is, the direction of the relationship between the variable and success rates mirrors the prediction of Dunn's Law); those highlighted in light green have the right sign, but are not statistically significant. Cells highlighted in red have the wrong sign and are significant, while those highlighted in light red only have the wrong sign. There were no clear predictions from Dunn's Law for those cells that are not highlighted. The adjusted R-squared figures show the proportion of the variability in success rates that the regression explains.

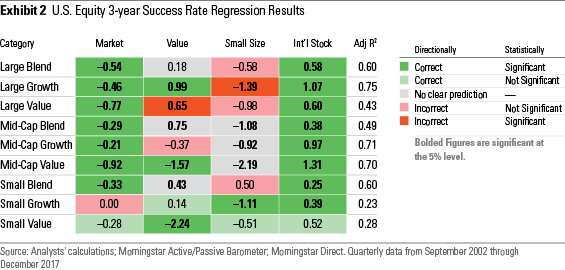
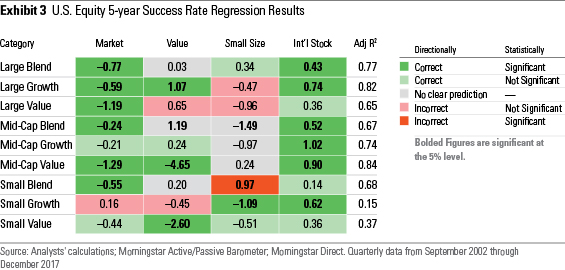
Overall, the model did a decent job explaining the three- and five-year success rates in most categories. It isn't surprising that the regressions had less explanatory power for the one-year success rates because there is more noise over shorter periods. As expected, there was a negative relationship between the performance of the market and active managers' success rates in every category except small growth. And all categories exhibited the expected positive relationship between success rates and the performance of international stocks relative to U.S. stocks.
However, the relationships between success rates and the value and small size factors didn't clearly fit the predictions of Dunn's Law. It's possible that our assumptions about how active managers differ from their index peers could be wrong. For example, active managers in the large-growth category could have a larger-cap orientation than their index peers, explaining why they might benefit from weaker performance among small-cap stocks. The size and value factors in the regressions could also be picking up other risk exposures that active managers might have.
But the best explanation for why there isn't a clean inverse relationship between the returns to active managers' investment style and their success rates is that these success rates are noisy. Changes in success rates are partially random and influenced by many variables the model does not capture. While it's possible that some periods may be more conducive to stock-picking than others, stock-picking success across managers is not highly correlated, so success rates are partially driven by luck of the draw.
The regression results for the foreign large-blend and diversified emerging-markets categories are shown in Exhibits 4 and 5. They were less supportive of Dunn's Law than the results for the U.S. equity categories, but they demonstrate that style differences between active and passive funds influence success rates.
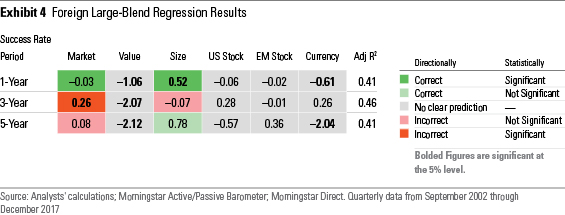
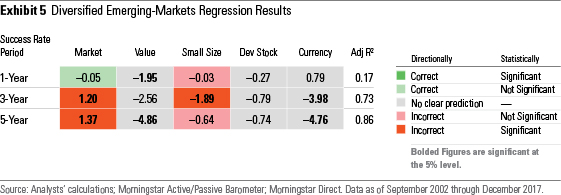
Exhibit 6 shows the regression results for the intermediate-term bond category, which offer strong support for Dunn's Law, particularly over the three- and five-year windows.
Conclusion The results of this study suggest there is some truth to Dunn's Law, but it doesn't always hold. Even though they don't always conform to the predictions of Dunn's Law, differences in investment style between active and index funds can explain much of the variation in success rates over time. But just as it is difficult to predict when the market will do well, it is difficult to predict when certain investment styles will be in favor. So, it's best to accept that active managers' success rates will be volatile and not try to time exposure between active and passive funds.
1) Bernstein, W. 1999. "When Indexing Fails." 1999. Efficient Frontier. http://www.efficientfrontier.com/ef/499/indexing.htm

Disclosure: Morningstar, Inc. licenses indexes to financial institutions as the tracking indexes for investable products, such as exchange-traded funds, sponsored by the financial institution. The license fee for such use is paid by the sponsoring financial institution based mainly on the total assets of the investable product. Please click here for a list of investable products that track or have tracked a Morningstar index. Neither Morningstar, Inc. nor its investment management division markets, sells, or makes any representations regarding the advisability of investing in any investable product that tracks a Morningstar index.
/cloudfront-us-east-1.images.arcpublishing.com/morningstar/T2LGZCEHBZBJJPPKHO7Y4EEKSM.png)
/d10o6nnig0wrdw.cloudfront.net/04-18-2024/t_34ccafe52c7c46979f1073e515ef92d4_name_file_960x540_1600_v4_.jpg)
/d10o6nnig0wrdw.cloudfront.net/04-09-2024/t_e87d9a06e6904d6f97765a0784117913_name_file_960x540_1600_v4_.jpg)
:quality(80)/s3.amazonaws.com/arc-authors/morningstar/56fe790f-bc99-4dfe-ac84-e187d7f817af.jpg)
:quality(80)/s3.amazonaws.com/arc-authors/morningstar/64dafa24-41b3-4a5e-aade-5d471358063f.jpg)