Skip to Content

5 min read

US Fund Flows: June Bond Inflows Hit Four-year High as US Equities Face Sharp Outflows

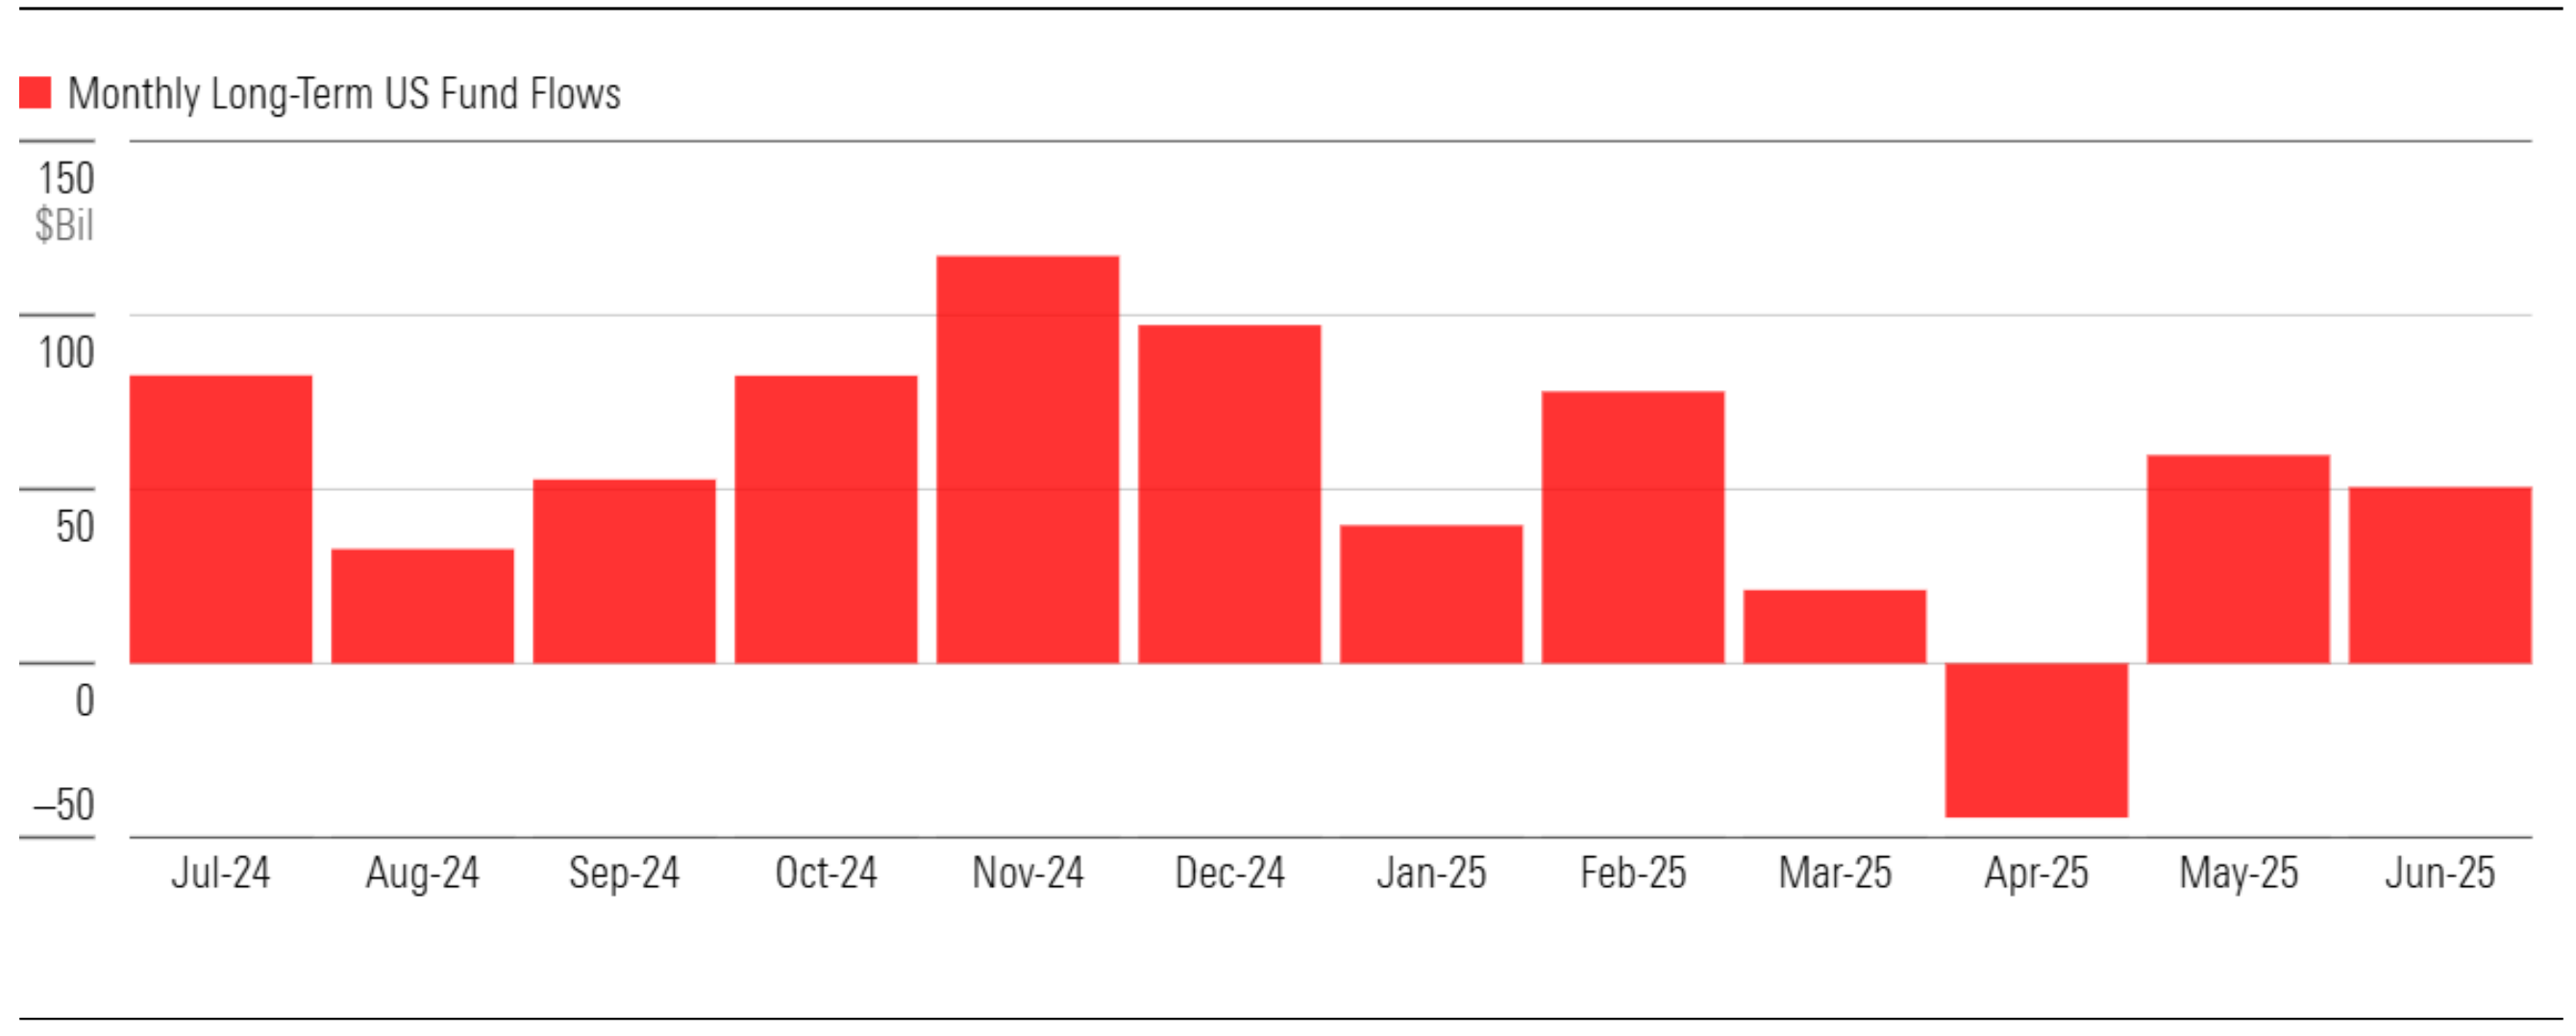
Investors added $50 billion to long-term funds, led by taxable bonds, while US equity funds saw their steepest outflows in over three years despite the market rally.

Key Takeaways
  • Taxable-bond funds collected $48.8 billion during the month. Intermediate core bond funds led that growth with $19.7 billion in inflows, their largest monthly inflow since June 2021.

  • US equity funds shed nearly $36 billion in June, marking their worst monthly outflow in over three years as all of the equity Morningstar Categories suffered net redemptions. On the other hand, international-equity funds attracted over $15 billion for the month, building on May’s momentum and showing continued demand for global diversification.

  • Active ETFs brought in $29.4 billion in June, with $200 billion total for the first half of 2025 and a 53.5% organic growth rate despite a relative slowdown in the second quarter compared with the first.

As markets continued to rally in June, investors put about $50 billion to work in US open-end funds and ETFs. But not all asset classes benefited:

While bond funds generally saw inflows, US-stock fund flows suffered despite the continuing rally in US stocks that has pushed benchmark indexes like the S&P 500 and Nasdaq Composite to new record highs. Investors continued to add to precious-metals and digital-assets funds. Taxable-bond funds are the big winners, though, accounting for 92% of the $204 billion that has entered long-term mutual funds and ETFs so far this year.

The charts below illustrate which direction the money is flowing for a variety of fund types. For a more complete analysis, download the full monthly report from Morningstar’s Adam Sabban and Ryan Jackson. 

This data was sourced from Morningstar Direct. Not a user? Get a free trial of Direct

Source: Morningstar Direct Asset Flows. Data as of June 30, 2025.

Intermediate Core Bond Funds Achieve Their Highest Inflow in 4 Years
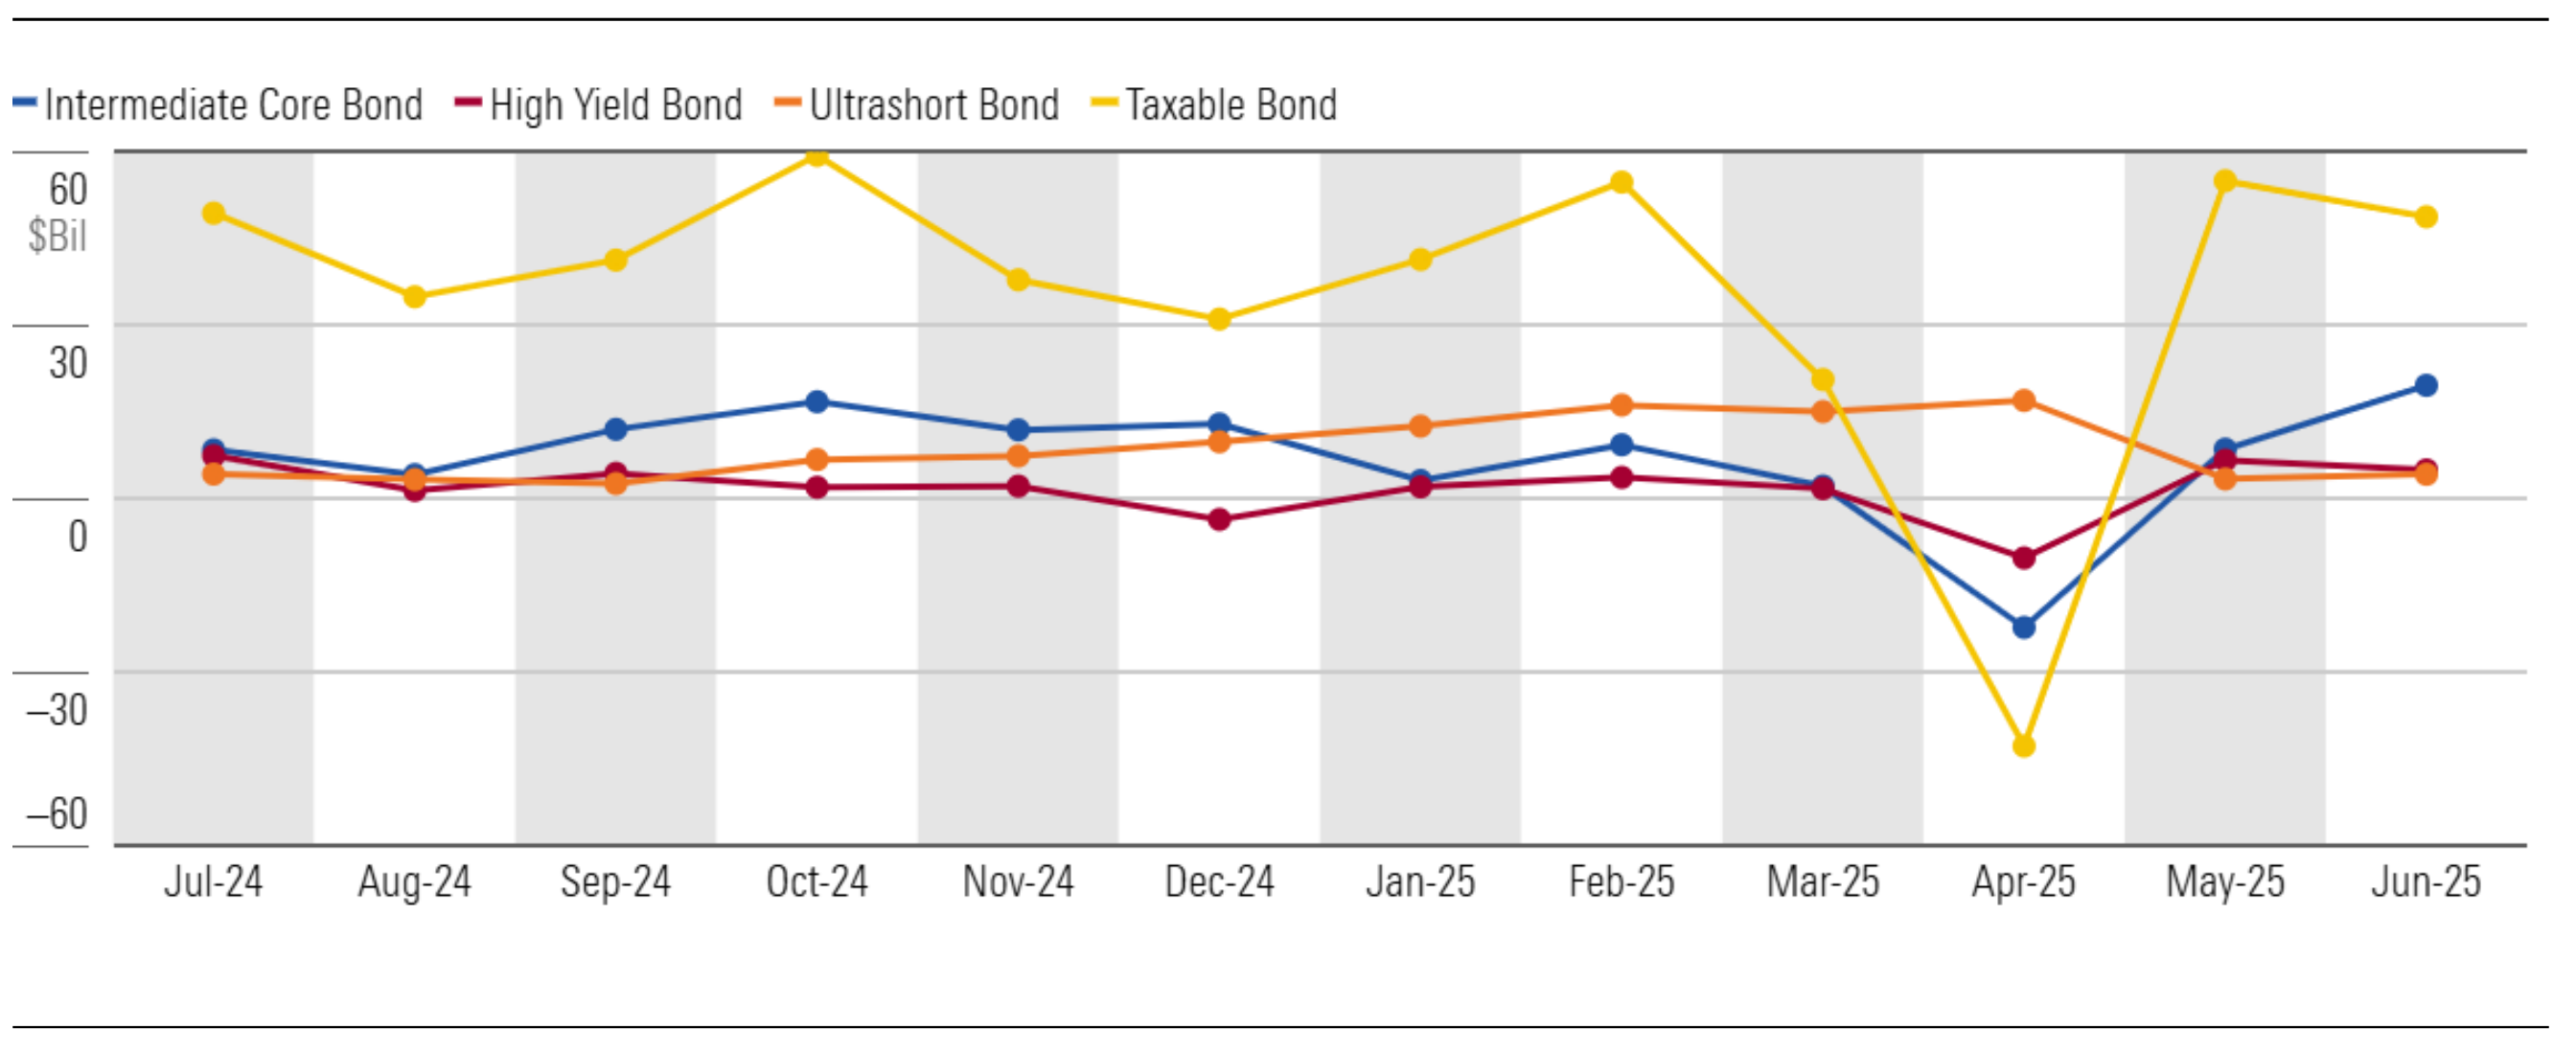
Bond funds gained $48.8 billion in June, with all but three of the 23 taxable-bond Morningstar Categories in the black. Intermediate core bond funds topped the list with $19.7 billion of inflows—the most since June 2021. At the bottom of the list were long-term bond and long government, which each saw about $1.3 billion in outflows during the month. Outflows have hit long-term bond funds in seven of the past eight months, and four of the past eight for long government, suggesting some investor wariness around inflation and deficit spending.

Source: Morningstar Direct Asset Flows. Data as of June 30, 2025.

All but Two US Equity Categories Lose Assets in 2025’s First Half
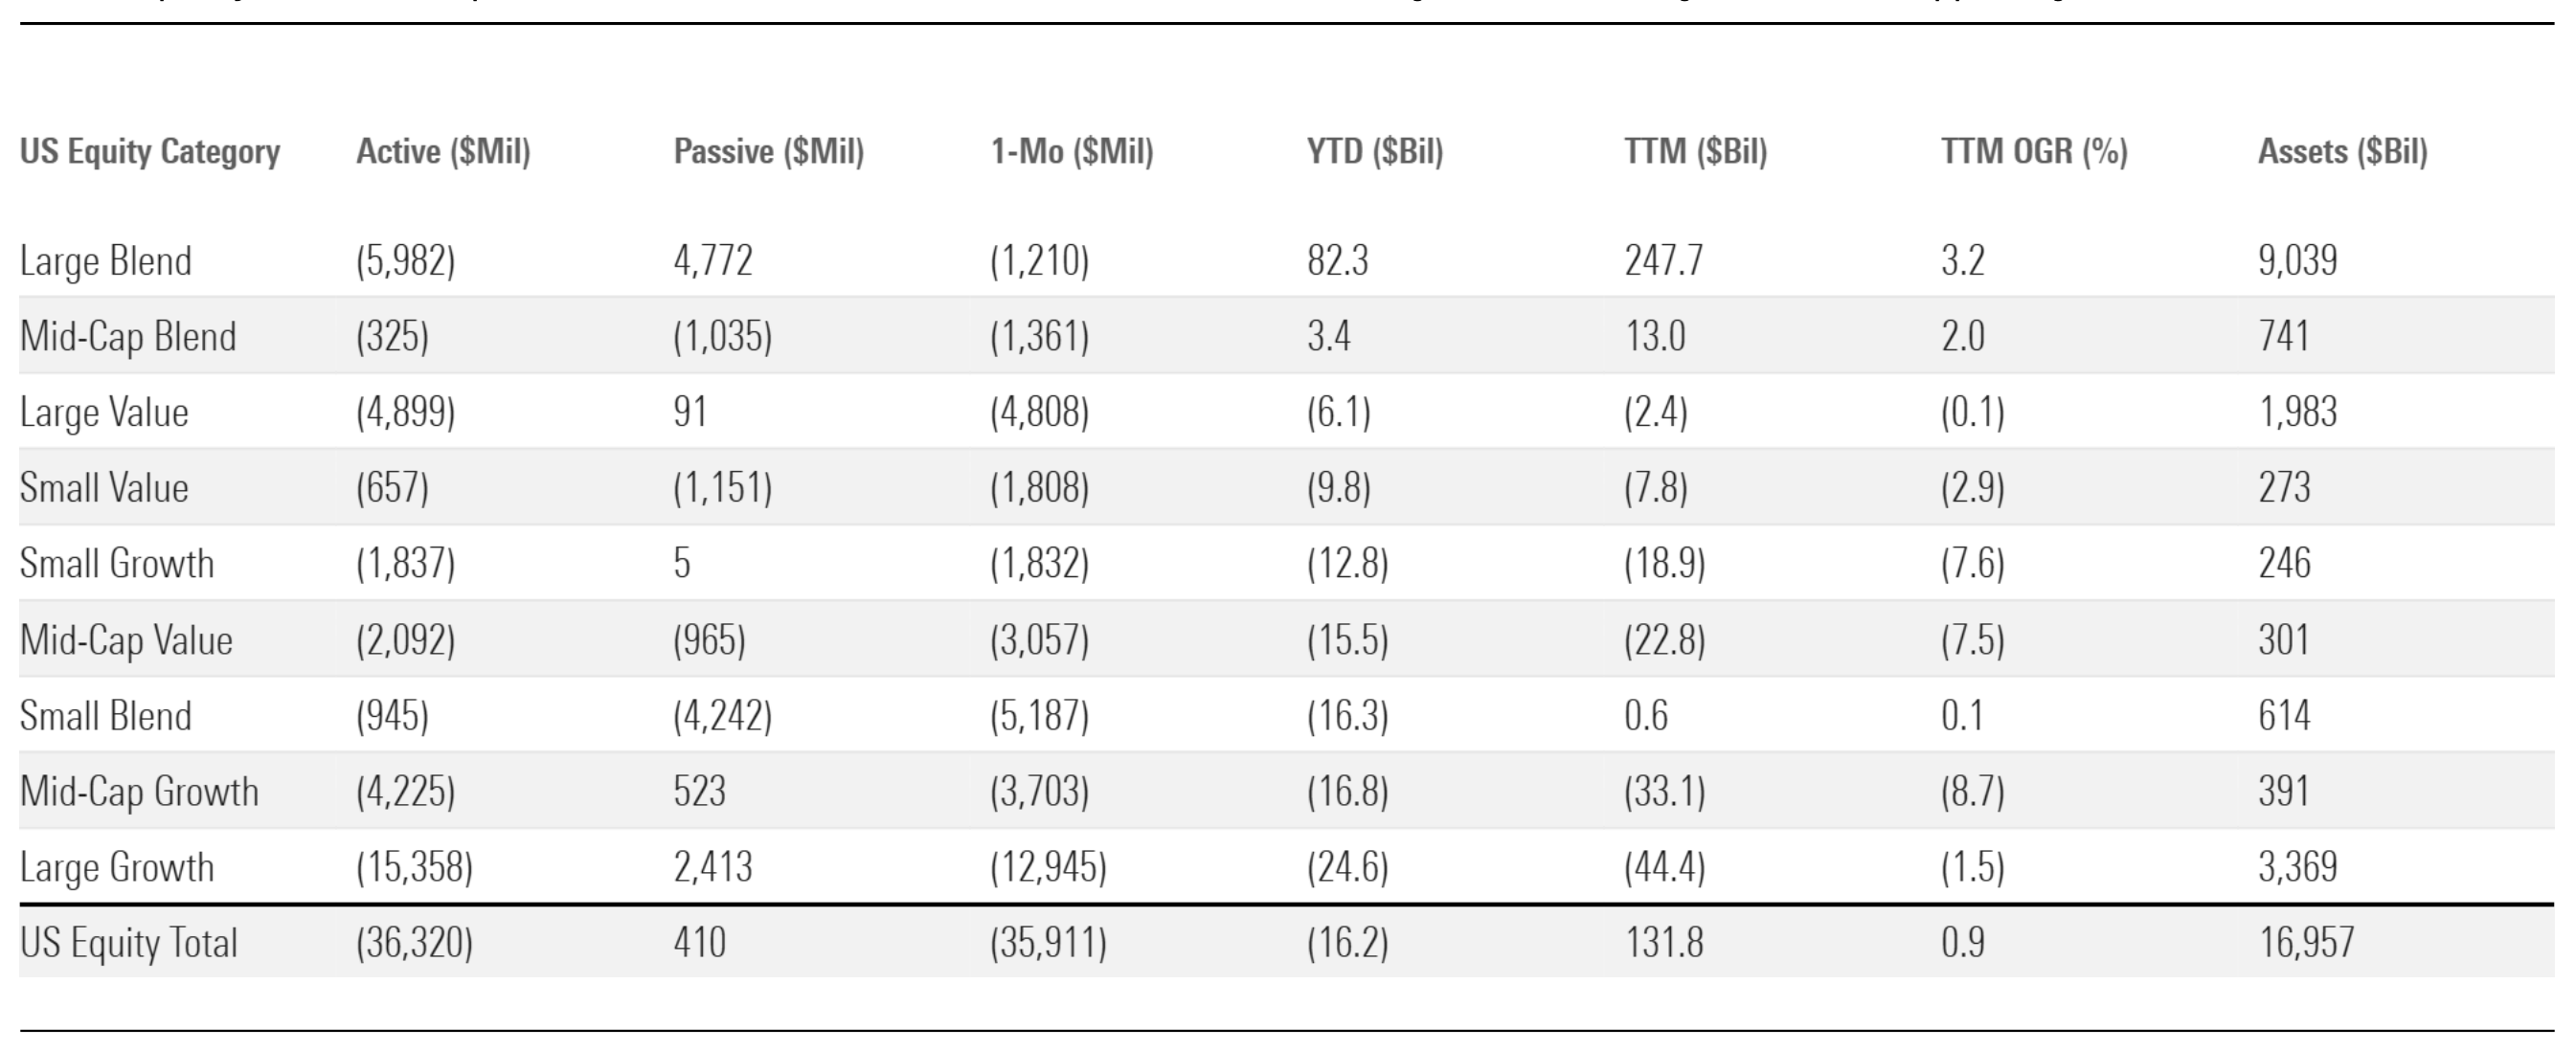
Even as US stocks continued to rally in June, US equity funds suffered outflows for the second month in a row, with all of the group’s categories in the red. The large-growth segment, the only one with inflows in May, bled nearly $13 billion in June. Muted inflows meant passive strategies didn’t bail out these categories as they often have in the past. The only gainers in the year’s first half were large blend and mid-blend, with the US equity group overall losing $16.2 billion. Still, over the past year, investors pushed more than $207 billion into S&P 500 trackers, driving inflows into large-blend and supporting the cohort overall.

Source: Morningstar Direct Asset Flows. Data as of June 30, 2025.

Active ETFs’ Rapid Ascent Slows Slightly
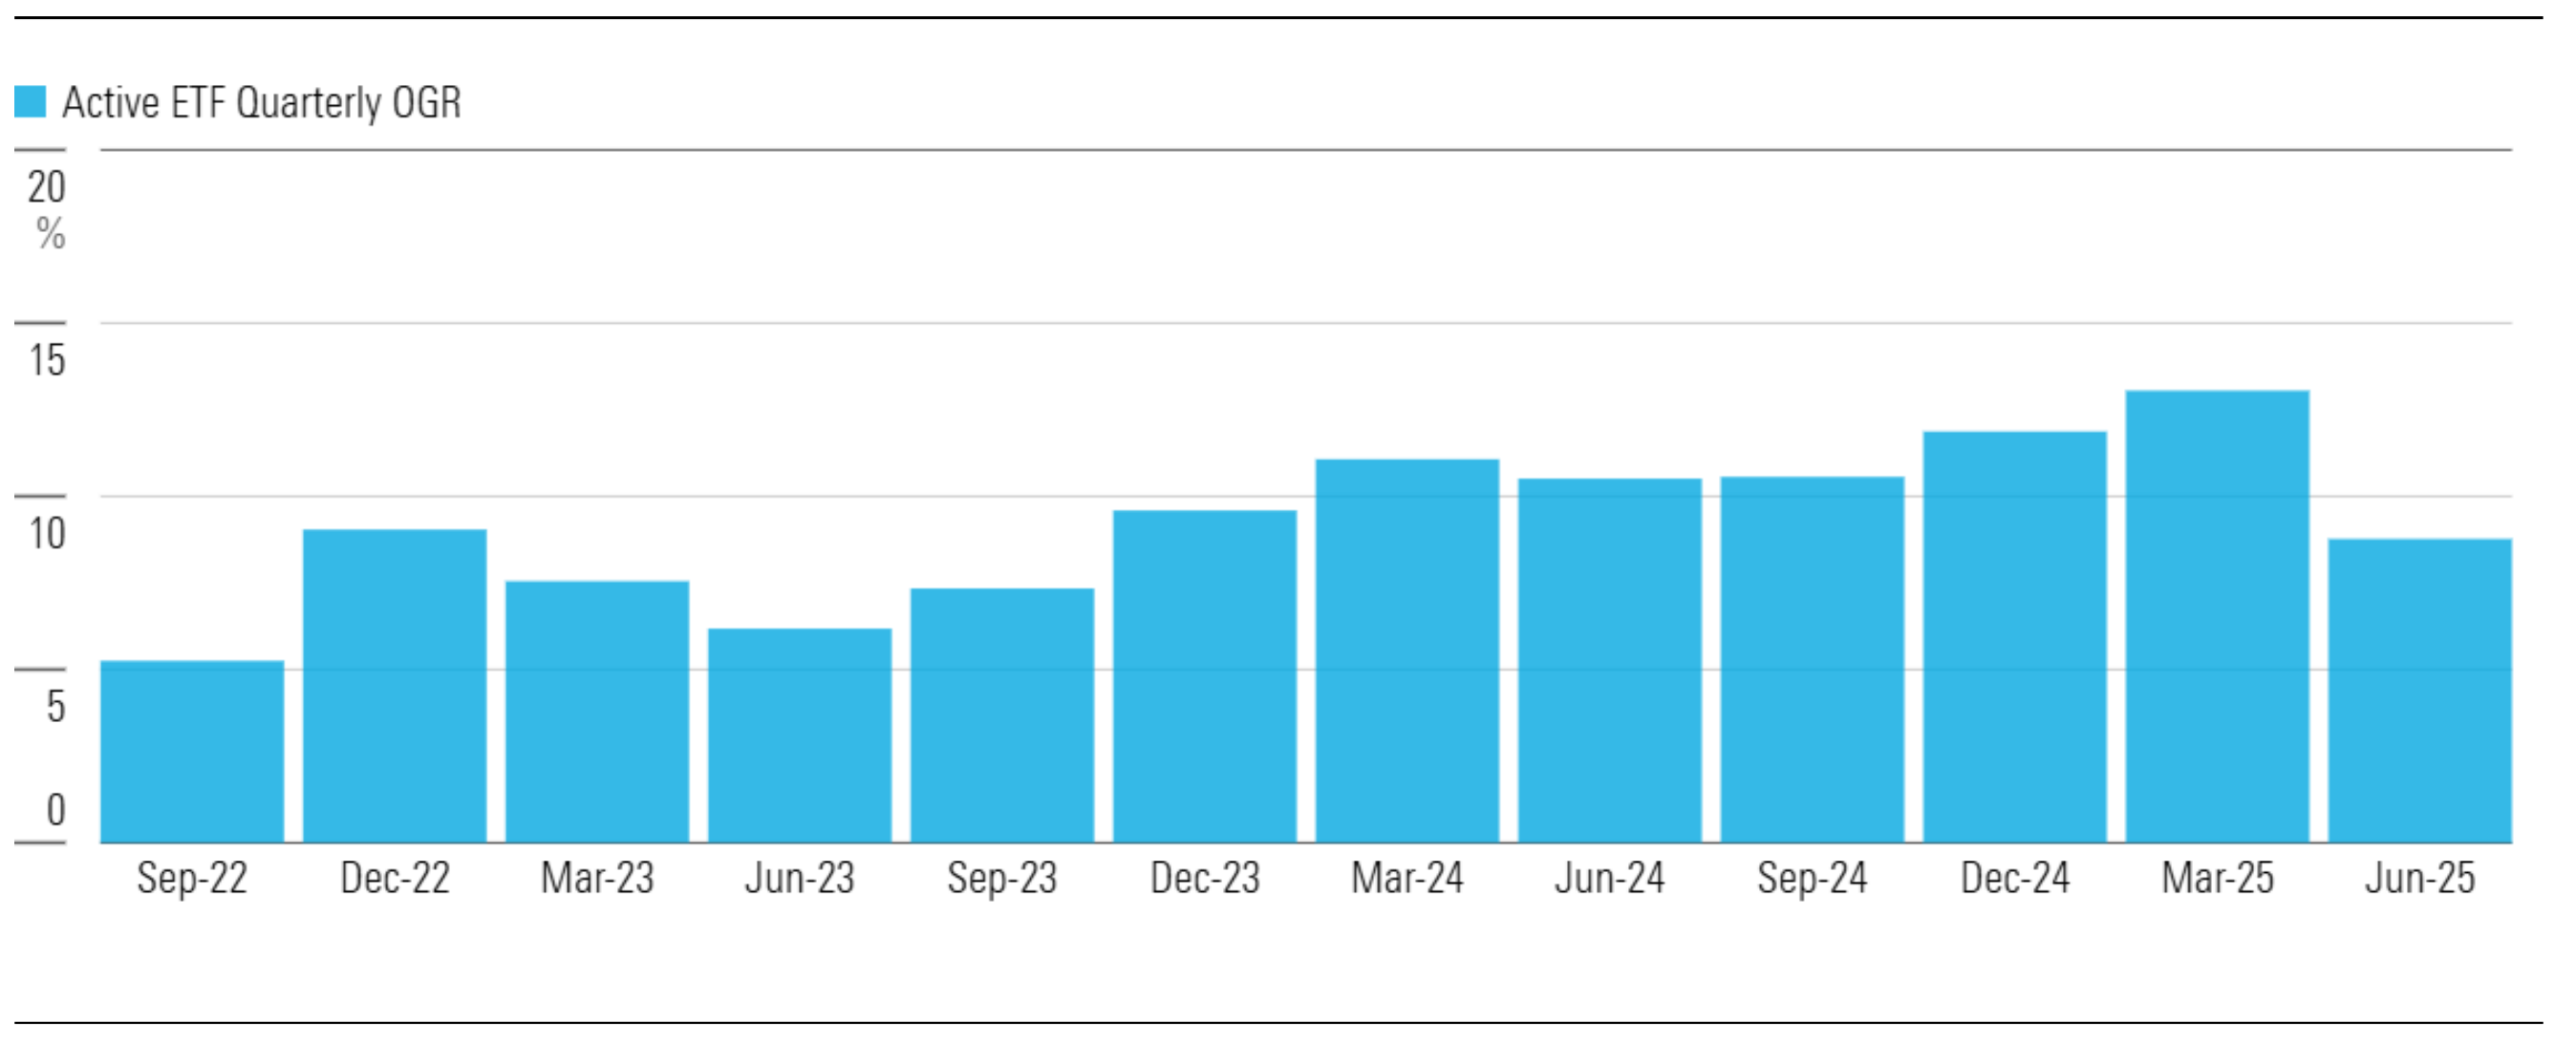
Active ETFs are hot these days, but June was relatively cool. Inflows of $29.4 billion in June brought the first-half total to about $200 billion, representing an organic growth rate of 53.5%. That was slightly lower than the three-year median, however, and the 8.8% organic growth rate in 2025’s second quarter was the lowest since the third quarter of 2023. But some slower growth rates are likely, given ETFs’ increasingly large total asset base. Some categories of fast growth include derivative income, large value, large blend, and intermediate core bond.

Source: Morningstar Direct Asset Flows. Data as of June 30, 2025. Organic Growth Rate = OGR

More on Fund Flows from Morningstar

For more comprehensive analysis and commentary on US Fund Flows, download this month’s full report.

Additional topics include: 

  • Active/passive flows by US category group 

  • Flows for the largest fund families 

  • Government bond fund and money market flows  

Can’t get enough fund flows data? Check out Morningstar’s Ultimate Guide to Fund Flows

Unsure about the future of active management? Check out this insightful article from a Morningstar analyst.

This article is adapted from the Morningstar U.S. Fund Flows report for June 2025. Download the full report here

Start a free trial of Morningstar Direct and evaluate fund flow data your way.  

You might also be interested in...

Note: The figures in this report were compiled on Feb. 28, 2025, and reflect only the funds that had reported net assets by that date. The figures in both the commentary and the extended tables are survivorship-bias-free. This report includes both mutual funds and exchange-traded funds but not funds of funds unless specifically stated. It does not include collective investment trusts or separate accounts. Important methodology note: Morningstar computes flows using the standard approach in the industry: Net flow is the estimated change in assets not explained by the performance of the fund. Our method assumes that flows occur uniformly over the course of the month. Adjustments for mergers are performed automatically. When liquidated funds are included, the fund's final assets are counted as outflows. Reinvested dividends are not counted as inflows. We use fund-level reinvestment rates to improve accuracy in this respect. We make ad hoc adjustments for unusual corporate actions such as reverse share splits, and we overwrite our estimates with actual flows if managers are willing to provide the data to us. When possible, Morningstar offsets outflows caused by transfers to other investment vehicles that share an identical mandate since they are not indicative of a change in investor interest.