
Top 10 Holdings of Our Ultimate Stock-Pickers' Index
Large-cap strategies disappoint on the back of stock market volatility in late 2019.

Fund investors would like to see the manager of the actively managed funds that they own beat the market every year, but they've been left wanting for well over a decade. The lack of consistent outperformance on the part of large-cap active managers (the main contributors to the Ultimate Stock-Pickers concept) has been well documented by the S&P Indices Versus Active Funds (SPIVA) U.S. Scorecard. For the five-year period ending in June 2019, the index group noted that 78.52% of large-cap managers have lagged the S&P 500. The results over this five-year period have been similar across all investing styles. A measly 8.26% of large-cap core managers have outperformed their index over the past five years versus 15.26% of large-cap value managers and 34.20% of large-cap growth managers outperforming their respective benchmarks over the same time period.
Even though five-year results have been poor for active management, over 30% of large-cap growth funds have still managed to outperform the S&P 500 benchmark. We saw particularly disappointing performance in the large-cap core category, which underperformed compared with 2018. The value strategy saw the largest decline in performance this year, leading to a decline in overall large-cap fund performance. Morningstar's own large-cap index has posted year-to-date returns of 25.45%.
The fund managers represented in our Ultimate Stock-Pickers concept have had their own issues with relative long-term performance. Only two of our 21 top fund managers were beating the S&P 500 on a 10-year basis at the end of last week. Our fund managers' performance in 2019 isn't looking much better, as only five of our 21 fund managers were beating the S&P 500 year to date. No fund has managed to beat the S&P 500 for both time periods measured.
As a reminder, the Ultimate Stock-Pickers concept was devised as a stock-picking screen, not as a guide for finding fund managers to add to an investment portfolio. Our primary goal has been to identify a sufficiently broad collection of stock-pickers who have shown an ability to beat the markets over multiple periods (with an emphasis on longer-term periods). We then cross-reference these top managers' top holdings, purchases, and sales against the recommendations of our own stock analysts on a regular basis, allowing us to uncover securities that investors might want to investigate further. There will always be limitations to our process, as we try to focus on managers that our fund analysts cover and on companies that our stock analysts cover, which reduces the universe of potential ideas that we can ultimately address in any given period.
This is also the main reason why we focus so much attention on large-cap fund managers, as they tend to be covered more broadly on the fund side of our operations and their stock holdings overlap more heavily with our active stock coverage. That said, by limiting themselves to the largest and most widely followed companies, our top managers may miss out on some big ideas on small companies that have the potential to generate greater outperformance in the long run.
Overall, 2019 has been a difficult year for stocks. After a volatile December 2018, the market attempted to rally during the first quarter of 2019. There was a brief period of respite in July with performance ticking up, though that soon sharply reversed toward the end of August. Since then, stocks continued to underperform until the end of October. There was a rally in November as some uncertainty with regard to economic policies such as those governed by the Fed abated and investors became less cautious. Right now, our aggregate market price to fair value ratio is 1.03, which means that we currently see the market as more or less fairly valued.
Taking a look at the cyclically adjusted price/earnings, or CAPE, ratio, which divides the current market price by the average of 10 years of earnings (adjusted for inflation), it currently stands at around 30.62, above where it was when we wrote the last article (29.66). This is compared with a historical mean of 16.68 and median of 15.76, with Shiller relying on market data from both estimated (1881-1956) and actual (1957 onward) earnings reports from companies represented in the S&P 500 Index. Today's levels are relatively in line with levels seen around events such as Black Tuesday and higher than levels seen before the global financial crisis.
The CAPE ratio is generally used to assess potential returns from equities over longer time frames, with higher-than-average CAPE values implying lower-than-average long-term annual returns going forward, which is what we're gleaning from the current ratio. While not intended to be an indicator of impending market crashes, it has provided warning signs for investors in the past.
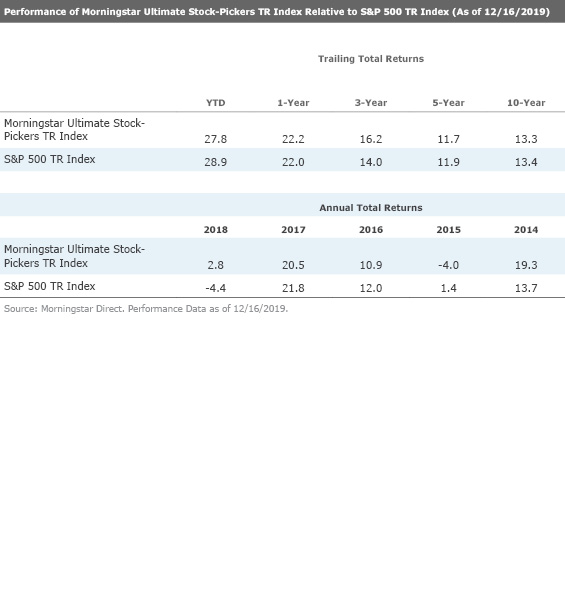
Aside from tracking the holdings, purchases, and sales as well as the ongoing investment performance of our Ultimate Stock-Pickers, we also follow the makeup and results of the Morningstar Ultimate Stock-Pickers TR Index. For those who may not recall, the Ultimate Stock-Pickers index was set up to track the highest-conviction holdings of 25 different managers, a list that includes our 21 top fund managers as well as the investment managers of four insurance companies—Berkshire Hathaway BRK./BRK.B, Markel MKL, Alleghany Y, and Fairfax Financial FRFHF. It is constructed by taking all the stock holdings of our Ultimate Stock-Pickers that are not only covered by Morningstar stock analysts but have either a low or medium uncertainty rating and ranking them by their Morningstar Conviction Score. The Morningstar Conviction Score is made up of three factors: 1) the overall conviction (number and weighting of holdings), 2) the relative current optimism (holdings being purchased), and 3) the relative current pessimism (holdings being sold).
The index itself is composed of three subportfolios—each one containing 20 securities—that are reconstituted quarterly on a staggered schedule. As such, one third of the index is reset every month, with the 20 securities with the highest conviction scores making up each subportfolio when they are reconstituted. This means that the overall index can hold anywhere between 20 and 60 stocks at any given time (because some stocks may remain as the highest-conviction score holders in any given period, meaning there can be overlaps in the holdings, reducing the total number of different stocks held). In reality, the index is usually composed of 35 to 45 securities, holding 41 stocks in all at the end of November. These stocks should represent some of the best investment opportunities that have been identified by our Ultimate Stock-Pickers in any given period. It can also have more concentrated positions than one might find in a typical mutual fund, with the top 10 (25) holdings in the index accounting for 46.5% (83.6%) of the total invested portfolio at the end of last month. The size and concentration of the portfolio does change, though, as this is an actively managed index that tries to tap into the movements and conviction levels of our top managers over time.
Looking at the top 10 stock holdings of the Morningstar Ultimate Stock-Pickers index at the end of November, there are currently only three names trading at approximately a 15% or more discount to our analysts' fair value estimates. These include wide-moat rated Gilead Sciences GILD, and narrow-moat rated Constellation Brands STZ and Chevron CVX. Another notable name on this list is narrow-moat UnitedHealth Group UNH, which is second on our top 10 stock holdings list. It currently trades at approximately a 5% discount to Morningstar analyst Julie Utterback's fair value estimate of $304 per share.
Narrow-moat rated UnitedHealth Group has been a deep-value play by many of our Ultimate Stock-Pickers as 11 of our 22 Stock-Pickers hold it in their portfolios. Notably, Allegheny made a high-conviction purchase into the stock this quarter.
UnitedHealth Group is the largest healthcare company in the world and offers both healthcare products as well as insurance services. Morningstar analyst Julie Utterback maintains the view that UnitedHealth continues to have an advantage due to its diversified healthcare operations and offerings, which include pharmacy benefit management, insurance, services, and analytics. These benefits lead us to award the company its narrow moat rating. While the company was listed as wide moat until recently, this change in designation has simply brought UnitedHealth closer in line with our narrow-moat outlook of the American health insurance and PBM industries in general. Other factors that played a role in this decision include an uncertain economic environment as a result of regulatory concerns in the long term.
Utterback affirms that the company maintains its moat through network effects as well as cost advantage as a result of scale due to its position as the number one U.S. private health insurer and its position as a top three PBM. UnitedHealth's scale has allowed it to leverage fixed costs that improves potential profitability from each additional individual the company covers. The company has furthermore leveraged geographic scale, by being the number 1 or number 2 insurance provider in 31 states, which increases localized negotiating power and drives down costs. UnitedHealth also enjoys cost advantages on the PBM side, with its Optum franchise providing enough purchasing power to obtain drug discounts and increase value for the company's clients. In addition, the franchise maintains switching costs, with contract lengths typically hovering around three years.
UnitedHealth further enjoys a narrow-moat designation as a result of network effects. In areas with considerable market share, UnitedHealth can offer lower costs and/or increased benefits to parties based on the number of clients that use the company's service. As a result, many employers choose to offer UnitedHealth's plans, which in turn attracts more physicians, hospitals, and other providers to join the network. This adds further negotiating capabilities for the company and thus the cycle continues. As an added note, UnitedHealth also has a large collection of data in the form of intangible assets, which the company monetizes via its OptumInsight segment. Overall, the company's varied moat sources and position as an industry leader all point to sustained good performance and outsized returns in the long run.
In spite of a highly uncertain regulatory environment regarding the future of health insurance in the U.S., Utterback believes that the exemplary management, operational diversity, and relative financial strength of the company will help it deliver strong returns and add value to the economy in the future.
Looking at the year-over-year performance of the Morningstar Ultimate Stock-Pickers index, many of the highest-performing standouts came from the technology sector, which supplied four names to the Top 10 Contributors list, and the healthcare sector contributed two names to the list. We noted that UnitedHealth Group appeared on both the top 10 holdings and top 10 contributors list this quarter. Four of the names on the list are trading at a discount to our Morningstar fair value estimates. These include wide-moat rated ServiceNow NOW and Intel INTC, narrow-moat rated UnitedHealth Group, and no-moat rated American International Group. ServiceNow tops the list and is trading at an approximate 10% discount to our fair value estimate.
Morningstar analyst Dan Romanoff sees value in wide-moat ServiceNow, a cloud computing company that provides a variety of software solutions and business process automation services. ServiceNow successfully established a land-and-expand strategy, building a top-notch SaaS solution for IT Service Management that offers flexibility and a superior user interface. This has helped develop a single system and automated a wide variety of processes. Having rapidly gained 40% of market share in this area, the company expanded operations further by incorporating add-on solutions that enabled its systems to reach departments such as HR service delivery and customer service.
ServiceNow achieved a high degree of success very quickly and has an impressive customer retention rate of 98%. The company services almost half of the largest 2,000 enterprises worldwide; these companies have high renewal rates and contract sizes are expanding rapidly. By incorporating its IT function within these enterprises, ServiceNow has paved the way for other offerings such as IT operations management (ITOM). This cross-selling in other areas of the enterprise has also boosted performance. ServiceNow's market presence, strong products, and excellent sales initiatives in non-IT areas will all contribute to healthy future growth.
While lists of top-performing stocks would expectedly be largely composed of stocks that have already run up, our top detractors list can sometimes be a good area to pick through the wreckage. While all these stocks have been given moats by Morningstar equity analysts, two of them are overvalued according to our fair value estimates. Even though they might not be performing as well at the moment, it is possible that there could be some value in these names in the long run. As we have highlighted several overvalued and undervalued names in the previous editions of Ultimate Stock-Pickers, we will highlight narrow-moat rated Dover DOV, which is trading at approximately a 20% premium to Morningstar analyst Joshua Aguilar's fair value estimate.
Dover is an industrial manufacturing company that provides a diversified list of goods and services, including pumps to transport fluids, commercial refrigerators, digital printing, and others. While the company has recently reported strong results and continues to be a high performer in the industry, Aguilar believes investors have become a little too optimistic about Dover's future.
The company's fluids segment has been performing exceptionally well, demonstrating year-over-year organic growth of approximately 10%, which was supported by robust expansion in the process solutions and the fueling and transport segments. However, Dover has seen a decline in growth contribution from the chip card regulation side (primarily Europay, Mastercard, and Visa), even though the business continues its steady growth.
Aguilar views the refrigeration business as a drag on growth. Economic uncertainty pertaining to the trade war has played a role in this, as demand in Asia for heat exchangers has fallen. Additionally, a decline in retail activity has also led to reduced demand for Dover's commercial refrigerators, further dampening performance. Moreover, the bears would highlight how the company has been inconsistent with hitting growth targets and has experienced difficulty in achieving them organically, especially in the refrigeration business.
In spite of these issues, Dover has demonstrated decent performance in many of its segments that continue to grow, and thus would be a good investment if its stock price moves well below our fair value estimate.
If you're interested in receiving e-mail alerts about upcoming articles from The Ultimate Stock-Pickers Team, please sign up here.
Disclosure: Nupur Balain and Eric Compton have no ownership interests in any of the securities mentioned. It should also be noted that Morningstar's Institutional Equity Research Service offers research and analyst access to institutional asset managers. Through this service, Morningstar may have a business relationship with fund companies discussed in this report. Our business relationships in no way influence the funds or stocks discussed here.
/cloudfront-us-east-1.images.arcpublishing.com/morningstar/XZEI3TYWZJBD5IP6YJ2EDOWRIY.jpg)
/cloudfront-us-east-1.images.arcpublishing.com/morningstar/SACNVSNDS5FTTFAEDRHVHNFB7M.jpg)
/cloudfront-us-east-1.images.arcpublishing.com/morningstar/5GAX4GUZGFDARNXQRA7HR2YET4.jpg)