
How Long Can a Good Fund Underperform?
We give an in-depth look at how we determined that winning managers trail their benchmark for a decade on average.
/s3.amazonaws.com/arc-authors/morningstar/fadee740-dfeb-494d-95b1-c462d0ac1f59.jpg)

The performance of an actively managed mutual fund is regularly compared against the performance of its benchmark to determine whether it is fulfilling its mandate to outperform that benchmark. While this seems like a straightforward exercise, it is complicated by the fact that a fund that ultimately outperforms its benchmark may go through a stretch of underperformance. For example, a fund that ultimately outperforms its benchmark over a 15-year period could have gone through an eight-year subperiod in which it underperformed. At the end of such a bad stretch, investors who evaluated the fund solely based on eight years of performance would have missed the subsequent outperformance.
The converse is also true. A fund that ultimately underperforms its benchmark over a 15-year period could very well have gone through an eight-year subperiod of outperformance, enticing performance-chasing investors to buy the fund, only to be disappointed by subsequent underperformance.
Most relative performance metrics such as alpha, beta, and information ratio take the period of analysis as given, typically three or five years. To our knowledge, there has been no systematic analysis of how long a period of underperformance an investor may have to bear while waiting for a fund to ultimately outperform its benchmark. Put differently, given that a manager is skilled and has a good chance of beating the benchmark over a set time period, over how long a stretch can that manager be reasonably expected to underperform within that period? Conversely, there has been no analysis of how long a period of outperformance a fund might enjoy before ultimately underperforming.
The purpose of this study is to fill that gap. We do so by introducing two new performance-related measures: Longest Underperformance Period, or LUP, and Longest Outperformance Period, or LOP. We define LUP as the longest subperiod of underperformance within a given period of outperformance and LOP as the longest subperiod of outperformance within a given period of underperformance. Note that LUP and LOP are in units of time and do not measure the magnitude of under- or outperformance, nor do they measure probabilities. However, as we discuss below, we estimate their probability distributions with Monte Carlo simulation.
Definitions and Data Over a given period, say, 180 months, the LUP of a fund is the longest subperiod (in months) over which the fund underperformed its benchmark. In other words, the cumulative return of the fund was less than the cumulative return of the benchmark over a subperiod of LUP months.
While this definition of LUP seems simple enough, there are a few complications that we need to address when measuring LUP. This is because there are three possible patterns of relative cumulative values that we must deal with:
1. The fund underperforms over the full period. In this case, LUP is not defined.
2. The fund outperforms over the full period, but toward the end of the full period, a subperiod of underperformance starts that does not conclude before the end of the full period. In this case, we call the length of this subperiod an incomplete LUP.
3. The fund outperforms over the full period, with a subperiod of underperformance that ends before the end of the full period. In this case, we call the length of this subperiod a complete LUP.
There are three analogous cases when measuring LOP:
1. The fund outperforms over the full period. In this case, LOP is not defined.
2. The fund underperforms over the full period, but toward the end of the full period, a subperiod of outperformance starts that does not conclude before the end of the full period. In this case, we call the length of this subperiod an incomplete LOP.
3. The fund underperforms over the full period, with a subperiod of outperformance that ends before the end of the full period. In this case, we call the length of this subperiod a complete LOP.
An Empirical Study To see how LUP and LOP work out in practice, we conducted a global study that used active funds' returns over the 15-year period from Jan. 1, 2003, through Dec. 31, 2017. There is nothing magical about using this particular 15-year period: It was a long enough time frame to measure long-term performance, and it gave us a sizable sample of funds. We used the following criteria to select funds and their appropriate indexes:
- To remove the effect of fund fees, which vary across regions, we used gross returns.
- The fund's domicile was one of the following: United States, Canada, United Kingdom, eurozone, Europe ex-euro, and developed Asia ex-Japan. Japan and Australia were not included because of the difficulty of obtaining gross returns for those markets.
- We used the oldest share class for each fund.
- There must be 180 monthly total returns over the period from January 2003 to December 2017. Consequently, the study omits the results of funds that began the 15-year period but did not finish it because they were merged away or liquidated before December. This choice was motivated by the methodological decision to have all funds' returns be over the same period. (Admittedly, one could have collected all the funds with 15-year records even if they closed before December, but we do not believe this would have changed the results.)
- To remove the effect of currencies—in some regions, funds are offered in hedged and unhedged versions, and in local as well as foreign currencies—we used only share classes that were marked as unhedged.
- For each month, a fund's historical categorization (its Morningstar Category) was used to select the fund's appropriate benchmark. The reason for this was that funds change behavior and mandates, which may result in their recategorization. By matching an index appropriate to a fund's category at every point in time we avoid the risk of comparing a fund with an irrelevant benchmark.
- For the United States, each category was mapped to an appropriate category index. Outside of the United States, for each category, its primary index was used.
- Because the primary index is sometimes denominated in a currency that differs from the fund's own currency, we translated all the funds' and indexes' returns into U.S. dollars.
- We used only equity funds. The reason for the exclusion of fixed-income and allocation funds is that they are sometimes harder to map to an appropriate index.
The source of this data was the Morningstar Research Database.
Altogether, this gave us 5,500 unique fund and fund-category-adjusted-index histories that were used to calculate the funds’ LUPs and LOPs.
The Results The results paint a reasonably benign picture of the active-fund global universe on the one hand, and a striking one on the other.
EXHIBIT 1 shows the averages and distributions of LUPs for the funds that outperformed their benchmarks over the 15-year period considered. Roughly two thirds—3,790 out of 5,500— of the funds’ gross returns beat their benchmarks over the 15-year period considered. Nonetheless, the results also reveal that for the 3,790 funds that did outperform, the average incomplete LUP was 133 months, which is just more than 11 years, and the average complete LUP was 106 months, which is just short of nine years. Hence, on average, investors who were hoping to hold outperforming funds over this 15-year period not only needed to pick the right funds but have the patience to endure periods of underperformance of nine to 11 years at some point within that period!
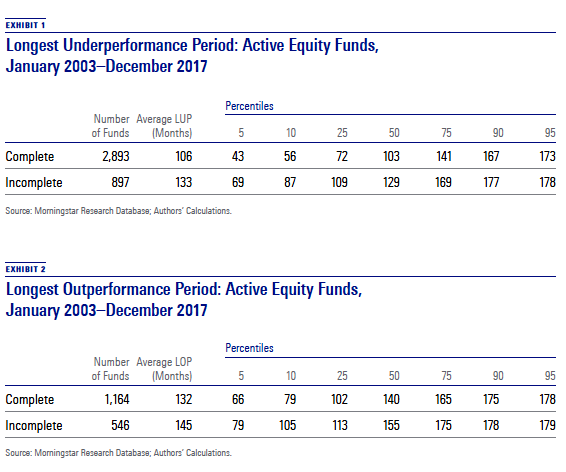
These results aggregate over all the regions considered, but the averages did not vary much across regions. The longest and shortest average complete LUPs were for the United States (112 months) and the United Kingdom (95), respectively. For incomplete LUPs, they were Canada (141) and the United Kingdom (120), respectively.
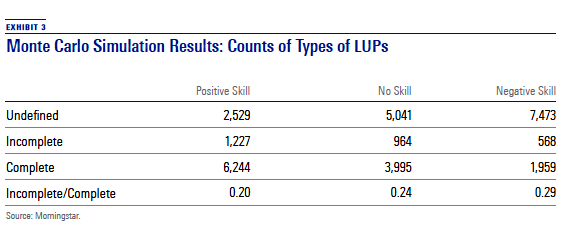
EXHIBIT 2 tells the other side of the story. Funds that have long periods of outperformance can ultimately underperform. Of the 1,710 funds that ultimately underperformed over the 15-year period, 1,164 had an average complete LOP of 132 months (11 years), and 546 had an incomplete LOP with an average of 145 months (just more than 12 years). Hence, it would be a mistake to judge a fund’s ability to outperform its benchmark on a track record as long as 11 years.
These results are counterintuitive enough that a question naturally arises: Are they due to the peculiarity of the time period or the fund sample under consideration? We investigated this question by running a Monte Carlo simulation of “positive skill,” “no skill,” and “negative skill” managers; these were defined as managers who had a 75%, 50%, and 25% chance of outperforming their benchmarks over a 15-year period, respectively. We ran 10,000 Monte Carlo trials.
EXHIBITS 3 & 4 present the results of the Monte Carlo simulation for LUP.[1] EXHIBIT 3 shows the number of trials that result in LUPs being undefined, incomplete, and complete, and the ratio of the number of incomplete LUPs to the number of complete LUPs.
The first line of EXHIBIT 3 serves as a reality check on our simulations. Note that the number of trials that result in LUPs being undefined matches the assumed skill level. In the case of positive skill, we set the failure rate to 25% and the number of trials with undefined LUPs is about 25% of the 10,000 trials. We have a similar result for the other skill levels. Also note the ratio of incomplete to complete LUPs increases as the skill level decreases.
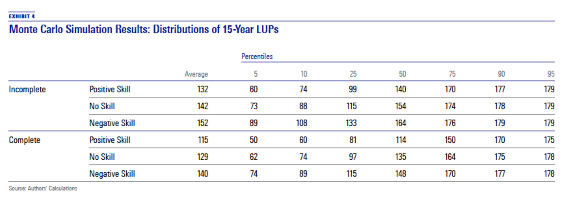
EXHIBIT 4 shows the averages of incomplete and complete LUPs as well as various percentiles of the distributions. Note that, as we are reporting LUPs, we are conditioning the results shown here on having outperformed the benchmark over the entire 15-year period. For the skilled manager, the average complete LUP is 115 months and the median is 114 months. Thus, a fund manager who has the skill to outperform the benchmark over a 15-year period with a 75% probability could easily end up with a 9.5-year run of underperformance even when ultimately outperforming the benchmark over the full 15 years. From the 5th and 10th percentiles, we see that there is a 5% to 10% chance of about a four- to five-year stretch of underperformance. For the lower skill levels, these stretches are longer, but in practice, there is no easy way of telling whether a bad stretch is attributable to luck or skill.
These results were largely consistent with the empirical results presented in this article. For example, the average complete and incomplete LUPs for our simulated skilled managers were 115 and 132 months, respectively, not far off the results of 106 and 133 months that we got from actual funds (on the assumption that outperforming the index over 15 years is a decent proxy for being a “skilled” manager).
This, then, is the nature of active management. Even in the presence of skill, there can be long periods of underperformance. To further bolster this result, we extended the simulation study to 100 years; here, the “skilled” manager was very skilled indeed, with only a 5% chance of underperforming the benchmark over 15 years. It turns out that even such an extremely skilled manager would, on average, have a 25-year-long stretch during the 100 years in which they underperformed the benchmark.
It's a Long Game These are unexpected results, both on the empirical front and on the stylized simulation front. Before we invest them with too much meaning, let us clarify two things.
First, while it is true that even the good performers can go through long stages of underperformance, this does not necessarily reflect the experience of an investor. Even for an investor who held a given fund through the whole 15-year period, a LUP of, say, nine years would not be experienced as a continuous series of worsening performance relative to the index. There would almost certainly be ups and downs along the way.
A more conventional analysis brings this out. For the outperforming funds in our sample, we calculated the percentage of three-year periods (overlapping, with the three-year window rolling monthly) that outperformed the index. Even funds with an average LUP of 119 months (average of complete and incomplete LUP averages) outperformed their benchmark in some 65% of the rolling three-year periods. Thus, long periods of underperformance come with a good dose of shorter-period outperformance within them.
Second, because of the very definition of LUP, the severity of underperformance incurred over the LUP is typically small. LUP is the longest period of index underperformance. Hence, adding just one month to the beginning or end of the LUP would result in a period of outperformance. Heuristically, one could say that the LUP’s cumulative underperformance is in order of magnitude of one month’s worth of a given fund’s outperformance. LUPs may clock in long time frames, but the drawdowns incurred over their duration are small.
With all that said, the results presented here are more than just a statistical curiosity and should encourage investors to recalibrate their expectations. It turns out they need to be even more patient than we thought. Standard performance evaluation periods—three, five, even 10 years—are far too short to make well-informed judgments about a manager’s skill or lack thereof. Performance is just not a reliable guide to assessing managers unless one extends the time frame to decades.
Every prospectus and marketing piece out there proclaims that “Past performance is no guarantee of future performance.” It seems like no one believes it, but they should, given the results we presented. Investors should not pick funds based on their three- or five-year records. Asset-management firms should not pay their managers based on the same periods. And investors need to arm themselves with a big dose of patience. Even funds with Morningstar Analyst Ratings of Gold that beat their benchmarks over long time periods went through extremely long periods in which an investor would have been better off with a passive offering.
Active investing is a long game.
[1] We show only the results for LUPs, as the results for LOPs are just their mirror image. For example, the results for LOP for the manager with negative skill are very similar to the results for LUP for the manager with positive skill.
This article originally appeared in the August/September 2018 issue of Morningstar magazine. To learn more about Morningstar magazine, please visit our corporate website.
/cloudfront-us-east-1.images.arcpublishing.com/morningstar/6NPXWNF2RNA7ZGPY5VF7JT4YC4.png)
/cloudfront-us-east-1.images.arcpublishing.com/morningstar/RYIQ2SKRKNCENPDOV5MK5TH5NY.jpg)
/cloudfront-us-east-1.images.arcpublishing.com/morningstar/6ZMXY4RCRNEADPDWYQVTTWALWM.jpg)
:quality(80)/s3.amazonaws.com/arc-authors/morningstar/fadee740-dfeb-494d-95b1-c462d0ac1f59.jpg)