
Why the Fed Never Sees It Coming
Data this week suggest the consumer is back in the saddle and inflation continues to worsen, but the Fed appears handcuffed.

It was another decent week for equity markets as headline U.S. economic data suggested a sharply improving economy. While a more careful look at the data was not as bullish, fears of a U.S. recession seem greatly diminished.
Overseas bankers continued to suggest that more easing was likely in the months ahead and that soft export data out of China could mean more stimulus in that market. That tends to handcuff the U.S. Federal Reserve from raising rates, even as the U.S. economy accelerates and inflation worsens.
Academic economists often study past Fed actions surrounding bouts of inflation and conclude that the Fed was asleep at the interest-rate switch, or at least too slow to act. They ask how this can happen again and again.
Right now, we are seeing exactly how and why that happens. There are factors, often different each time, that cause them to pause. This time it is the world economy. Beyond world activity, even the modest rate rise in December seemed to coincide with a slow first quarter, which is making the Fed doubly cautious concerning further increases. And when volatile economic data intimates a recession one month, and then shows a boom the next month, who can blame them?
The quick summary of this week's data suggests the consumer is back in the saddle after a rough first quarter, inflation continues to worsen (especially in services), and manufacturing, despite some fancy headlines, remains stuck in the mud. Given labor shortages, employment growth is going nowhere fast.
Retail Sales Data Suggests the Consumer Is Alive and Well Consumption represents about 70% of GDP and retail sales of goods comprise about a third of consumption. In recent quarters, almost all GDP growth has come from consumption. A sharp drop in consumption in the first quarter was the main reason GDP growth dropped to a pathetic 1.1% growth rate. Unusually warm weather and auto industry results played a big role in that drop.
Now it appears that as weather has returned to normal so has consumer spending. With China, Brexit, and terrorism headlines in the paper every day, there was a lot of fear that consumers would pull in the reins in June after opening up their wallets in April and May. Poor June auto sales heightened those fears.
However, the June retail sales report was much stronger than anybody anticipated. Headline retail sales grew at a 0.6% rate (0.7% excluding the suffering auto industry). This compared with embarrassingly low consensus forecasts of 0.1%. The strong June results followed strong gains of 0.2% in May and 1.2% in April. Usually retail sales bounce around from month to month with good and bad months often alternating. Three decent numbers in a row is quite unusual, as shown in the first column of data below.
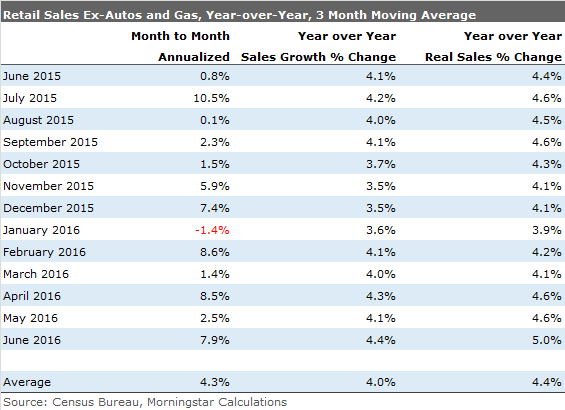
Year-over-year data, while not as robust, has shown accelerating gains since December. The post-January gains in real (inflation-adjusted) sales have been even more dramatic, moving from under 4% in January to 5% currently (excluding gas and autos).
We often comment that the retail sales report is close to worthless until we can make inflation adjustments. However, this month retail sales and the CPI were released on the same day. With goods prices declining 0.2% month to month and 0.6% on a single-month basis, the retail sales report was likely stronger than the headline numbers suggested. It was hard to find fault with this report.
Category Data Shows Broad Strength Oftentimes the retail sales report shows very uneven category performance with a wide spread between good and bad performers. However, this month the strength was across the board.
The best of the "losers," or underperforming categories, showed positive gains of 0.4% and 0.5%, hardly anything to sneeze at.
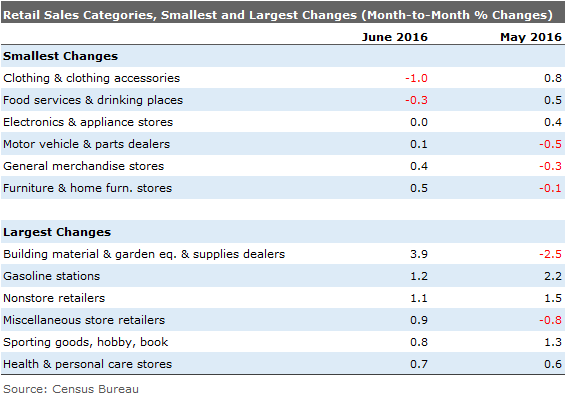
Both building materials and furniture did quite well in June after a couple of months of underperformance. Given the strong performance of the housing sector, we were very surprised at how poorly these categories had been doing. As weather improved, both of these poorly performing categories demonstrated nice gains in June, offsetting some of the earlier weakness.
About the only ringer we show was the health and personal care category, with seemingly strong 0.7% gains in June. Nevertheless, the CPI report suggested that increases of more than 1% for drug prices were likely behind those outsize gains.
Weekly Shopping Center Data Supports Strong June Report and Continued Growth The retail sales data did indeed have certain elements of too good to be true. We wonder if some day count issue or trend lining techniques (off the strong June employment report) might have helped things along. Still, we note that our separate weekly reports on retail sales also spotted the improving retail trend as shown below. Recent data, announced after month-end, suggests that sales growth remains strong with the unaveraged data slowing only slightly in July and not at all on a moving-average basis.
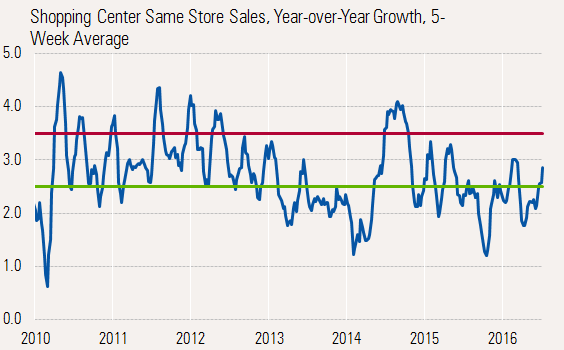
Source: The Retail Economist Weekly Chain Store Sales Report
Longer-Term Trends Remain Intact Retail sales have averaged in a very tight range of 2%-4% for most of the current recovery, if one ignores the weather-related sinking spell in early 2014 and the rebound from that unusually bad weather in 2015. If one were to visually squish the downward lump of 2014 and the 2015 rebound, an underlying and stable growth rate of about 4% becomes quite apparent.
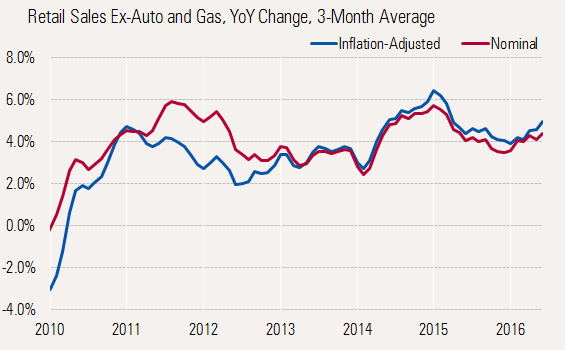
Source: Census Bureau, BLS goods inflation, Morningstar calculation
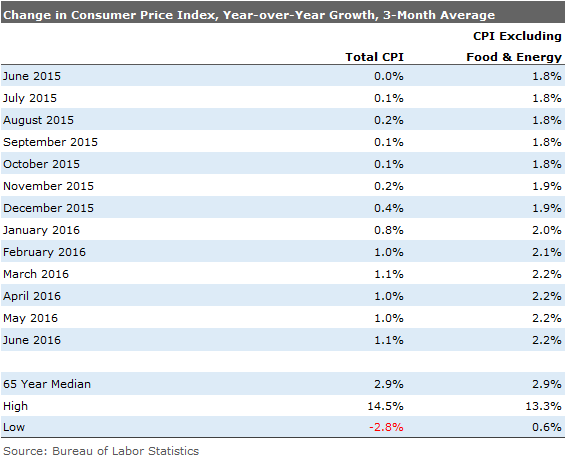
Inflation Not as Benign as Headline Numbers Suggest Markets were very satisfied with the June CPI report with headline and core inflation of just 0.2% (2.4% annualized), which exactly matched consensus forecasts. Headline (total) inflation was just 1% year over year, while core inflation did heat up modestly to 2.3% for the single month of June. The year-over-year trend in both total and core (excluding food and energy) didn't move that much month to month, which many investors found soothing.
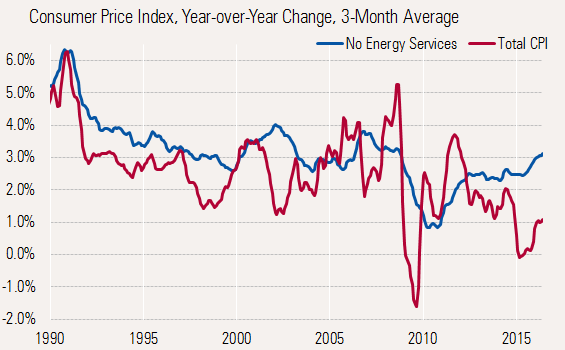
Stepping back, the 12-month trend is clearly worsening as energy prices stabilize and services prices accelerate. Falling food and hard-goods prices have kept a lid on inflation for longer than we had been expecting.
Services Remain a Huge Issue Beneath the surface, service inflation, perhaps driven by higher wages, has accelerated at an alarming rate. The three-month average of services inflation is now up 3.2%, the highest level of the recovery. With services accounting for about 60% of the CPI calculation, this certainly is not a good thing. As we discuss later, a broad range of services prices has been accelerating.
Source: Bureau of Labor Statistics
Lower Food and Goods Inflation Give the Fed Some Wiggle Room The burnoff of energy-price-decline benefits has occurred about as we had expected. However, food prices have made a sharp U-turn and are now providing an unexpected benefit to the headline inflation rate. Too, food prices are on the decline again as the strengthening dollar has brought down the price of imported goods.
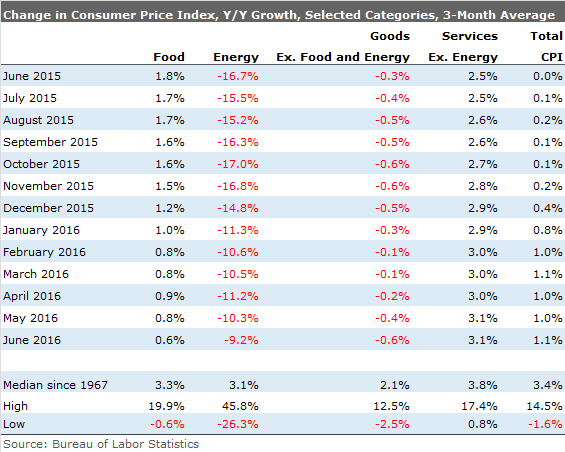
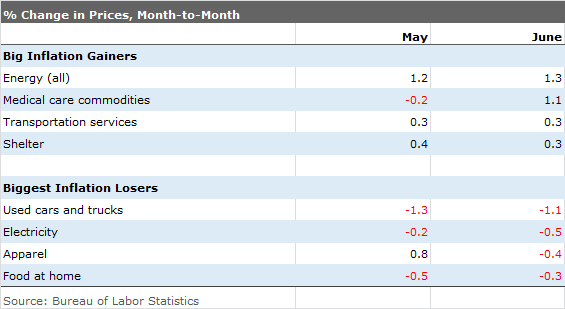
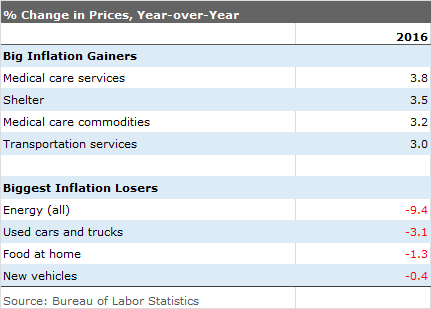
Both Monthly and Year-Over-Year Inflation Data Turn Up the Same Problems The category inflation data is quite telling. Energy now turns up on the biggest gainers list on a monthly basis and the biggest losers list for the year as energy prices stabilize. While gasoline prices are likely to be less problematic in July, we suspect that natural gas prices will continue to pressure the utilities portion of the energy category.
Both the yearly and monthly data show the same inflationary culprits in the services category: medical, shelter, and transportation. We keep hoping more apartment building will rein in rent increases (which were up 3.8% year on year), but so far rents still seem to be accelerating, according to the CPI report. With more demand for medical services again and more specialty drugs, it seems like medical care prices might not retreat much, either.
Wages Moving Higher With Core Inflation Both workers and corporations have figured out that over time food inflation and energy inflation move back toward core inflation rates, as they have for decades. The correlation between wage inflation and core inflation has been a relatively tight one lately. We won't wager a guess whether it is wages driving inflation or inflation driving wages. Still, with core rates likely to accelerate in the month ahead, consumers could benefit from higher wage levels while corporate profits shrivel.
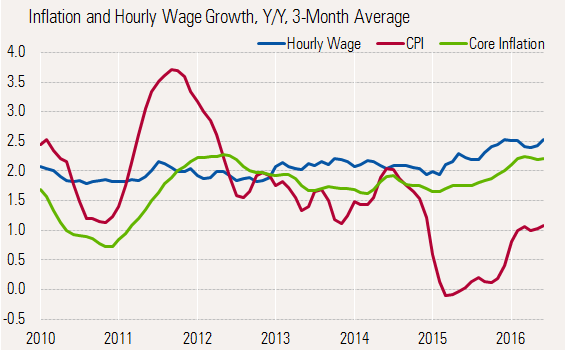
Source: BLS, Morningstar calculations
JOLTS Report Suggests Tight Labor Market, Wage Increases, but Not Much Employment Growth The Job Openings and Labor Turnover Survey didn't provide a lot of new insights this month, as both openings and especially hiring hit an air pocket in May-June, although openings remain well above hirings, suggesting an unbalanced labor force and a worker shortage. Over a 15-year history, openings have seldom exceeded hires, and now that gap is quite wide--5.0 million hires versus 5.5 million openings.
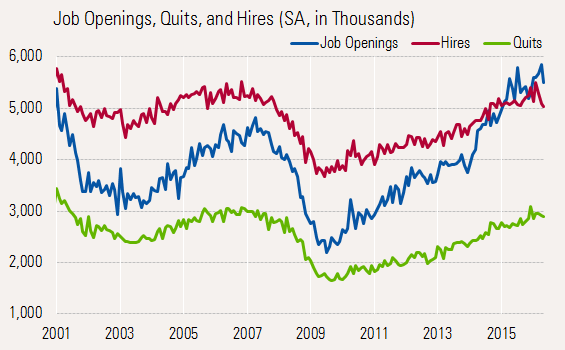
Source: BLS
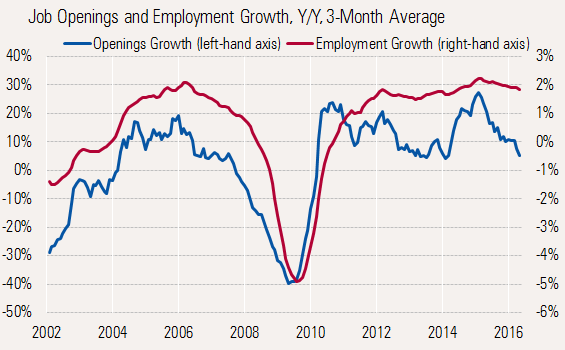
Falling Openings Rate Combined With Low Hires Suggests Employers Are Giving Up
Though the level of openings remains strong, the number of openings has begun to decelerate sharply. With jobs so hard to fill, we think some employers have decided to forgo growth or seek alternate ways to do work. Also, some major employers are seeing the light and offering both higher wages and more training. This week both
Source: BLS
Monthly Industrial Production Posts a Strong Monthly Gain A 0.6% jump in total industrial production, which exceeded expectations of 0.5% growth, cheered markets. A lot of news outlets suggested, correctly, that this was the best performance since last July, which isn't necessarily saying a lot.
Despite Rosy Headlines, Manufacturing Going Nowhere Fast Unfortunately, this data set is volatile, and the year-over-year averaged data tells a more complete story. Here growth continues to plumb the bottom with a clear trend out of the current hole.
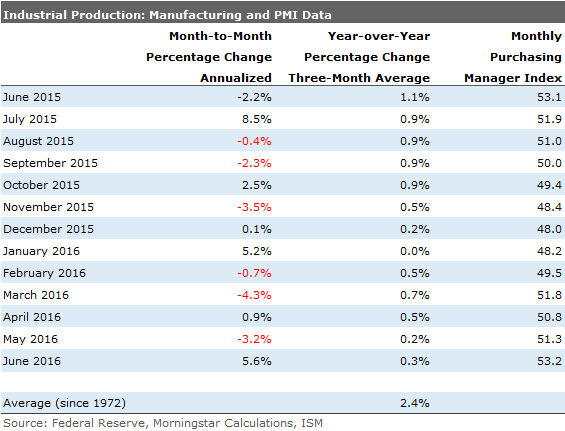
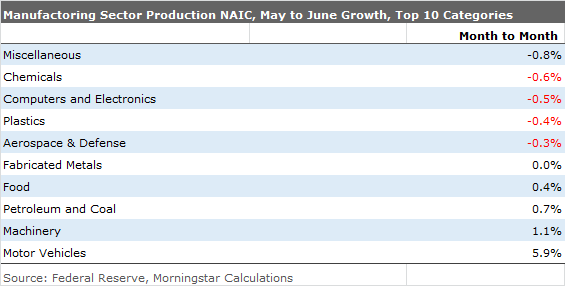
Autos and Bounce in Machinery Drive Strong Monthly Performance Even the monthly data doesn't look so hot on a month-to-month basis by category. A strong jump in auto production, which makes no sense relative to poor sales data, suggests that perhaps the strong monthly manufacturing data was a fluke and not the start of something really good.
Longer-Term Picture Not Great, Either Unfortunately, the heyday of manufacturing may be behind the U.S. economy. Today's seemingly strong number needs to be put in the context of a slowing manufacturing sector that will find it increasingly difficult to return to its former growth rates.
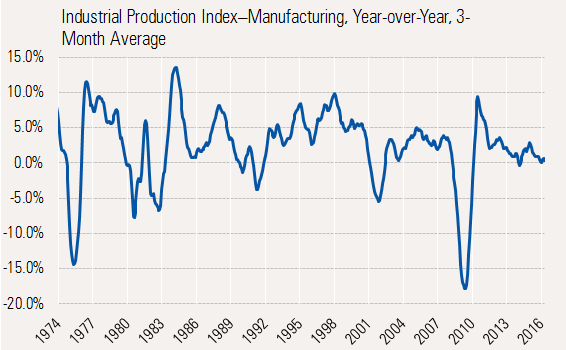
Source: Federal Reserve
Note: Since this article was originally posted, we corrected several tables--"Retail Sales Ex-Autos and Gas," "Change in Consumer Price Index," "Change in Consumer Price Index Selected Categories," and "Industrial Production"--that contained incorrect year labels (they originally indicated 2016 instead of 2015 for several of the initial entries).
/cloudfront-us-east-1.images.arcpublishing.com/morningstar/GJMQNPFPOFHUHHT3UABTAMBTZM.png)
/cloudfront-us-east-1.images.arcpublishing.com/morningstar/ZYJVMA34ANHZZDT5KOPPUVFLPE.png)
/cloudfront-us-east-1.images.arcpublishing.com/morningstar/LDGHWJAL2NFZJBVDHSFFNEULHE.jpg)