
Will the 60/40 Portfolio Start to Work Again?
The jury is out on whether rising bond yields could turn the tides back in favor of the popular diversification strategy.
/s3.amazonaws.com/arc-authors/morningstar/ba63f047-a5cf-49a2-aa38-61ba5ba0cc9e.jpg)
Of all the curveballs thrown at investors this year, perhaps the biggest was the failure of bonds to act as insurance against declines in the stock market.
This was front and center in the third quarter, when a portfolio of 60% stocks and 40% bonds posted bigger losses than just one invested broadly in stocks, an exceptionally unusual occurrence.
The failure of so-called 60/40 portfolios to offer investors protection from the bear market in stocks has upended what had become conventional wisdom among the markets: Stock prices and bond prices don’t move in the same direction. That thinking has been a foundation of diversification strategies for many years. Driving this significant shift in market behavior this year has been stubbornly high inflation and the Federal Reserve’s breakneck pace of interest-rate increases.
“Stocks and bonds both plummeted at the same time in 2022,” says Hong Cheng, portfolio manager for outcome-based strategies at Morningstar Investment Management. “Nothing has worked—not stocks, not bonds, and not the 60/40.”
The question is now whether the relationship between stocks and bonds has undergone a lasting, secular change, and as a result, the abysmal performance of 60/40 portfolios will continue or if bonds will go back to providing helpful diversification against losses in the stock market.
It’s a question that is up for broad debate, with the outcome seen hinging largely on medium- to longer-term trends in inflation. If inflation stays high, it could spell continued trouble for 60/40 diversification. But if inflation is brought under control by the Fed, and should the economy slide into a recession, bonds could return to their recent role as an offset to the stock market.
This dynamic is one with significant implications for investors. “The 60/40 is the basic passive portfolio for a lot of investors,” says Roger Aliaga-Diaz, head of portfolio construction and chief Americas economist at Vanguard Group.
How Has a 60/40 Portfolio Performed in 2022?
As inflation reaches levels not seen in decades and the Federal Reserve hikes interest rates at breakneck speed, 2022 has put stocks on track for their worst year since 2008 and bonds on track for their worst year in modern history.
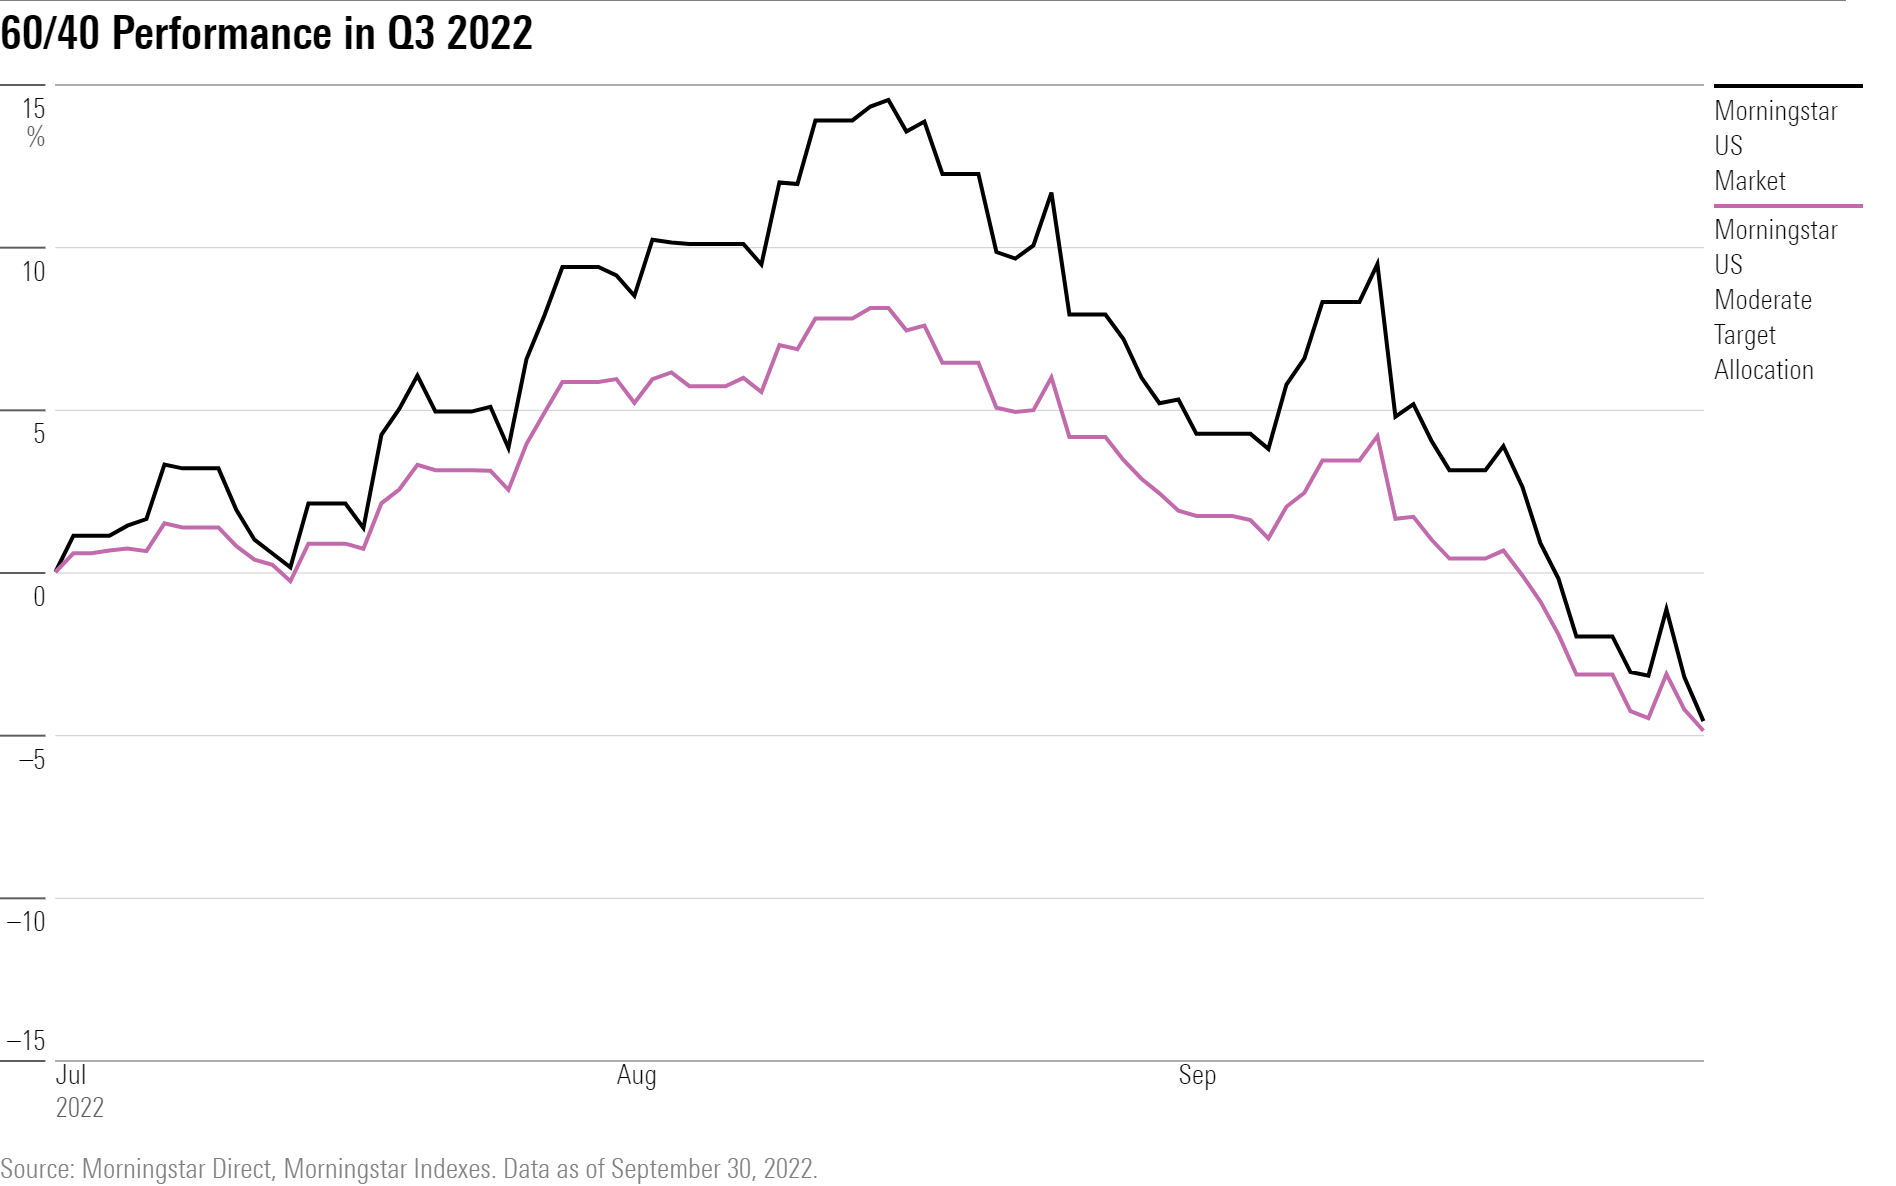
This year has been the only time in history that both stocks and bonds both posted losses for three consecutive quarters, as measured by the Morningstar US Market and Morningstar US Core Bond indexes.
The Morningstar US Moderate Target Allocation Index—a diversified mix of 60% equities and 40% bonds designed as benchmark for a 60/40 allocation portfolio—ended the third quarter with losses of 4.9%. That was worse than the stock market’s third-quarter decline of 4.6%, as measured by the Morningstar US Market Index.
For the year through Sept, 30, the 60/40 index is down 20.1%, while the stock market declined 24.9%. That’s the biggest year-to-date loss in the index’s 22-year history for the first nine months of the year. It’s on track for its biggest decline since 2008, when the 60/40 index lost 30.4%. However, that year, bonds provided a cushion as stock were pummeled by the financial crisis. In 2008, the Morningstar Core Bond Index gained 5.9%.
“What we’re seeing right now is one of the largest drawdowns in history” for 60/40 portfolios, says Vanguard’s Aliaga-Diaz. “It’s been a very complex year for the 60/40 portfolio.”
Why Have 60/40 Portfolios Done So Poorly?
It all starts with understanding the relationship between stocks and bonds.
“The key benefit to diversification is that the assets you own—stocks and bonds, for example—won’t always move in the same direction at the same time,” says Morningstar’s Cheng.
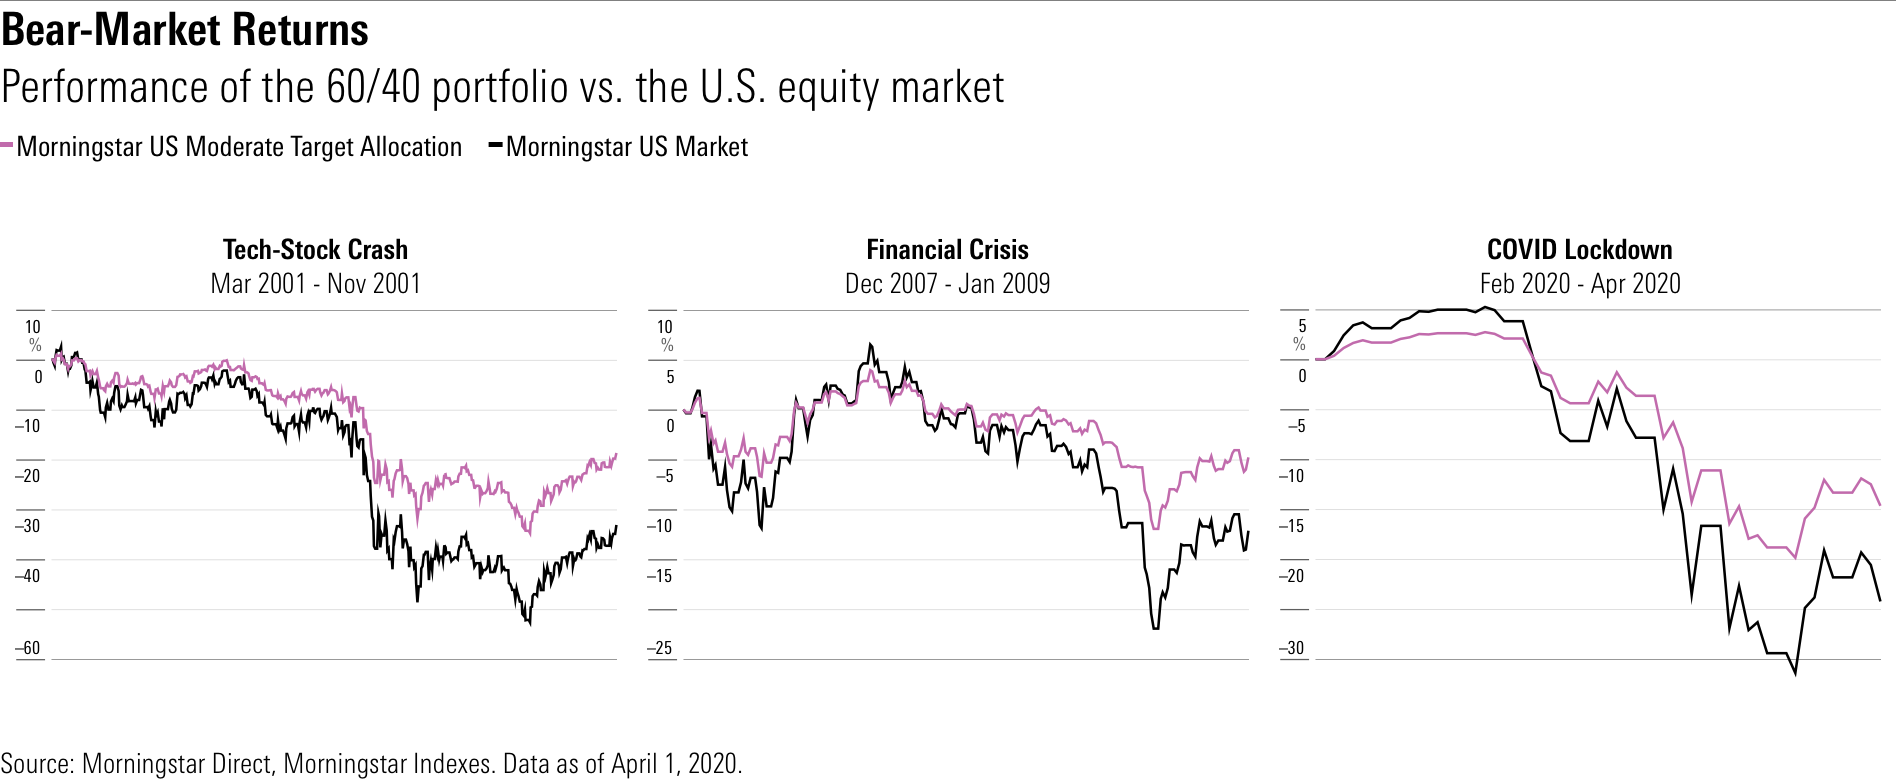
For years, stock and bond prices haven’t moved in the same direction at the same time. As was the case in 2008, for example, when equities saw big selloffs, bonds have historically provided positive returns, or at least helped to minimize portfolio losses.
The most common way to measure the relative movements between stocks and bonds is through a statistic known as correlation. Correlation measures the tendency of different investments to move up or down at the same time. When measuring correlation, a reading of 0 indicates stocks are moving with no relationship, while 1 means gains or losses in perfect unison. Positive readings mean direct correlations. Negative readings are known as having inverse correlations.
Over the past 10 years, correlations between most bonds have been negative or near zero in comparison to the U.S. stock market (with the key exception of corporate bonds, which behave more similarly to stocks). This year, correlations have shifted drastically.
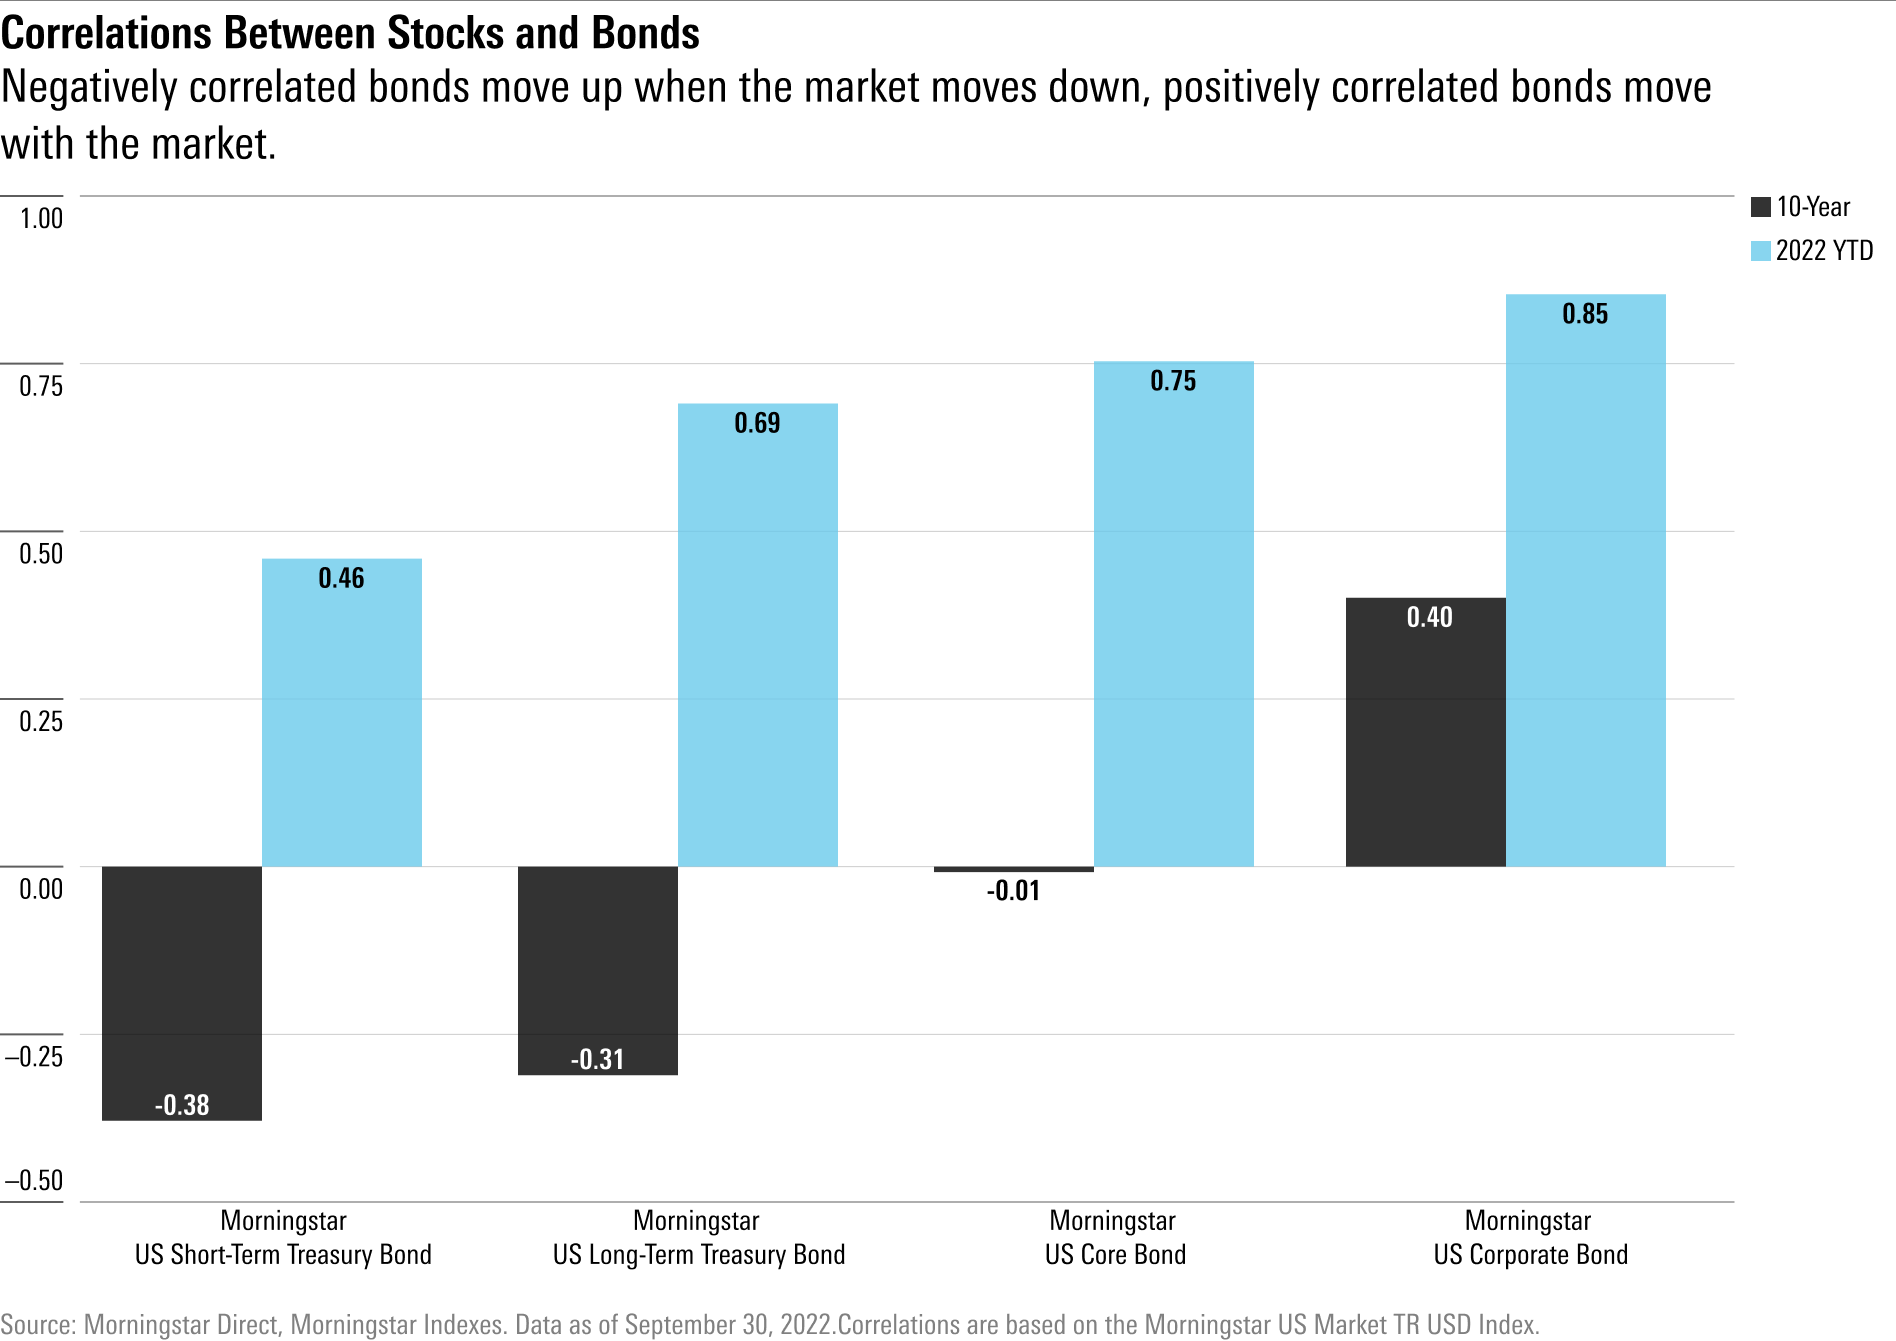
However, stock/bond diversification hasn’t worked well this year in large part because of unexpectedly high inflation, which is not good for either stocks or bonds.
“This year has been so difficult because of the transition from a low-yield, low-inflation environment to a higher-inflation, higher-yield environment,” Aliaga-Diaz says. “It’s impacting both stocks and bonds at the same time.”
Morningstar’s Cheng notes that rising rates don’t always lead to a positive correlation between stock and bond prices. “It’s not just about the absolute level of inflation—which is very high right now—but the uncertainty around it, and the market’s confidence in whether the Fed can slow it down,” she says.
Correlations Change Over Time
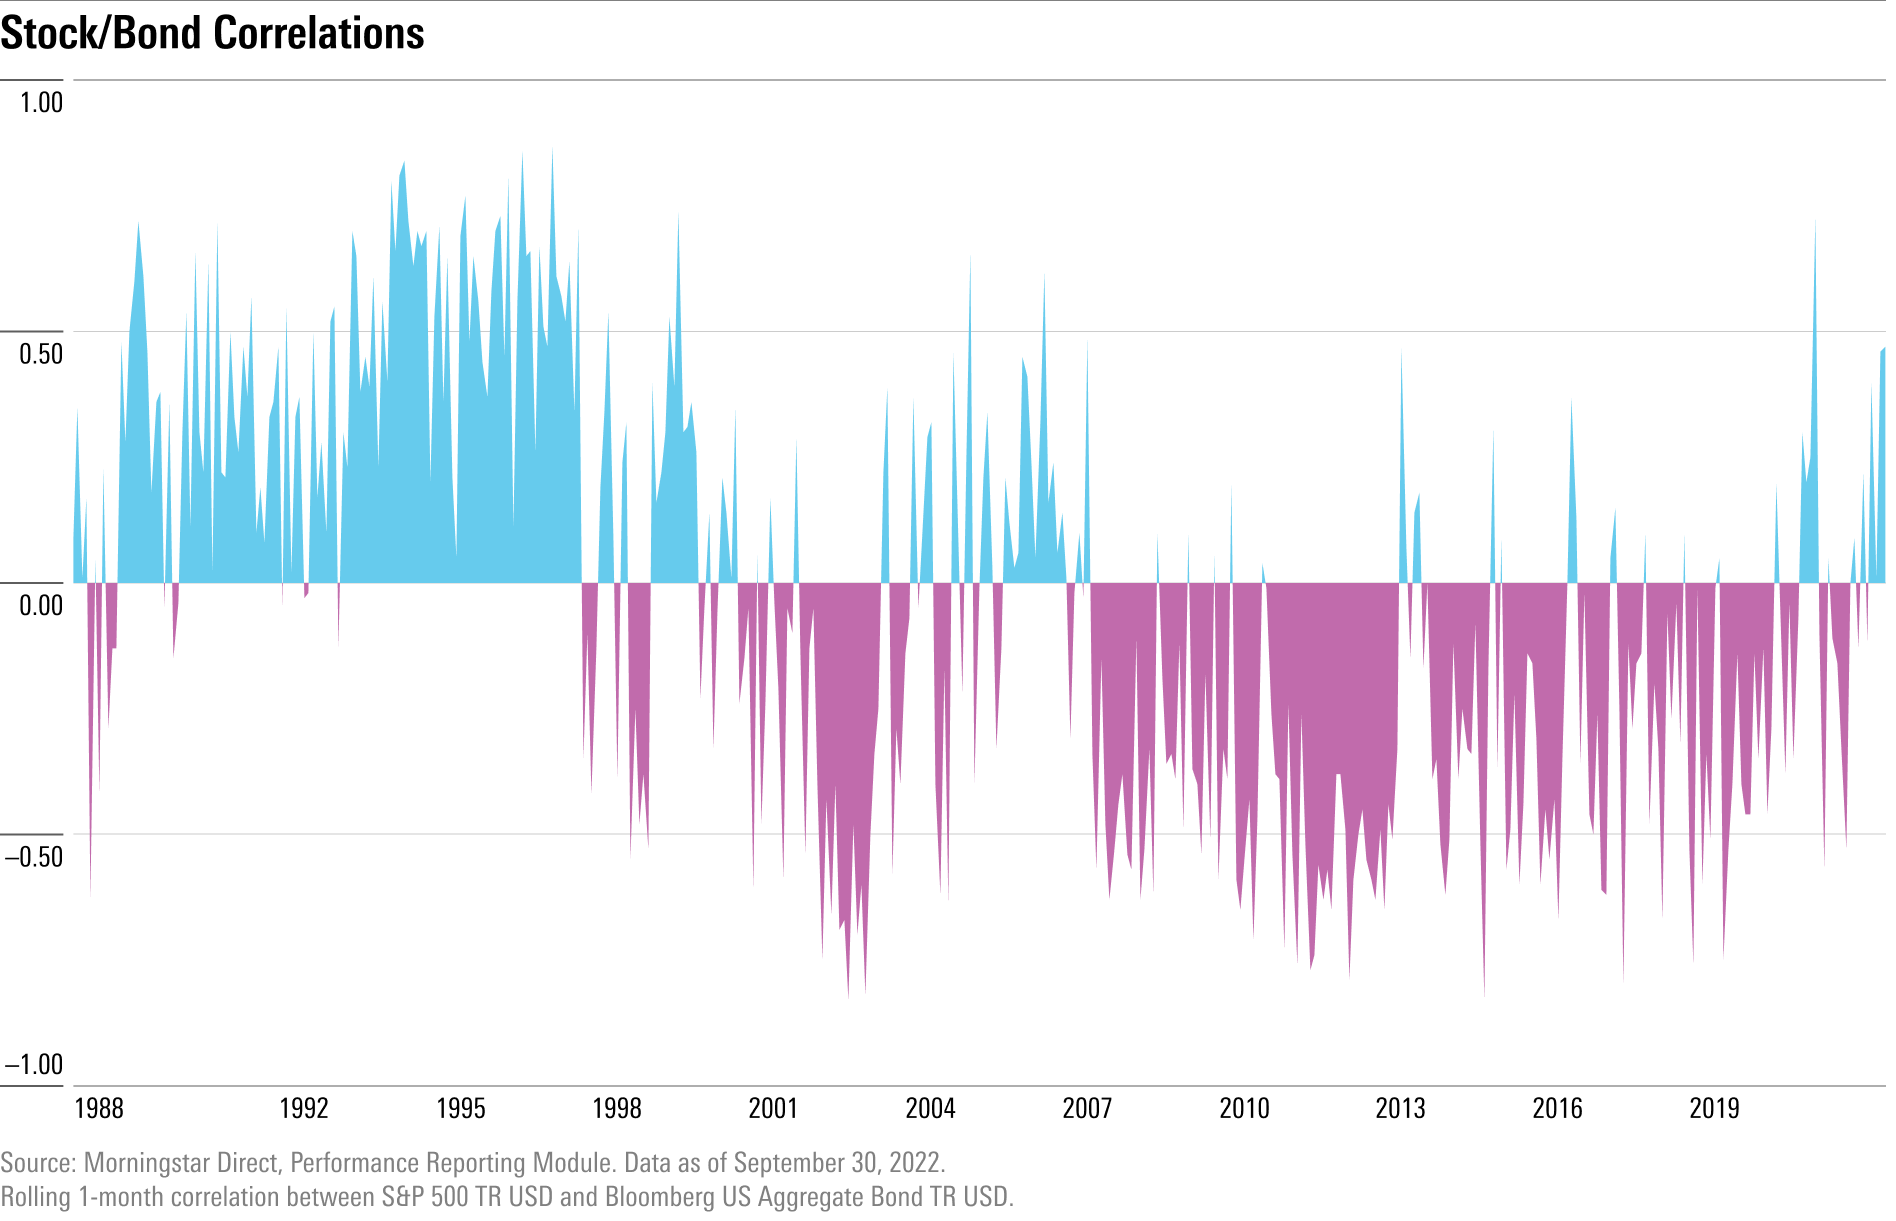
Long-term changes in the relationship between stocks and bonds haven’t happened often. Typically, correlations between stocks and bonds go through long cycles.
For the past 20 years, the correlation between the S&P 500 and the Bloomberg US Aggregate Bond Indexes has been almost exclusively negative: When stocks prices fall, bond prices rise, and vice versa.
“Stock/bond correlations first began their long-standing negative correlation trend in the 1990s,” Cheng says. “The Fed had introduced a more mature policy framework, which reduced uncertainty around inflation.”
For the 30 years before that, up until about the late 1980s, the correlation between stock and bond prices had actually been positive, similar to what it’s been this year.
“We had a couple periods where it popped into [negative] territory, but the long-term correlation was mostly inverse in an inflationary backdrop,” says Liz Ann Sonders, chief investment strategist at Charles Schwab. At that time, “when bond yields were going higher it was because inflation was brewing, and without a commensurate improvement in growth, it was an ugly backdrop for stocks.”
That’s very different from what became the norm over the last two decades, when bond yields would rise because the economy was growing strongly, but without significant inflation, Sonders says. That allowed for stocks to rally even as bond prices slumped.
Will the 60/40 Start to Work Again?
The debate is on over the long-term outlook for 60/40 portfolios.
Cheng says that, going forward, the dynamic depends on what happens with inflation, noting that the Fed has already been very clear that inflation is its number-one goal. “If the Fed’s moves can reduce uncertainty around inflation over time, then the negative correlation between stocks and bonds could come back,” she says.
Still, Cheng sees bonds providing value as part of investors’ portfolios no matter what happens next. “With yields much higher now than they were at the end of last year, we still see the value of fixed income in the portfolio—even if both stocks and bonds continue to behave poorly,” she says. “During recessions, fixed income will provide a strong ballast for the portfolio. As yields rise, bonds provide a sturdier cushion.”
Vanguard’s Aliaga-Diaz is more confident in a brighter outlook for the 60/40 portfolio. “The reality is that, as we move forward, we may well go back to more normal relationship between stocks on bonds.” Aliaga-Diaz says that the markets are in a turbulent, transitional period. “Prices have to reset to new, lower levels for both bonds and stocks. Once they find a new equilibrium—wherever it is—the old correlations will still be there.”
Others say that we are entering a new period in the markets. Schwab’s Sonders thinks that things aren’t going to stay as they’ve been over the past decade. “We’re at the beginning of a secular change in the backdrop as it relates to stocks and bonds.”
Sonders points to a changing backdrop of factors including demographics, globalization, productivity, technology, and access to cheap labor: “So many of these forces have led to a two-decade-plus environment of disinflation, and today they are no longer as dominant.”
Even if the Fed is successful in getting a handle on core inflation, she says, the markets will remain in a more secular inflationary backdrop. “I still think inflation comes down and comes down in a meaningful way,” she says. “But the inflation plane may land at a slightly higher elevation and we’re going to have more volatility in inflation.”
Correction: In a previous version of this story the name of the head of portfolio construction and chief Americas economist at Vanguard Group was misspelled. The correct spelling of his name is Roger Aliaga-Diaz.
The author or authors do not own shares in any securities mentioned in this article. Find out about Morningstar’s editorial policies.
/cloudfront-us-east-1.images.arcpublishing.com/morningstar/AGAGH4NDF5FCRKXQANXPYS6TBQ.png)
/cloudfront-us-east-1.images.arcpublishing.com/morningstar/ZYJVMA34ANHZZDT5KOPPUVFLPE.png)
/cloudfront-us-east-1.images.arcpublishing.com/morningstar/QFQHXAHS7NCLFPIIBXZZZWXMXA.jpg)
:quality(80)/s3.amazonaws.com/arc-authors/morningstar/ba63f047-a5cf-49a2-aa38-61ba5ba0cc9e.jpg)