
First-Quarter Market Insights in 8 Charts
Our market commentary covers the lasting impact of the Trump Administration’s trade policies, the rise of SPACs, and more.

U.S. equity markets surged higher in the first quarter of the year, riding the wave of larger-than-expected fiscal stimulus and progress on coronavirus vaccine distribution. Together, the second and third rounds of stimulus ($900 billion in the fourth quarter of 2020 and the $1.9 trillion relief package signed in March) add up to about 14% of U.S. gross domestic product--a level of spending that is unprecedented in U.S. history.
Even amid raised volatility, U.S. equity markets finished their strongest month since November. Value funds outperformed growth in both February and March, with February's margin being the largest for value in 10 years. Meanwhile, even with easy-money commitments from the Federal Reserve, latent expectations rose for inflation, leading to losses in interest-rate-sensitive corners of the market.
Every quarter, Morningstar's quantitative research team reviews the most recent U.S. market trends and evaluates the performance of individual asset classes. We then share our findings in the Morningstar Markets Observer, a publication that draws on careful research and market insights. (Morningstar Direct and Office clients can download the report here.)
Here are some of the market insights from our latest quarterly review:
Risk-Based Portfolios Surpass Pre-Pandemic Highs
As expected, an aggressive portfolio with a larger allocation to stocks was able to deliver superior returns to its moderate and conservative counterparts over the long term. This quarter, as shown below, all three portfolios not only managed to recover their losses from the COVID-19 crash, but were also able to surpass their pre-pandemic highs.
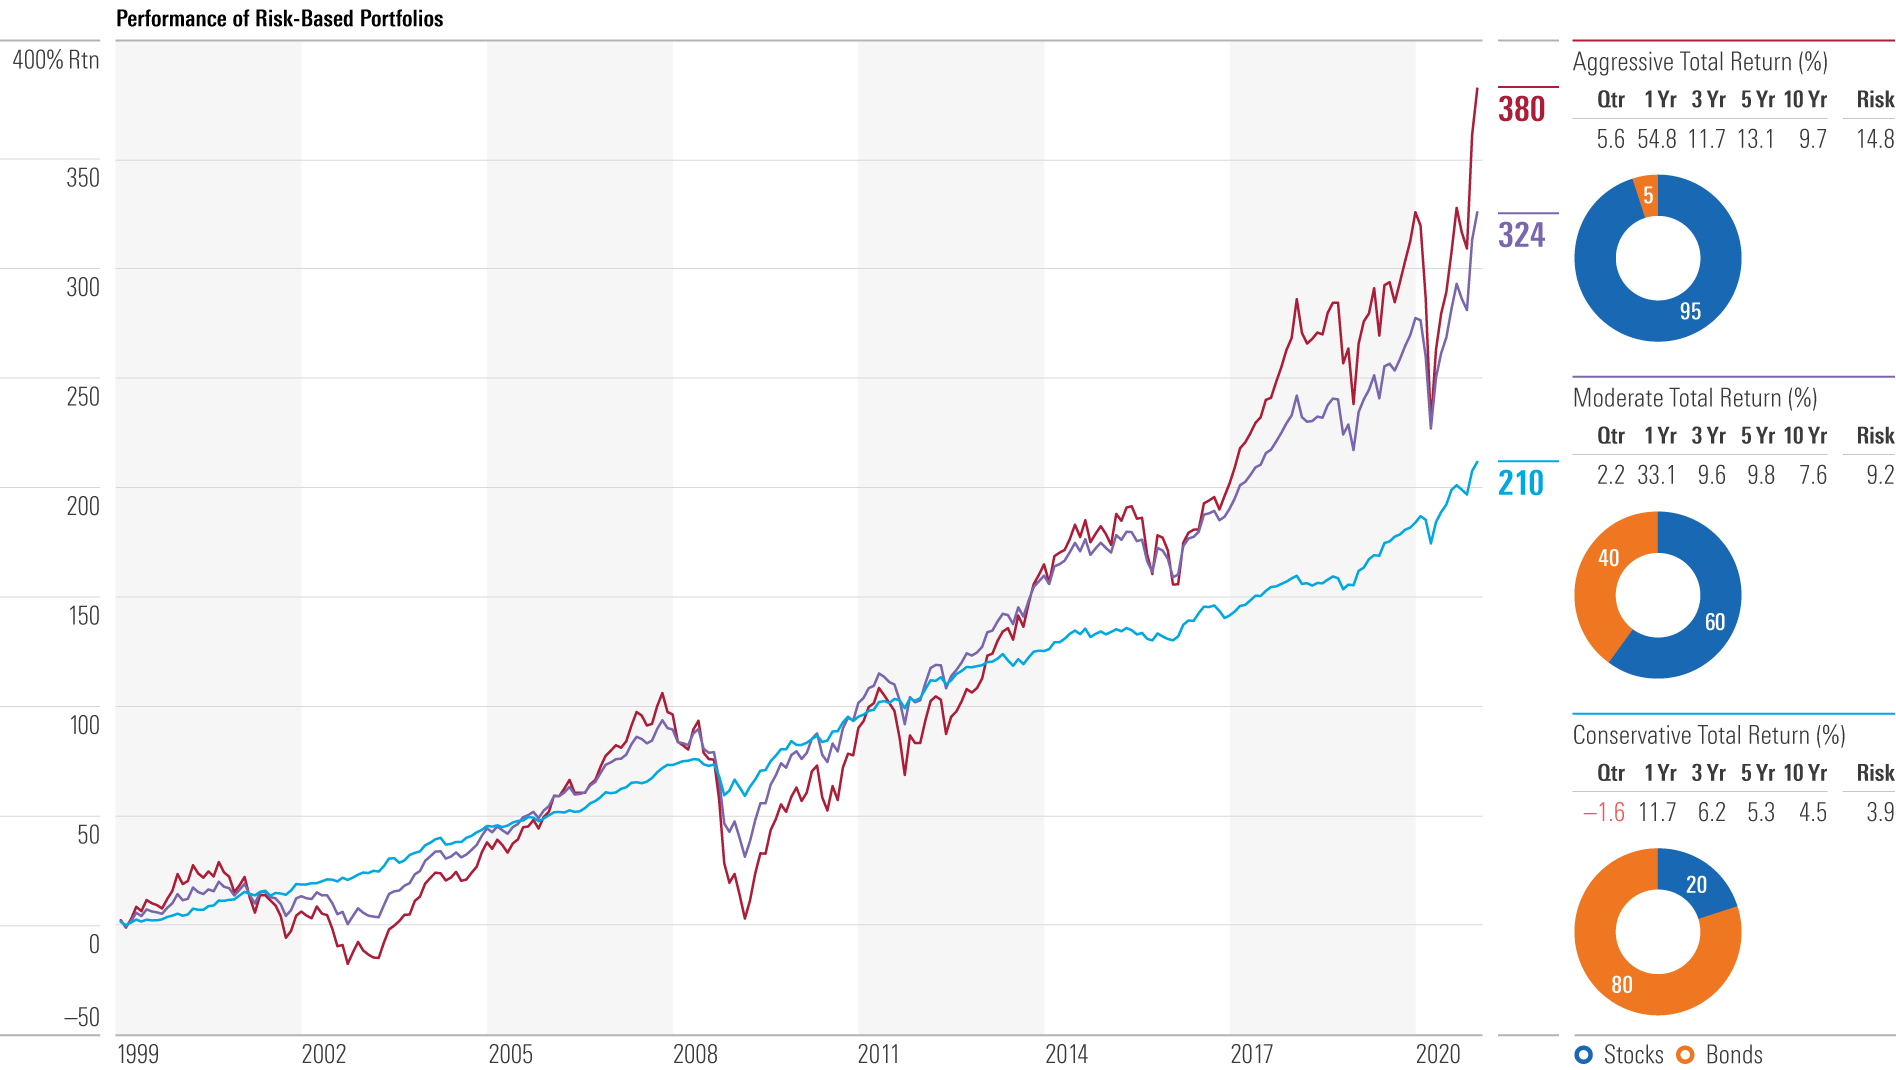
- Source: Morningstar. Data as of March 31, 2021.
Factor Exposures That Had Been Hot Continue to Turn Cold
Following the precedent set at the end of 2020, longtime outperforming growth-focused strategies fell to the back of the pack, along with funds targeting high-flying momentum and low dividend-paying stocks. Meanwhile, small-cap and value-focused strategies, which are more likely to have their fortunes tied to the strength of the U.S. economy, took the lead. As shown below, high volatility and liquidity exposures continued to hold their advantage.
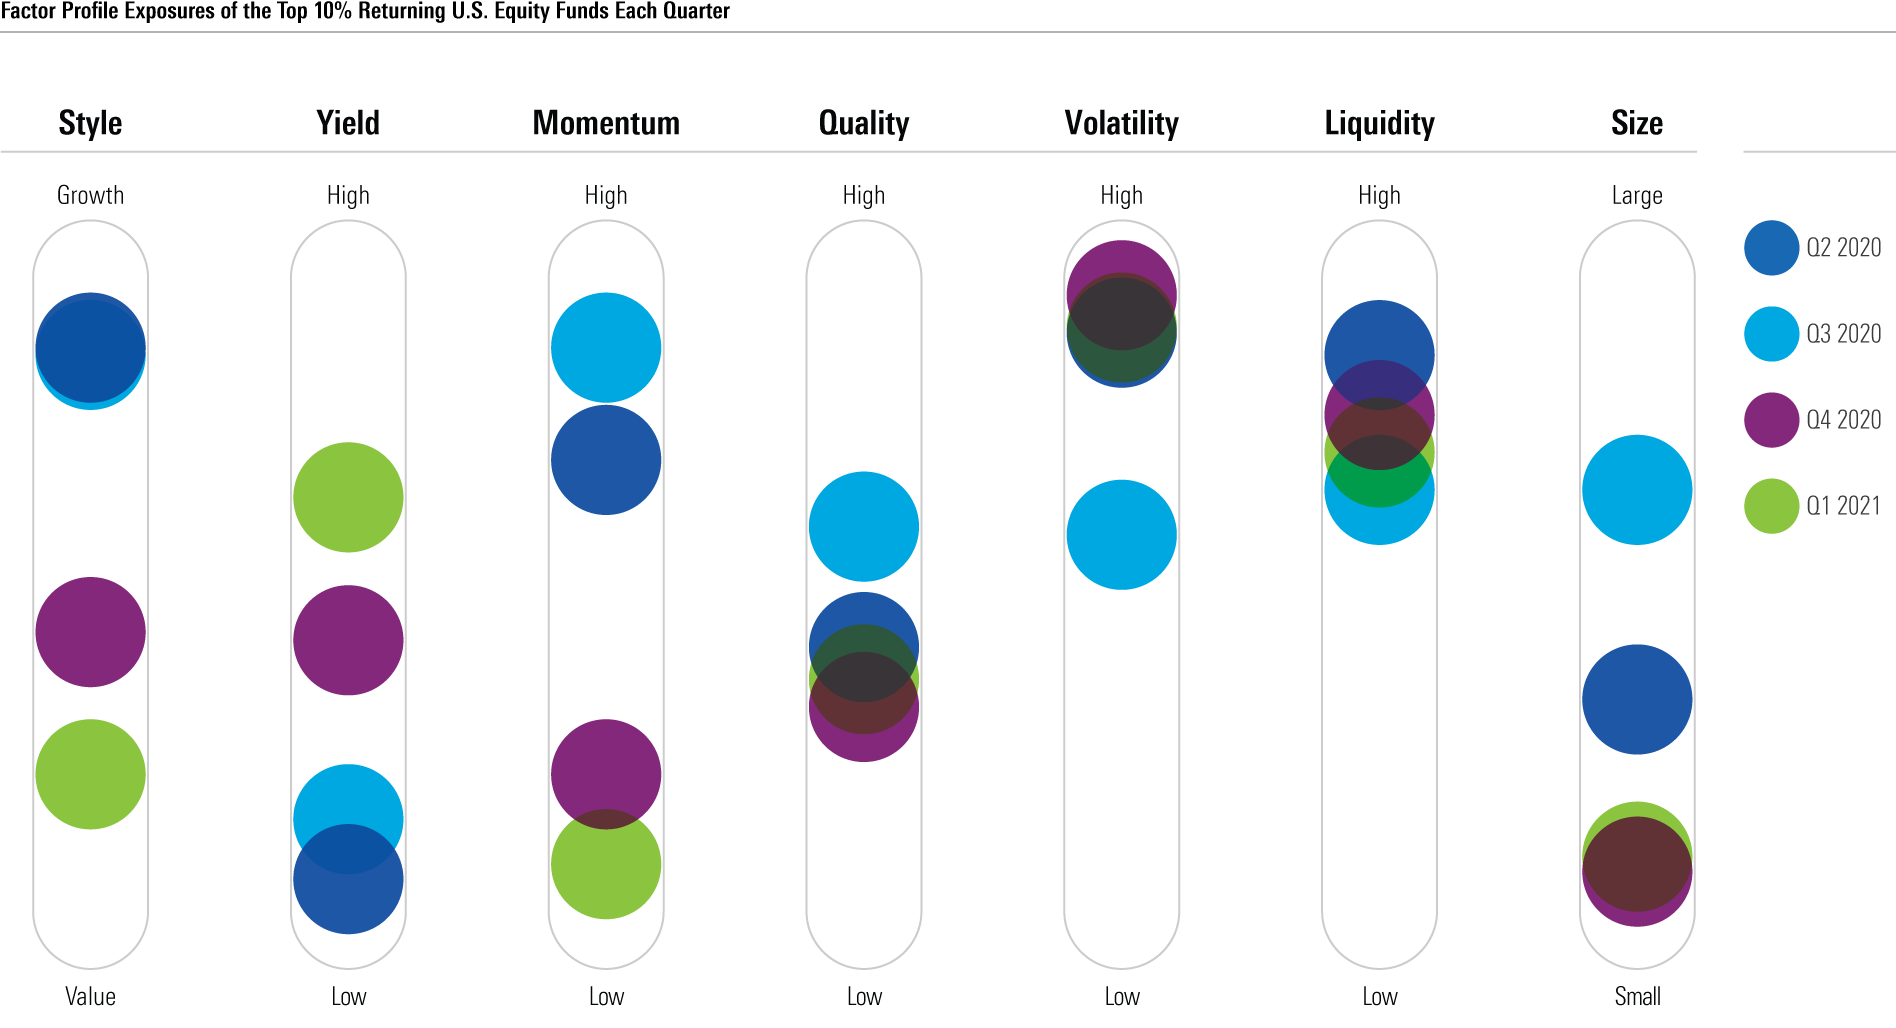
- Source: Morningstar. Data as of March 31, 2021.
Business Sentiment May Not Be as Optimistic as Indicators Suggest
While the majority of indicators suggest the U.S. economy is on increasingly solid footing, there are notable discrepancies in the data. One startling example comes from the National Federation of Independent Business’ monthly survey of small business managers, which is shown below. Respondents shared extremely poor expectations for sales and expansion, despite corroborating that inflation pressure is building and jobs are once again hard to fill. It’s unclear if this is a sign of impending stagflation.
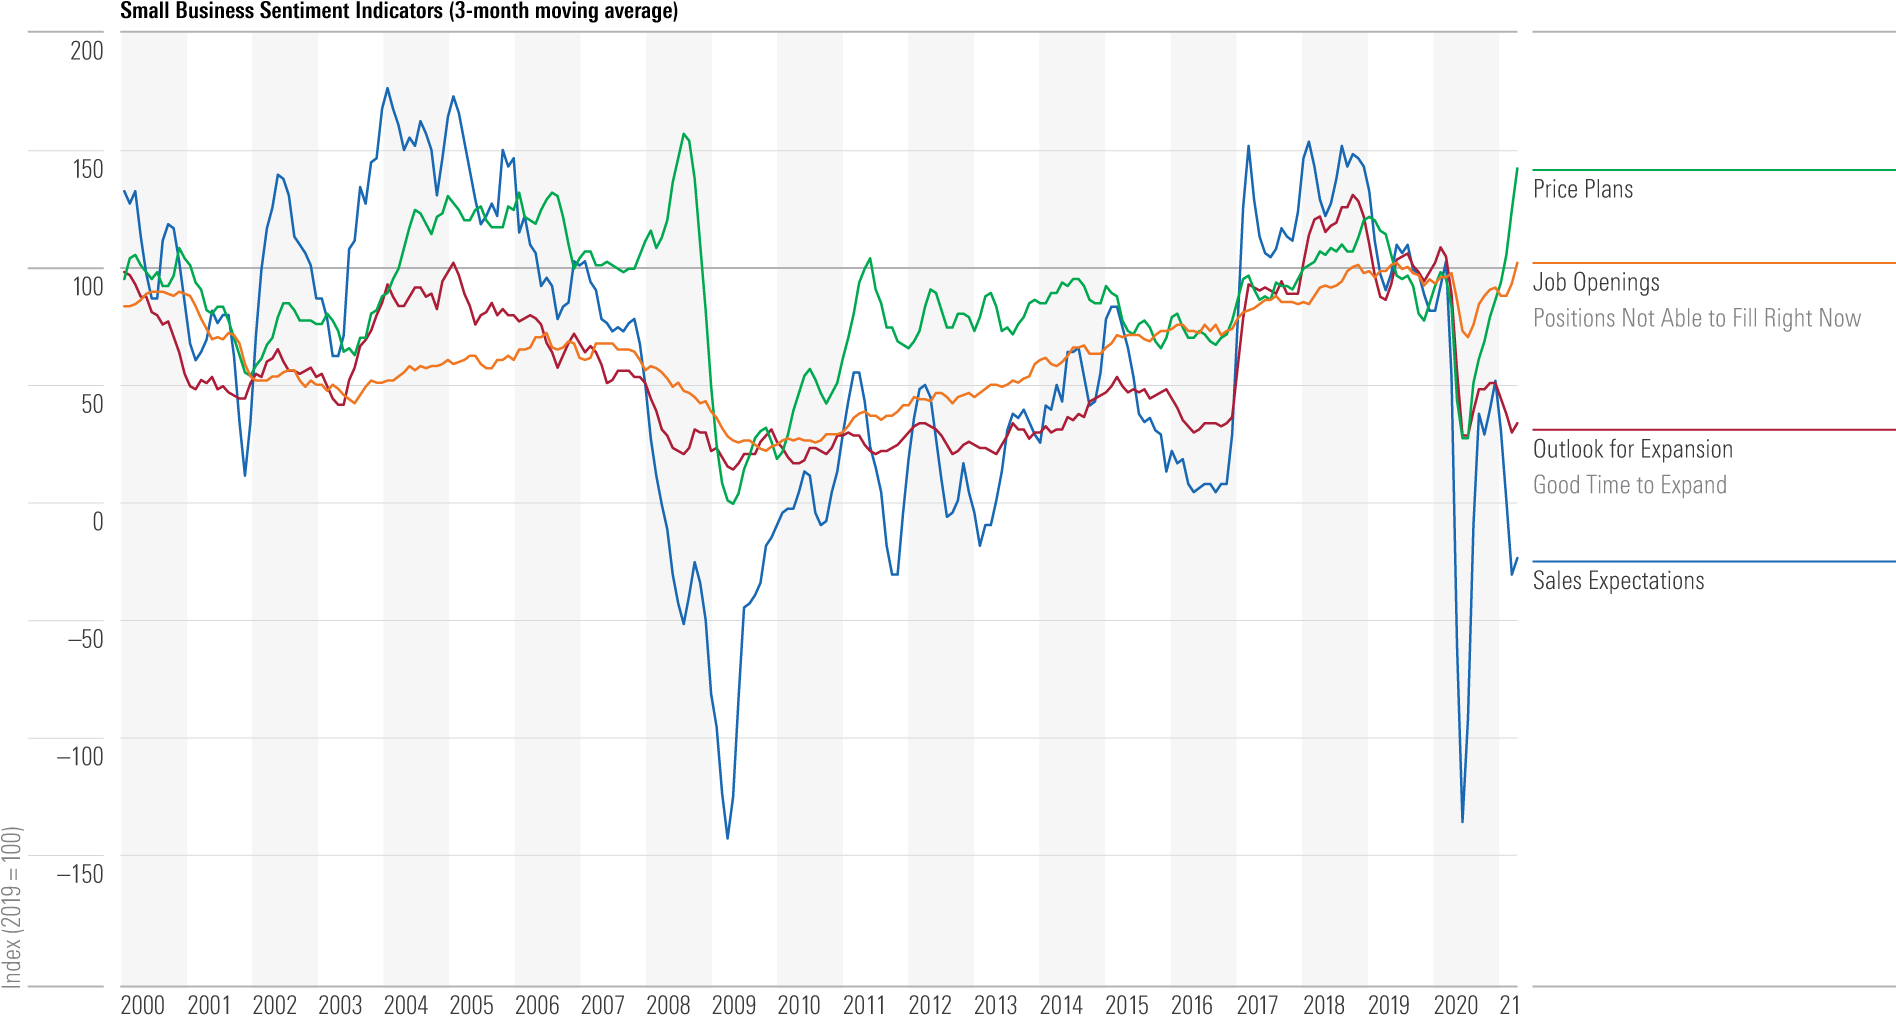
- Source: National Federation of Independent Businesses. Data as of March 31, 2021.
Equity Market Valuations Push Higher
The cyclically adjusted price/earnings ratio of the S&P 500 assesses whether the market is under- or overvalued using historical earnings adjusted for inflation. As shown below, it continued to rise this quarter to 36, which suggests extreme overvaluation in the stock market. That rate has only been surpassed once in American history--in the late 1990s, before the dot-com bubble burst.
The chart also shows the 12-month forward P/E ratio, which uses analysts’ earnings forecasts instead of historical earnings to assess mark valuation. This ratio is also near all-time highs.
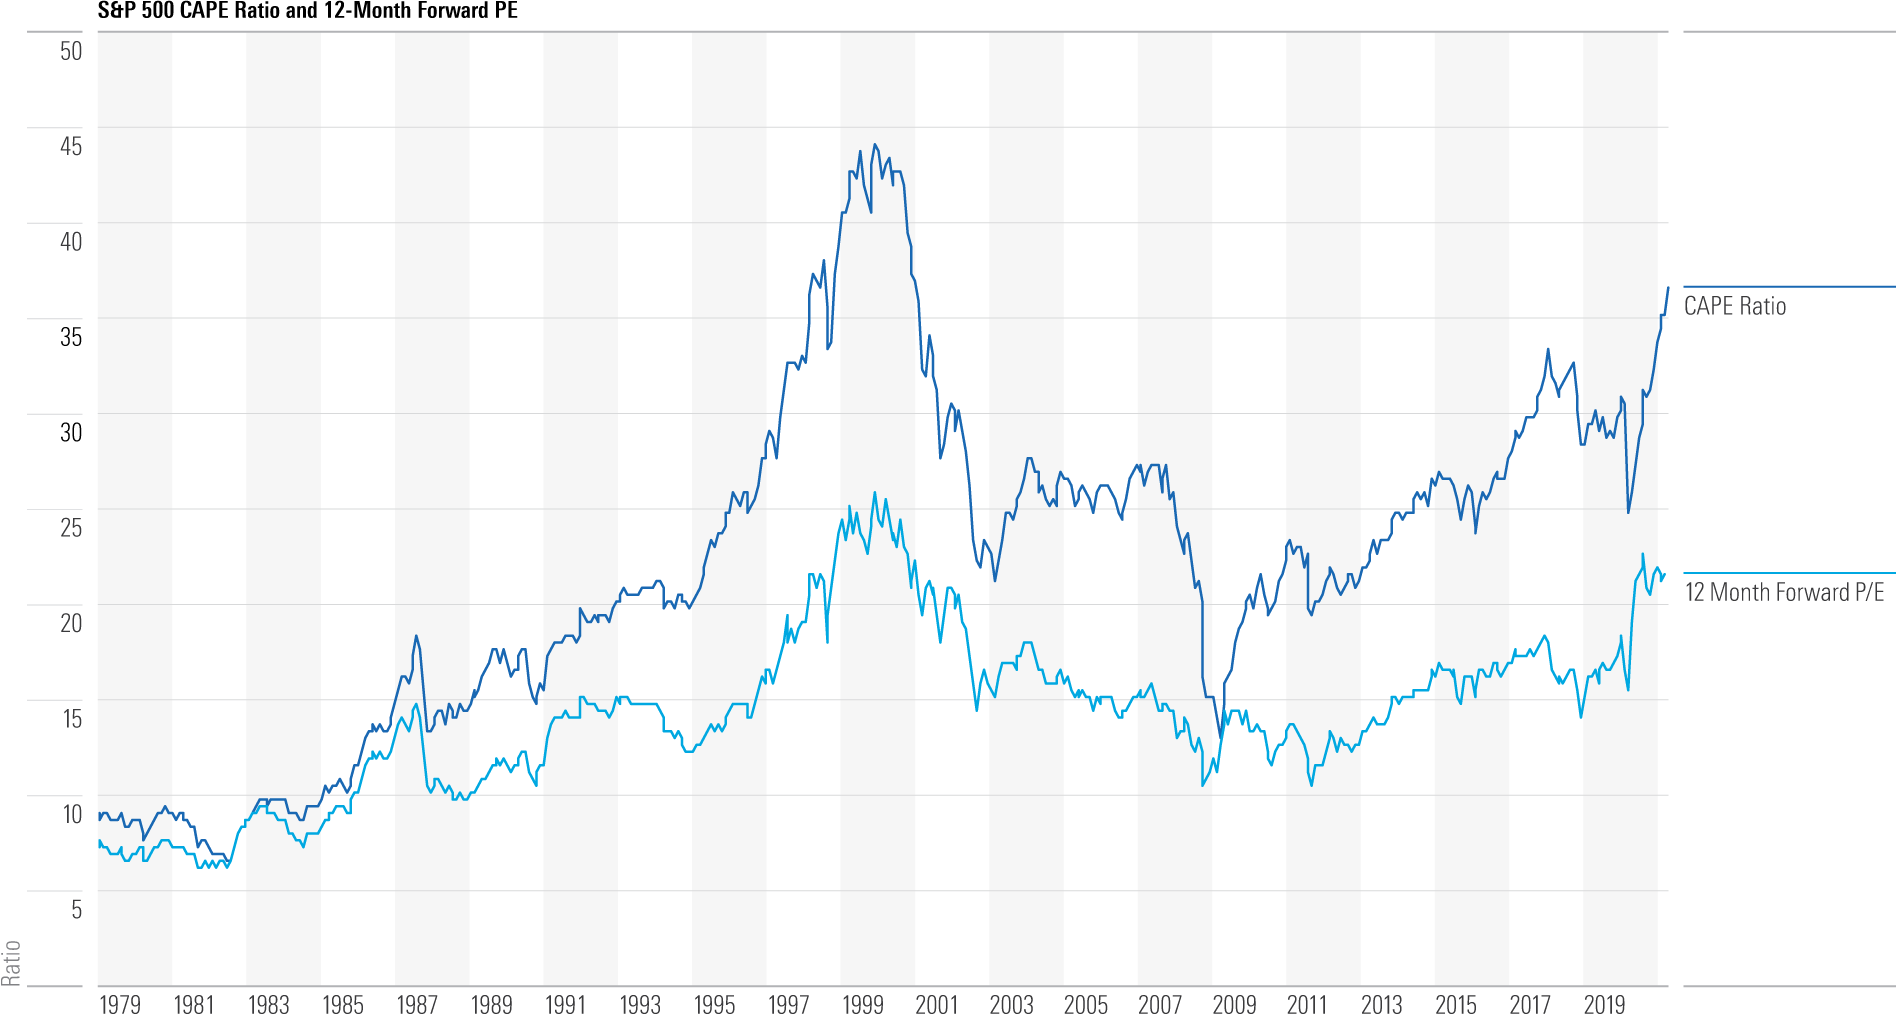
- Source: Macrobond Financial. Data as of March 31, 2021.
SPAC-tacular Growth
Special-purpose acquisition companies are essentially shell companies set up by investors with the sole purpose of raising money through an IPO to eventually acquire another company.
As shown below, SPACs have raised over $186 billion over the past 10 years but have particularly surged within the last couple years, as 2020 and 2021 account for a combined 82% of that growth. “This appears to be more of an arbitrage between private and public market valuations than any added value,” explains Morningstar chief market strategist Dave Sekera. “It might also signal that valuations in public markets are getting ahead of themselves.”
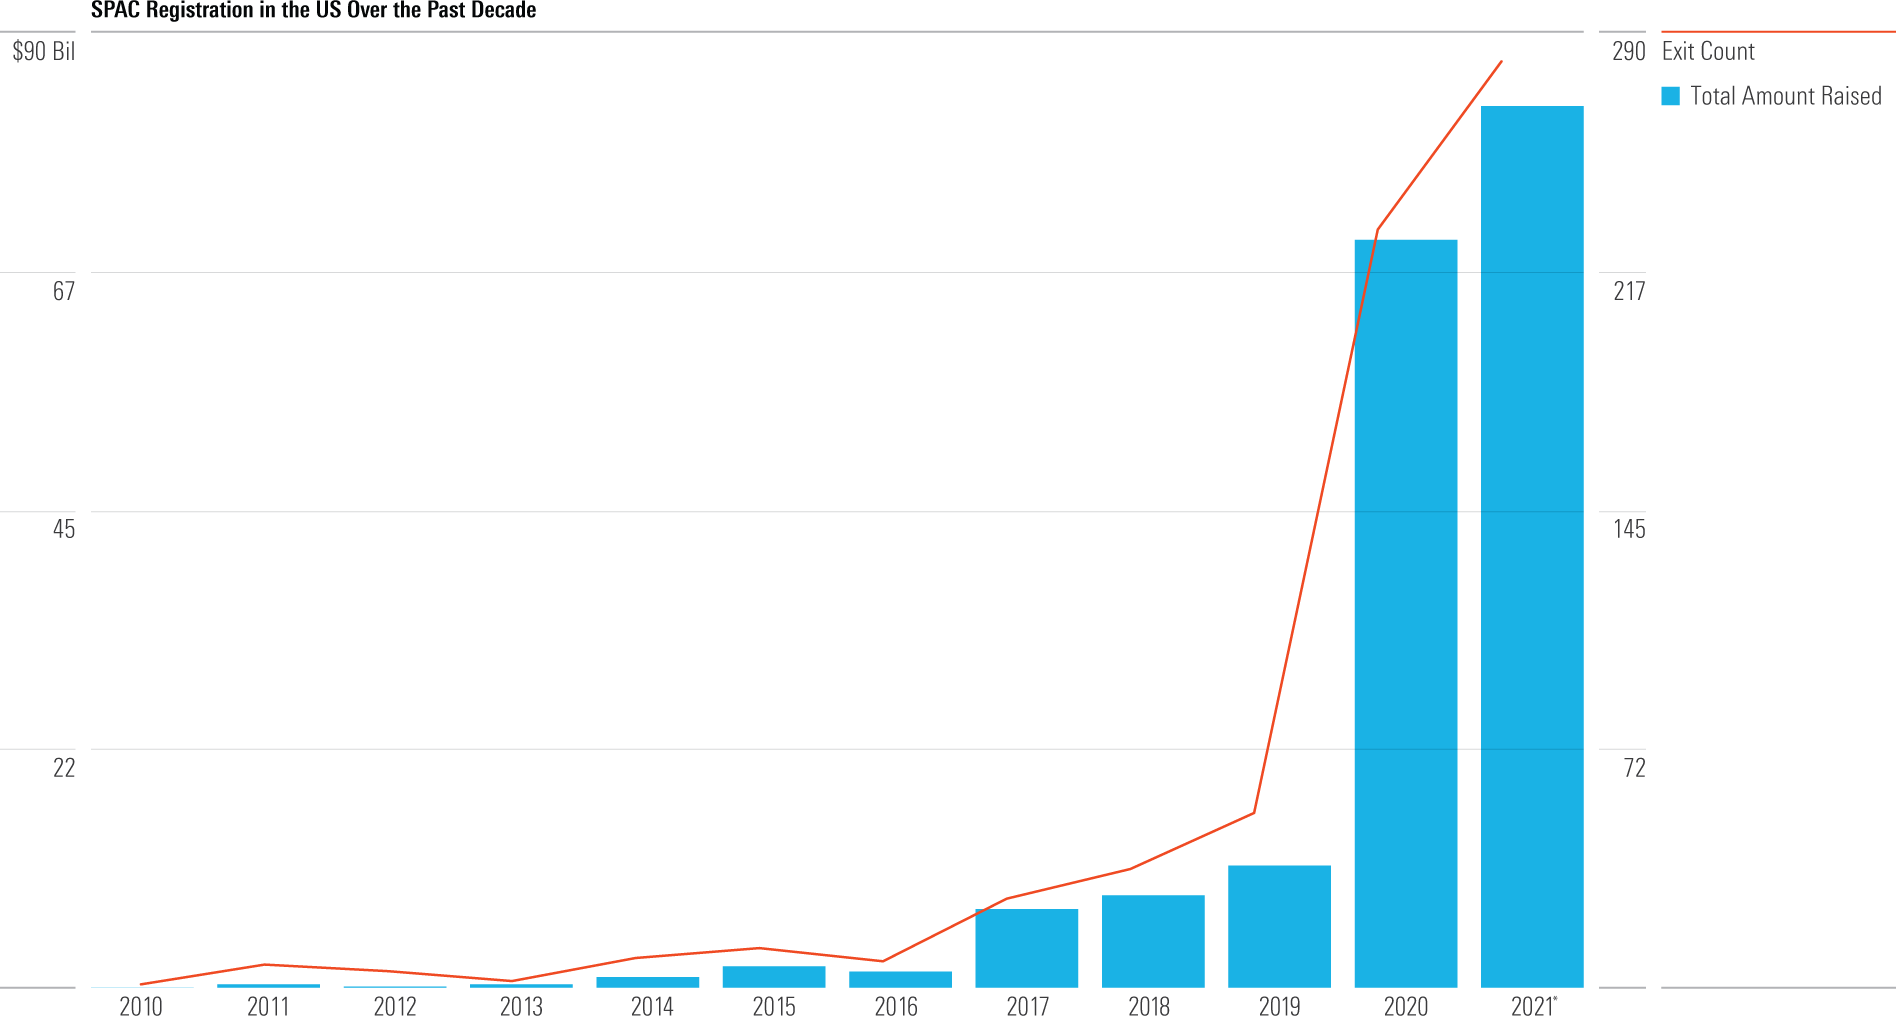
- Source: PitchBook. Data as of March 31, 2021.
Thematic ETFs Have Room to Run
Thematic exchange-traded funds, which move away from the original tenets of index investing, have ballooned in popularity in recent years, contributing to over 74% of U.S. ETF launches in 2020. The funds target narrow areas of the market and provide investors the opportunity to cash in on a promising trend. The chart below shows the growth of the thematic universe's subsectors over the past year and a half.
There’s high risk to these funds, since by the time the ETF hits the market, the theme may have already played out. However, some sub-sectors like alternative energy and fintech have provided investors with impressive outperformance.
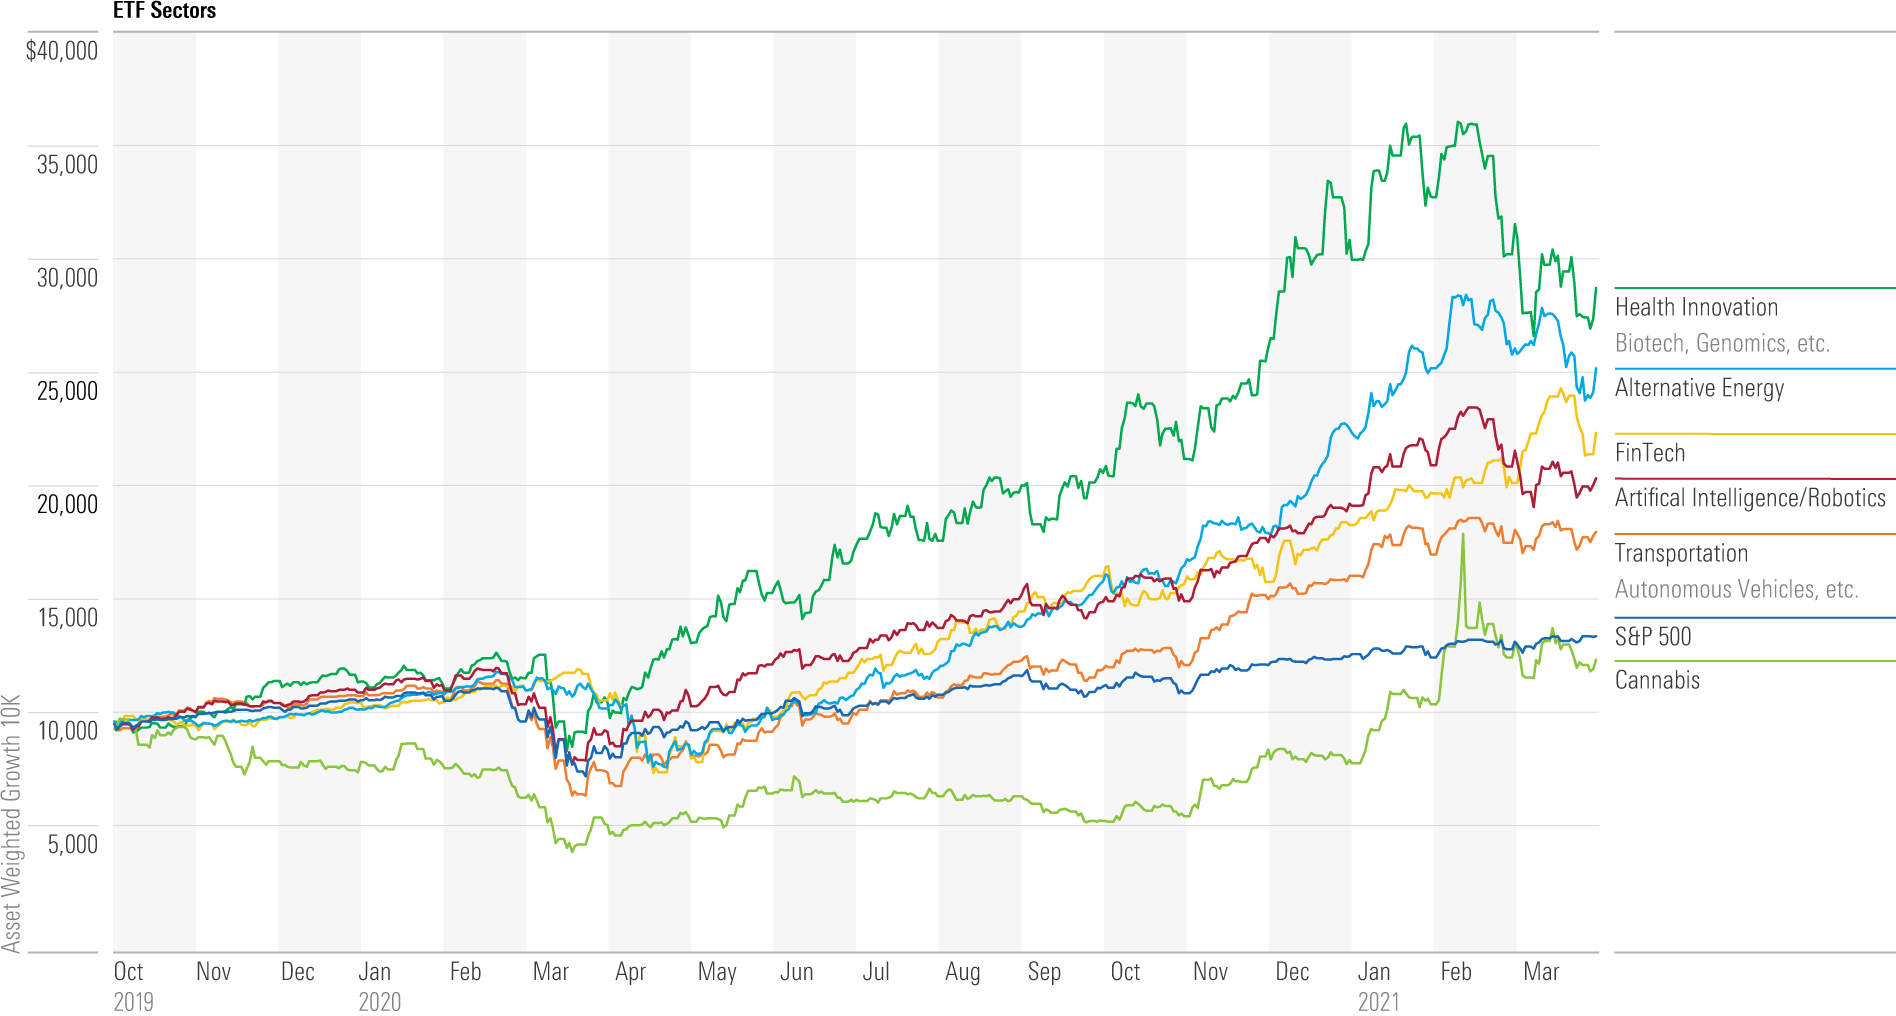
- Source: Morningstar. Data as of March 31, 2021.
Trump Administration’s Trade Policies Have Lasting Effect
Despite the upending of global trade patterns in 2020, the dent that Trump Administration policies put in U.S. imports from China persisted throughout this year.
As shown below, a substantial portion of that trade shifted to the Association of Southeast Asian Nations, and Europe’s market share has increased as well. The import share from Canada and Mexico has remained consistent.
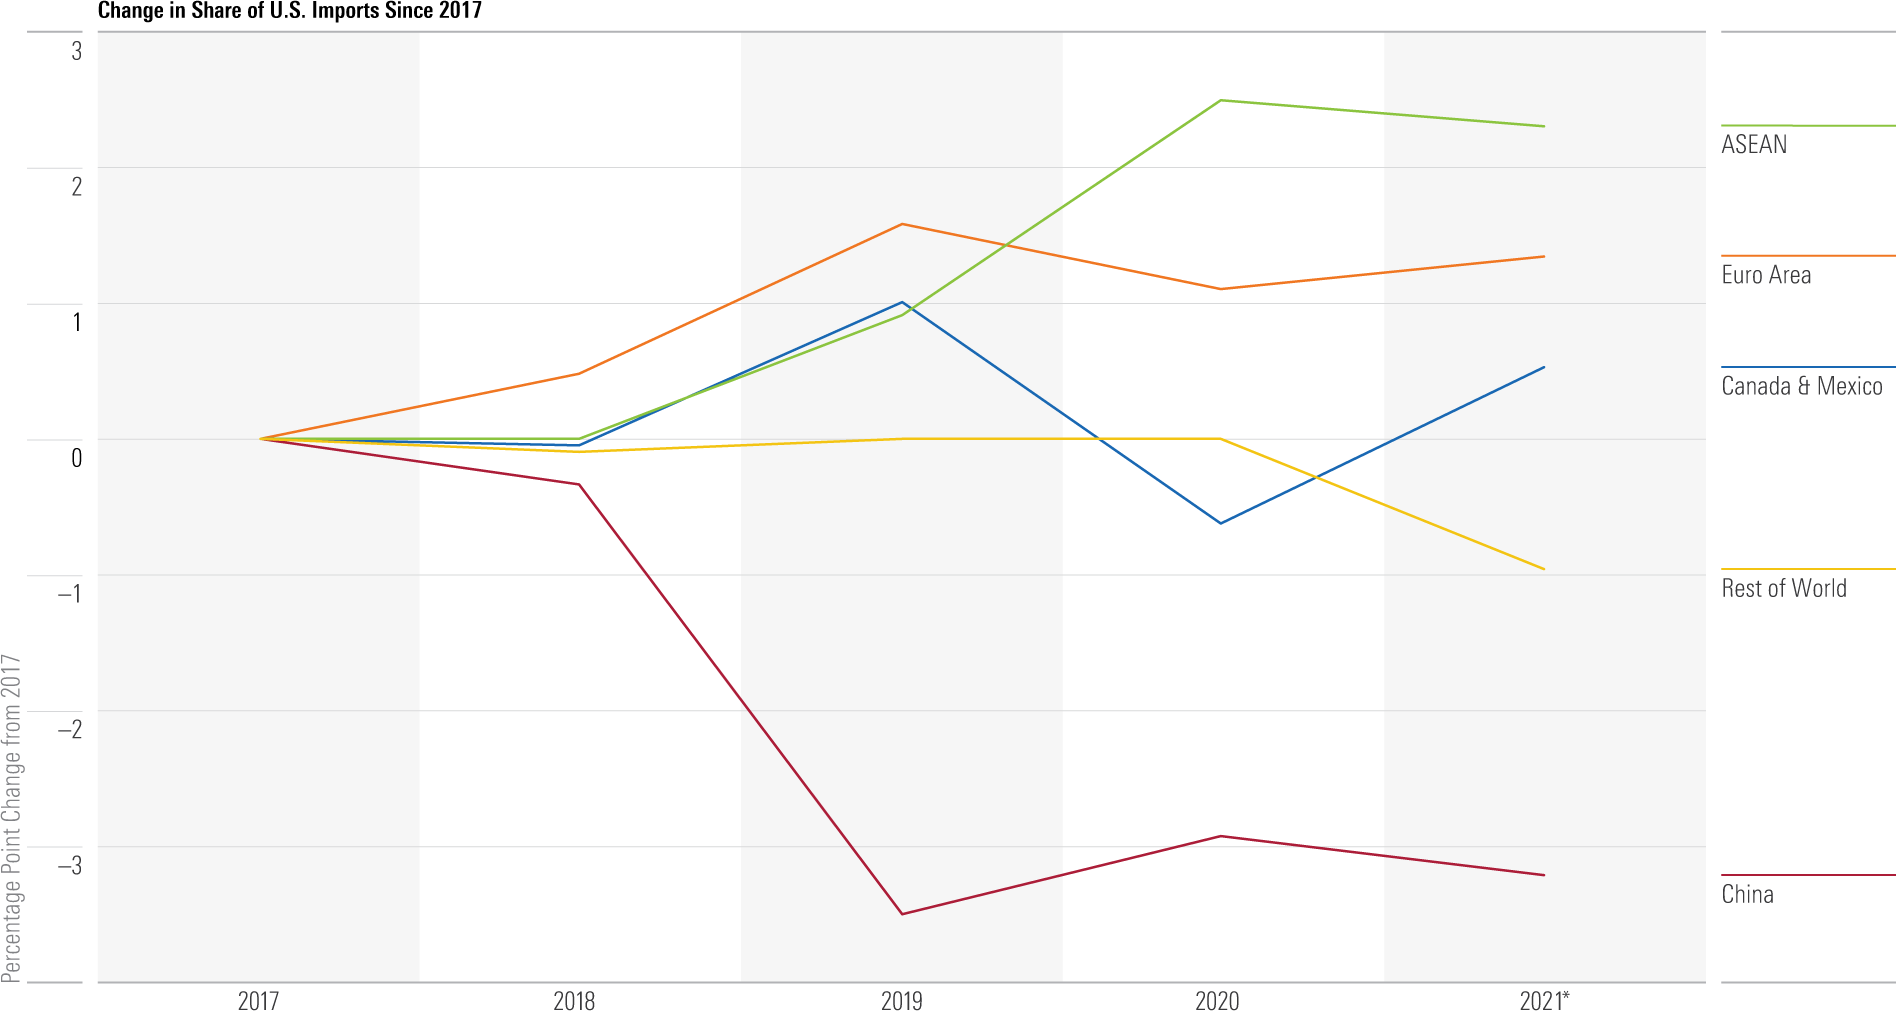
- Source: U.S. Census Bureau. Data as of March 31, 2021.
Production Input Prices Signal Substantial Disruption
The chart below shows changes to producers’ input prices over two periods: 2010-19 and since 2019. Many of the inputs experiencing the fastest inflation in the more-recent time period--such as unprocessed fuel and other unprocessed nonfood materials--had been among the least inflationary (or even deflationary) over the previous decade, and vice versa.
Adjusting to this dramatically different set of price signals may be creating some of the supply chain disruptions that have been reported across industries.
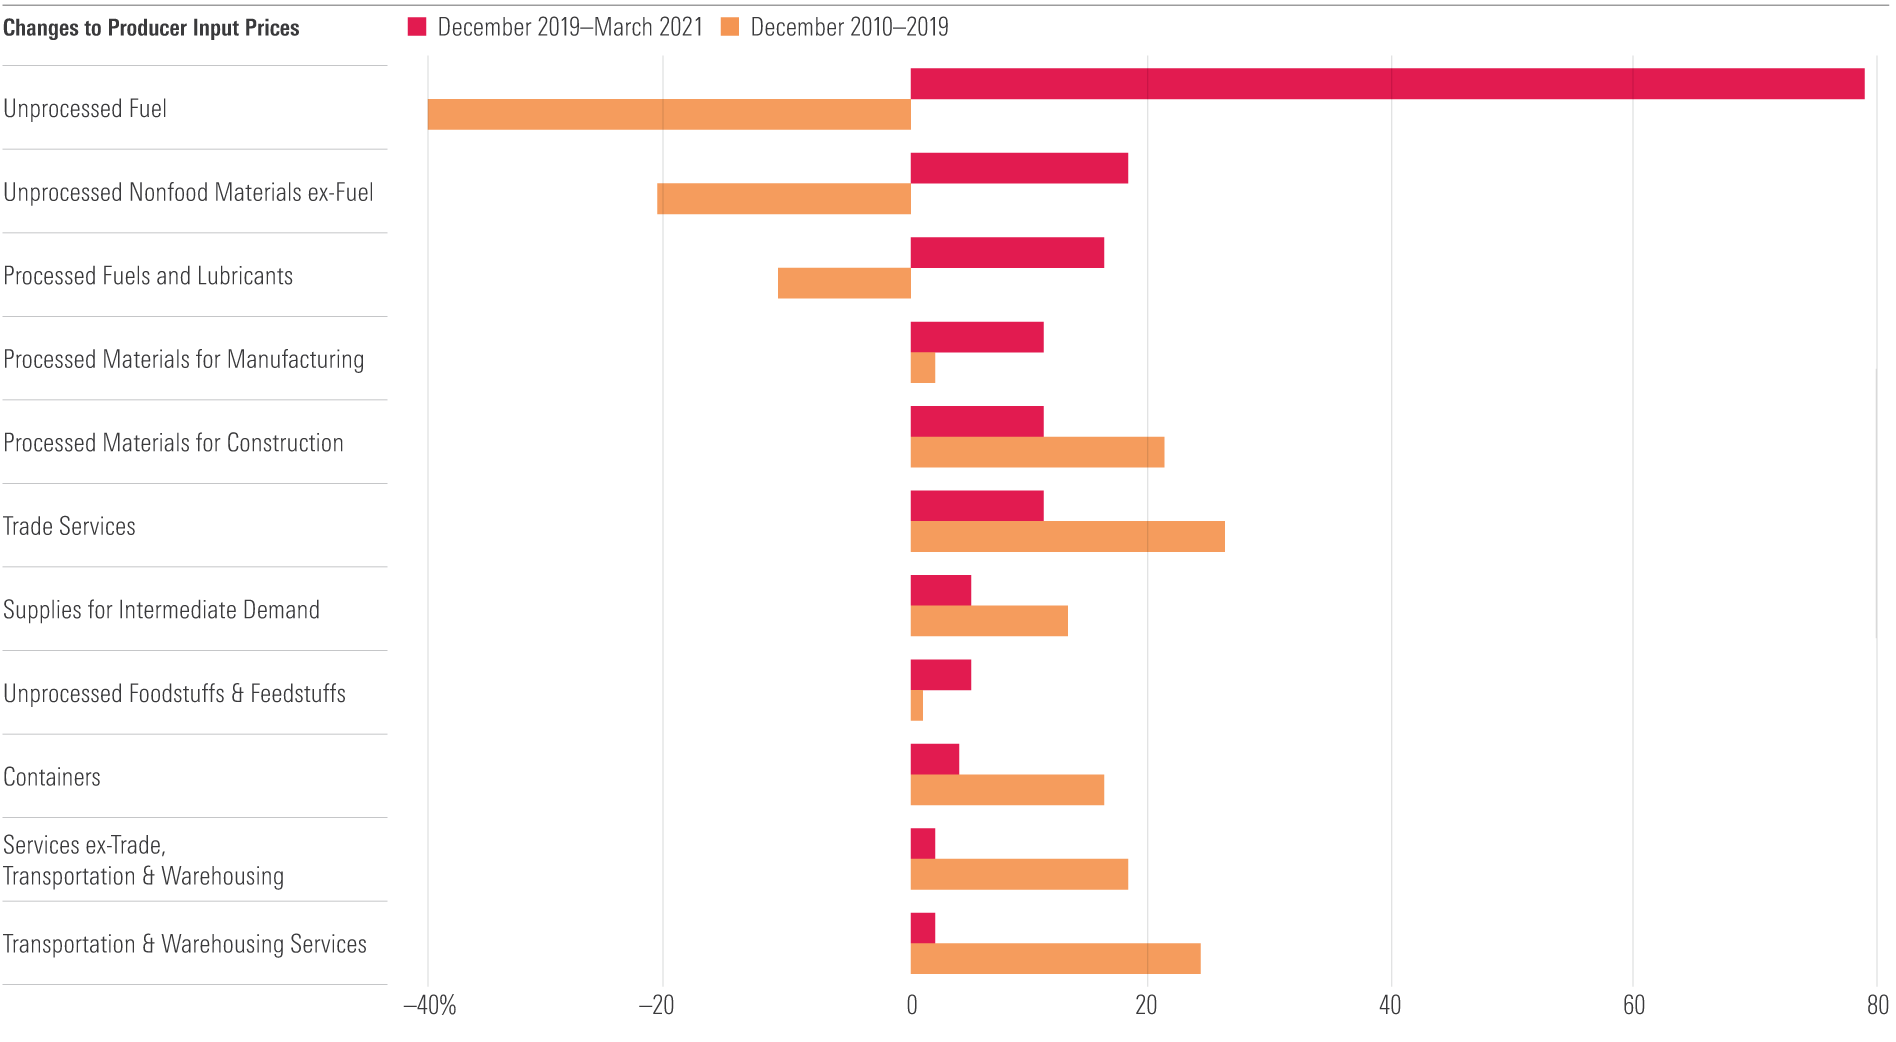
- Source: Bureau of Labor Statistics. Data as of March 31, 2021.
/cloudfront-us-east-1.images.arcpublishing.com/morningstar/T5MECJUE65CADONYJ7GARN2A3E.jpeg)
/cloudfront-us-east-1.images.arcpublishing.com/morningstar/VUWQI723Q5E43P5QRTRHGLJ7TI.png)
/d10o6nnig0wrdw.cloudfront.net/04-22-2024/t_ffc6e675543a4913a5312be02f5c571a_name_file_960x540_1600_v4_.jpg)