
Why Total Shareholder Yield Matters More Than Dividends
Dividends are just a tax-inefficient way to return capital to shareholders.


Many investors, especially those using a cash flow approach to spending, prefer cash dividends. From the perspective of the classical financial theory, this behavior is an anomaly.
The Dividend Policy Theory
In their 1961 paper Dividend Policy, Growth, and the Valuation of Shares, Merton Miller and Franco Modigliani famously established that dividend policy should be irrelevant to stock returns.
As they explained it, at least before frictions like trading costs and taxes, investors should be indifferent to $1 in the form of a dividend (causing the stock price to drop by $1) and $1 received by selling shares. This must be true unless you believe that $1 isn’t worth $1. This theorem has not been challenged since.
Historical Evidence on Dividends Versus Returns
Moreover, historical evidence supports this theory. Stocks with the same exposure to common factors—such as size, value, momentum, and profitability/quality—have the same returns regardless of the dividend yield. The following table (prepared by Dimensional at the end of 2022) showed the performance of dividend and nondividend payers over the period January 1979 to October 2022 after accounting for the exposure to common factors that explain returns: the single-factor capital asset pricing model; market beta; the Fama-French three-factor model, which adds size and value; the Fama-French five-factor model, which adds profitability and investment; and the Fama-French six-factor model, which adds momentum. If the intercept is positive (or negative), it shows that after controlling for those factors, the category outperformed (or underperformed). A t-statistic greater than 2 (or 3) indicates statistical significance at the 5% (or 1%) confidence level. The intercepts show monthly returns.
Performance of Dividend and Nondividend Payers, January 1979-October 2022
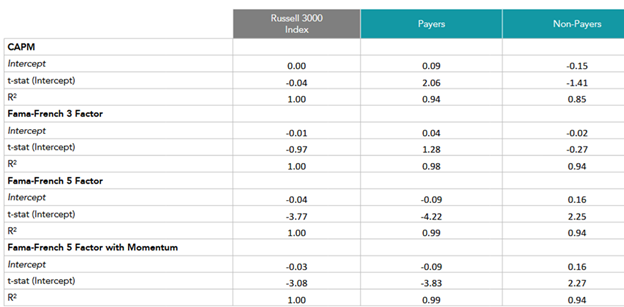
Note the extremely high R-squared values, indicating that the models did a good job of explaining performance. Also note that as we added factors, the explanatory power improved, as you would expect. If we do not control for profitability (neither the CAPM nor the Fama-French three-factor model control do so), the dividend payers generated alpha—though the alpha was only significant against the CAPM, not against the Fama-French three-factor model. However, once we included profitability (along with other factors), the alphas of the dividend payers turned negative and with much greater statistical significance. On the other hand, the alphas of the nonpayers, while negative relative to the CAPM and Fama-French three-factor models, were positive once we included profitability and the other factors and were significant at the 5% level.
Dividend Growth Strategies Show Similar Trends
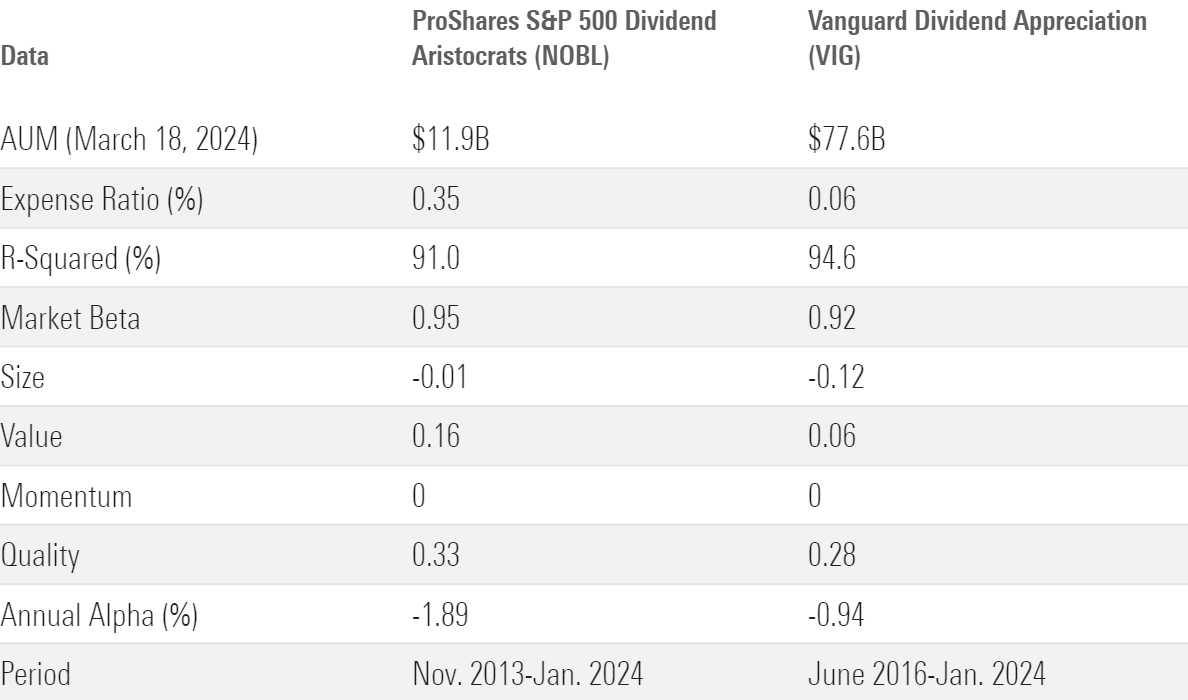
In my April 10, 2024, article for Morningstar, I presented evidence that the same thing is true of dividend growth strategies, which screen for stocks that persistently increase their dividend instead of screening for dividend yield—the returns were well explained by exposure to common factors (including quality) and the alpha of the two leading dividend growth funds was significantly negative.
Performance of Two Largest Dividend-Growth ETFs
Despite the economic theory and the empirical evidence, many investors still express a preference for dividend-paying and dividend-growth stocks.
While dividends do not do a good job of explaining returns, new research finds that total shareholder payout (dividends plus net repurchase yield) does.
The Case for Total Shareholder Yield
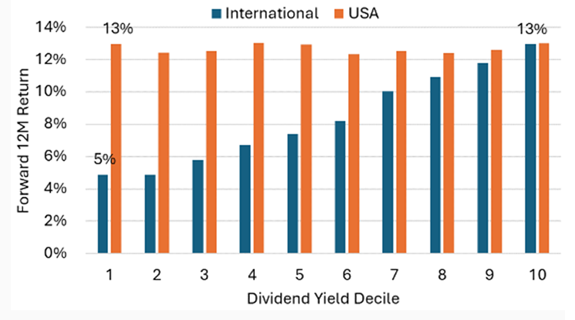
Chris Satterthwaite, of Verdad, took a deep dive into the relationship between dividend yield, buyback yield, and total shareholder yield and stock returns in his study “Buybacks for US, Dividends for EU.” He scored 24,000 companies monthly since 1995 and decile-ranked them on dividend yield, net repurchase yield (share repurchases minus share issuance divided by market capitalization), and total shareholder yield (dividend yield plus net shareholder yield). He then grouped by decile and calculated the average 12-month forward total return (including dividends). His analysis began with the table below showing how dividend yield deciles spread forward 12-month returns for US and international equities, excluding emerging markets. As you can see, the relative dividend yield didn’t do a good job of explaining differences in return for US stocks, although it did for international (excluding emerging markets) stocks.
Forward 12-Month Return Versus Dividend Yield Decile in the US and International (ex-Emerging Markets)
Next, Satterthwaite analyzed the relationship between repurchase yield and returns. The table below shows that the net repurchase yield decile rank spread forward 12-month returns extremely well, for both the US and international (excluding emerging markets) equities—appearing slightly more linear for the US.
Forward 12-Month Return Versus Repurchase Yield Decile in the US and International (ex-Emerging Markets)
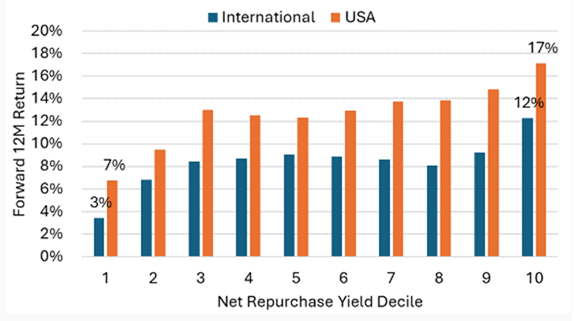
As you can see, Satterthwaite found that in the US, companies with higher buyback yields enjoyed higher returns, but higher dividends appear to have had negligible impact on forward returns.
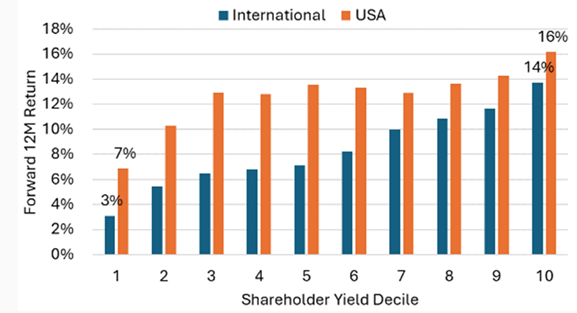
Satterthwaite then analyzed the relationship between total shareholder yield and returns. The table below shows that it does a good job of spreading returns in a linear fashion, both in the US and abroad.
Forward 12-Month Return Versus Shareholder Yield Decile in the US and International (ex-Emerging Markets)
Investor Takeaways
Satterthwaite demonstrated that combining both dividend yield and net repurchase yield into total shareholder yield is a far stronger metric than the dividend yield only—it does a relatively good job of spreading returns in a linear fashion, both in the US and abroad.
The main takeaway is that there is nothing special about dividends, except that they are a tax-inefficient way to return capital to shareholders, and they are certainly not income (except from a tax perspective); they are just a return of investor capital—by definition, income increases wealth while dividends do not. Second, investors are better served by focusing on investing in strategies that provide exposure to the factors they want to invest in. A focus on dividends, whether dividend growth or high-dividend yield, is not likely to add value.
Another takeaway is that a focus on dividends also reduces diversification because a significant percentage of stocks do not pay dividends. Thus, any screen that includes dividends results in portfolios that are far less diversified than they would be if dividends were not included in the portfolio design. Less-diversified portfolios are less efficient because they have a higher potential dispersion of returns without any compensation in the form of higher expected returns (assuming the exposure to common factors is the same).
Larry Swedroe is the author or co-author of 18 books on investing, including his latest Enrich Your Future.
The author or authors do not own shares in any securities mentioned in this article. Find out about Morningstar’s editorial policies.
Larry Swedroe is a freelance writer. The opinions expressed here are the author’s. Morningstar values diversity of thought and publishes a broad range of viewpoints.

 United States