
What Beat the S&P 500 Over the Past Three Decades? Doing Nothing
A strategy of buying a basket of stocks and leaving them untouched outperformed the index, not to mention scores of active managers.
/s3.amazonaws.com/arc-authors/morningstar/550ce300-3ec1-4055-a24a-ba3a0b7abbdf.png)

Imagine you bought a basket of stocks 10 years ago and then you didn’t trade them, not even to rebalance. You just let ‘em sit. How would you have done?
I try to answer that question and offer some thoughts on the lessons this simple experiment might impart.
My Test
To conduct the experiment, I started by compiling the S&P 500′s holdings as of March 31, 2013. I then pulled each holding’s monthly returns over the next decade. Using those 120 monthly returns, I was able to compound each holding’s value as if someone had left the portfolio alone, reinvesting any dividends. Namely, I adjusted each holding’s value by its monthly total return, repeating over all 120 months.
Once I had derived each holding’s monthly values, I was able to sum those holding values to arrive at the portfolio’s aggregate value each month. From there, I compared the portfolio’s aggregate value in one month with its value a month prior, the percentage difference representing the portfolio’s total return that month. Those 120 monthly returns formed the return stream for this “Do Nothing Portfolio.”
More than 100 of the Do Nothing Portfolio’s holdings didn’t make it to the end of the period, most having been acquired at some point along the way. In those instances, I assumed the acquisition proceeds sat in cash. In other words, I gradually increased the portfolio’s cash stake along the way to approximate the amount and timing of the acquisition proceeds that would have rolled in.
Thus, by the end of the 10-year period, the final portfolio was a mix of the surviving stocks and cash that had built up.
Findings
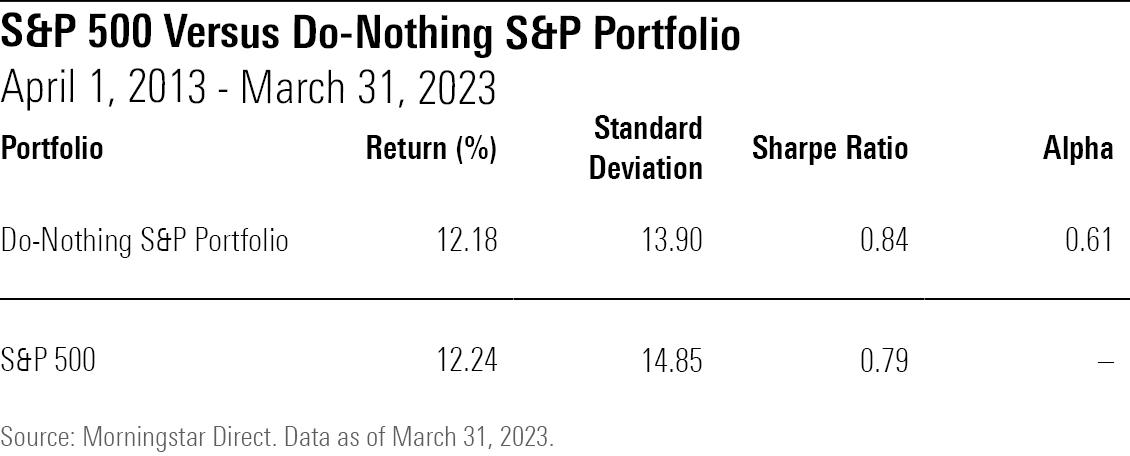
The Do Nothing Portfolio held its own. It generated a 12.2% annual return over the 10 years ended March 31, 2023, finishing in a virtual dead heat with the actual S&P 500. This is a decent achievement when you consider that while the S&P 500 is a passive benchmark, it isn’t a set-it-and-forget-it index. The S&P index committee chooses which stocks to add to the index and which to jettison, actions that the Do Nothing Portfolio eschews.
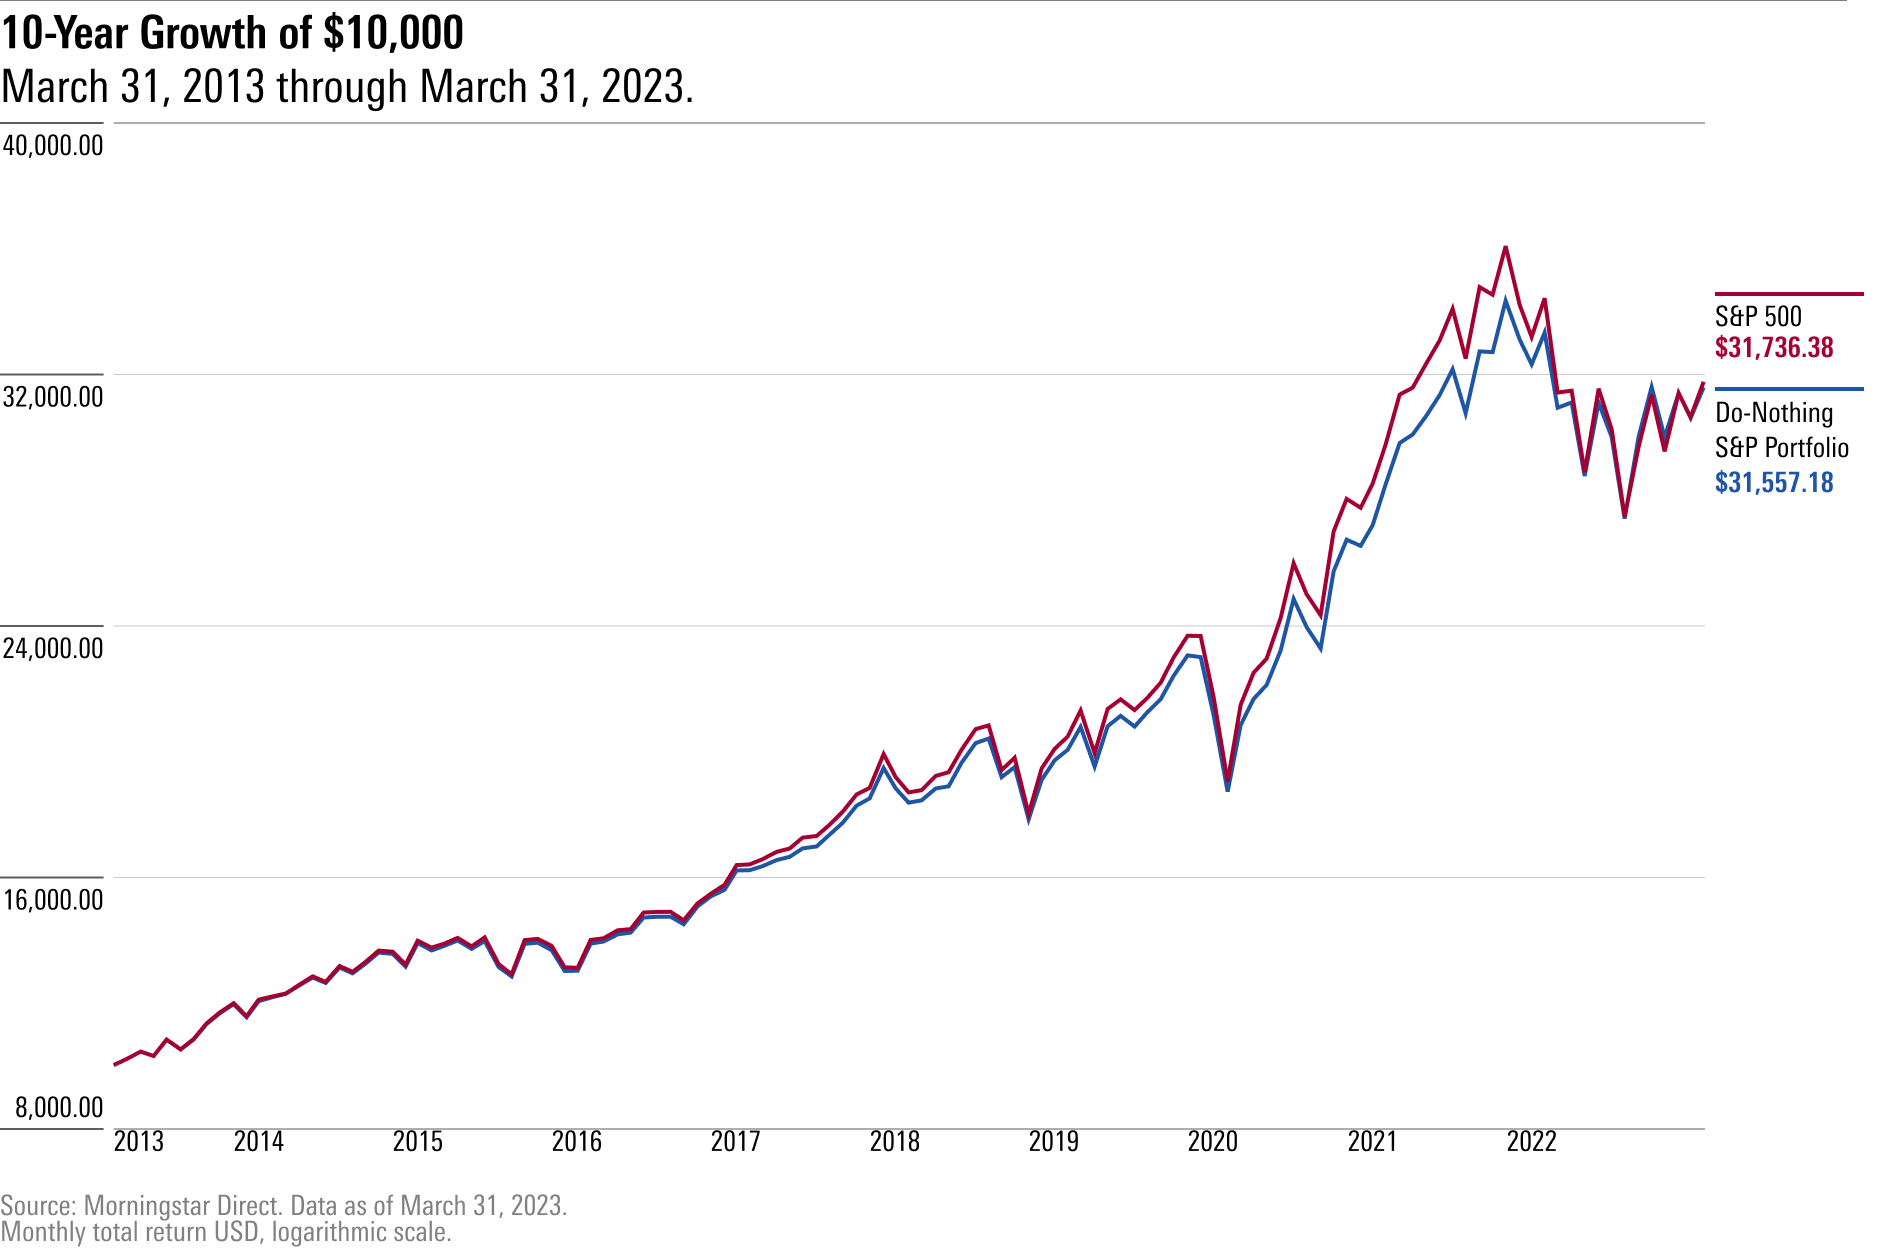
Moreover, because the Do Nothing Portfolio was less volatile along the way, its risk-adjusted returns surpassed the actual S&P 500’s. As a matter of fact, its 0.84 Sharpe ratio would have beaten that of nearly every actively managed large-blend fund over this 10-year span.
This showing is surprising for a few reasons. First, the Do Nothing Portfolio was hauling around more cash than the index was over that span because of the portfolio’s policy of holding the proceeds from acquisitions in cash. It finished the 10-year period with around 5.5% of assets in dry powder, whereas the actual S&P 500 was nearly fully invested throughout. Cash would have dragged on returns as markets rose, but the Do Nothing Portfolio’s holdings were more than equal to the task.
Second, the Do Nothing Portfolio did, well, nothing. Stocks weren’t added to or subtracted from the portfolio nor were holding weights adjusted to reflect factors other than the change in total returns relative to that of other holdings. The actual S&P 500 incorporated all such changes yet was no better off for it (to say nothing of the dozens of active funds that traded at a much faster clip).
Expanding the Scope
Given these surprising findings, I ran the exact same exercise for two other nonoverlapping periods: the 10 years ended March 31, 2013, as well as the 10 years ended March 31, 2003. I created Do Nothing Portfolios that froze the holdings as of March 31, 2003, and March 31, 1993, respectively, and then measured their subsequent returns.
Here is what the 10-year period ended March 31, 2013, looked like.
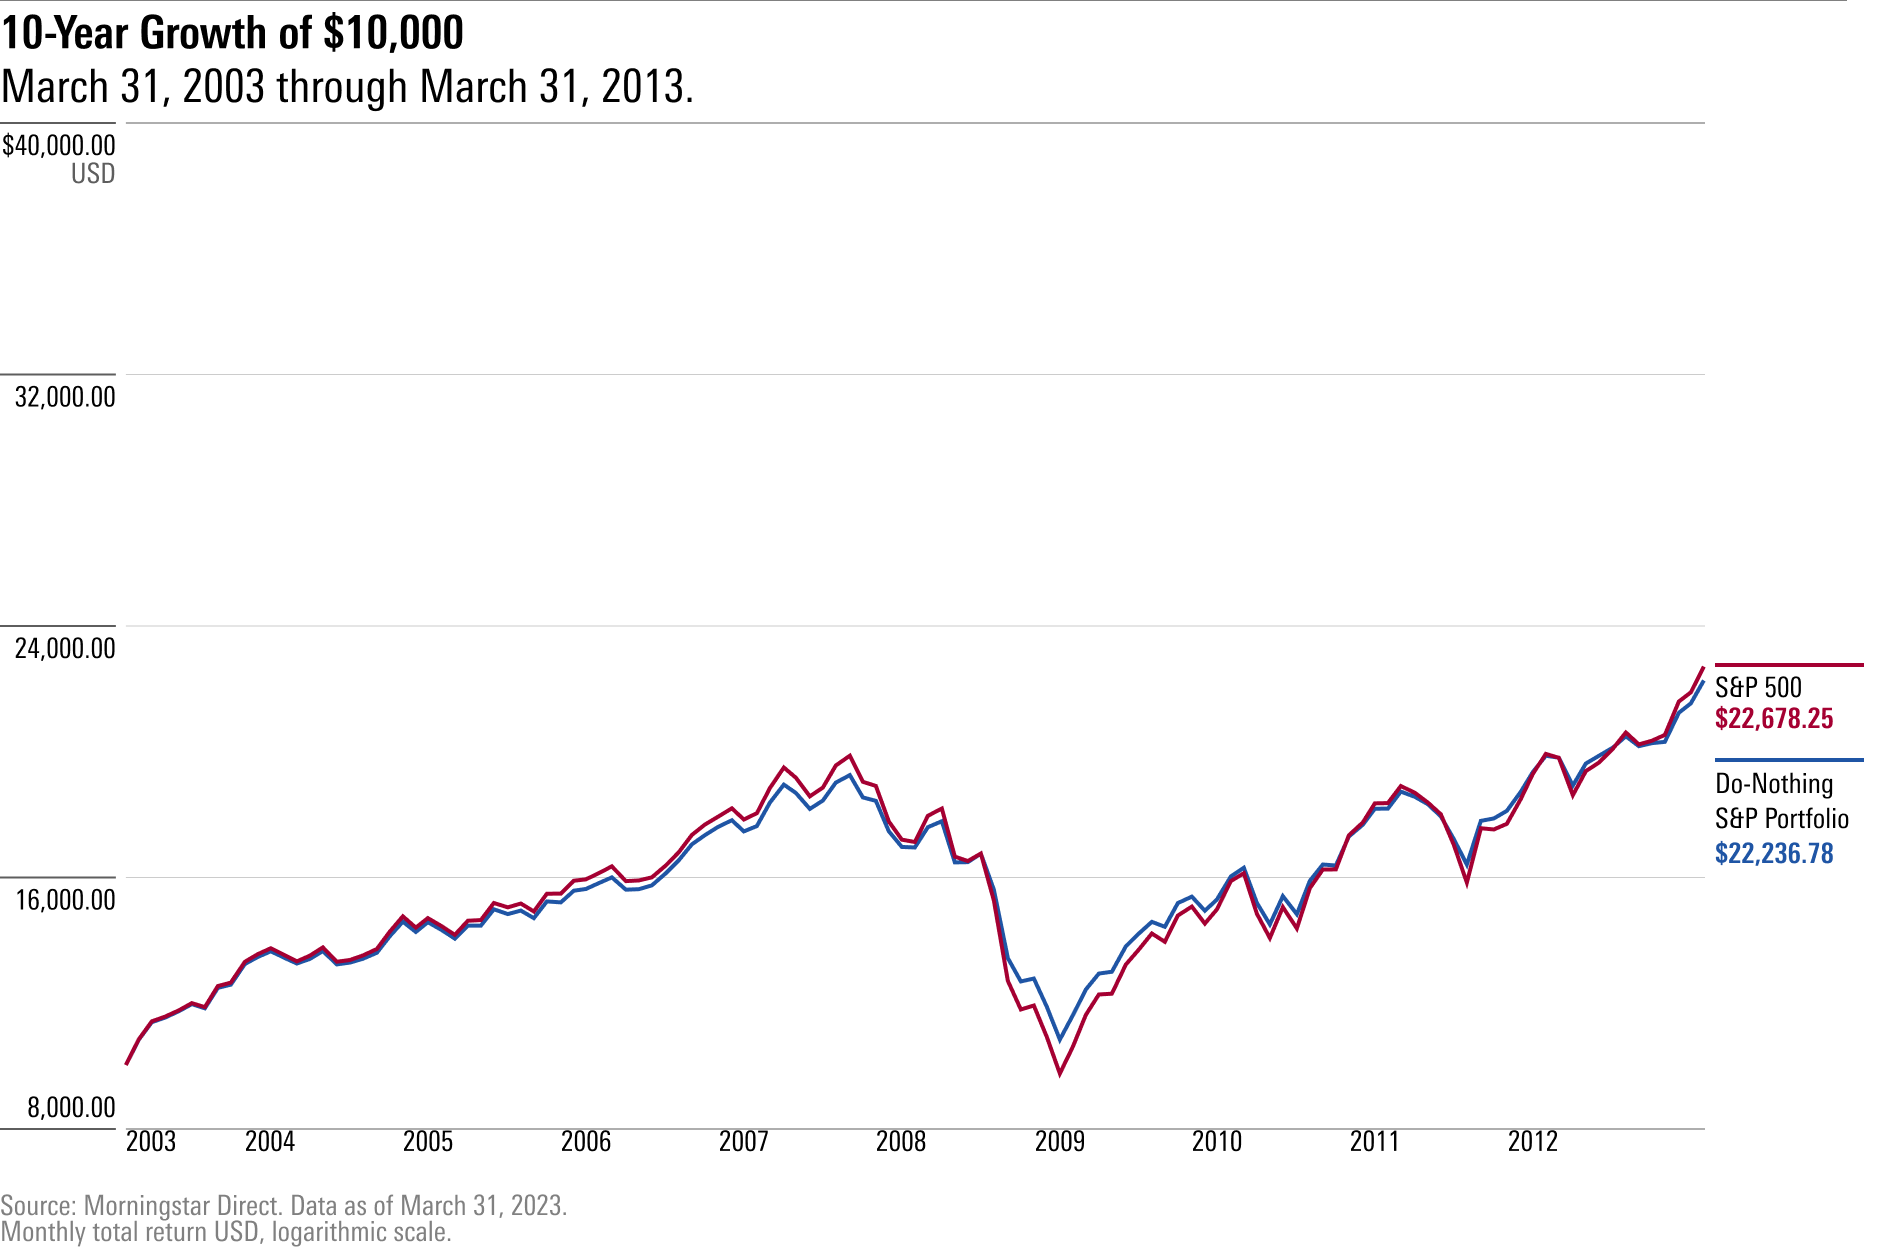
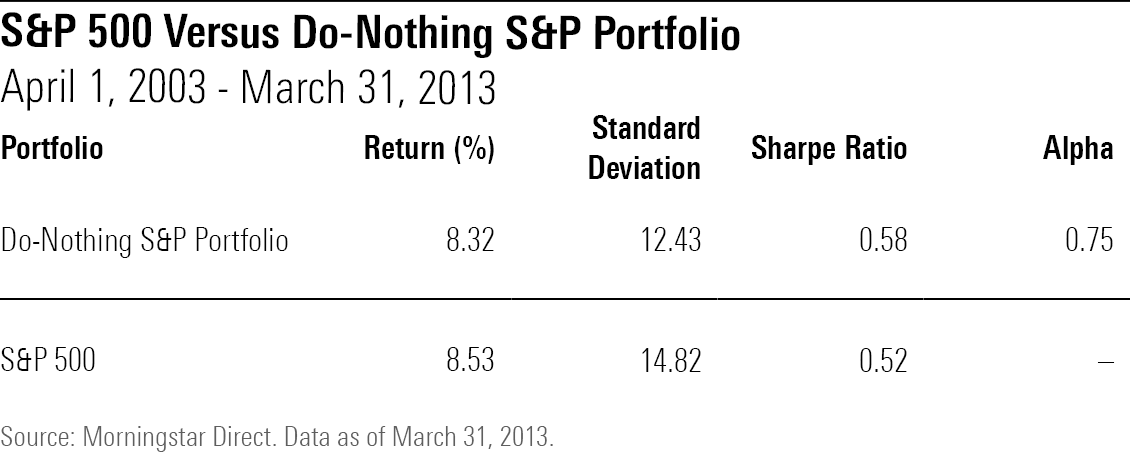
As with the 10 years ended March 31, 2023, the Do Nothing Portfolio also held its own over the preceding decade, nearly matching the actual S&P 500’s return. And once again, things looked even better on a risk-adjusted basis, as the portfolio’s lower volatility yielded a higher Sharpe ratio than the real S&P 500.
Remarkably, the same also held true of the 10-year period ended March 31, 2003. In fact, the Do Nothing Portfolio did best over that decade, topping the S&P 500 by nearly 1 percentage point a year.
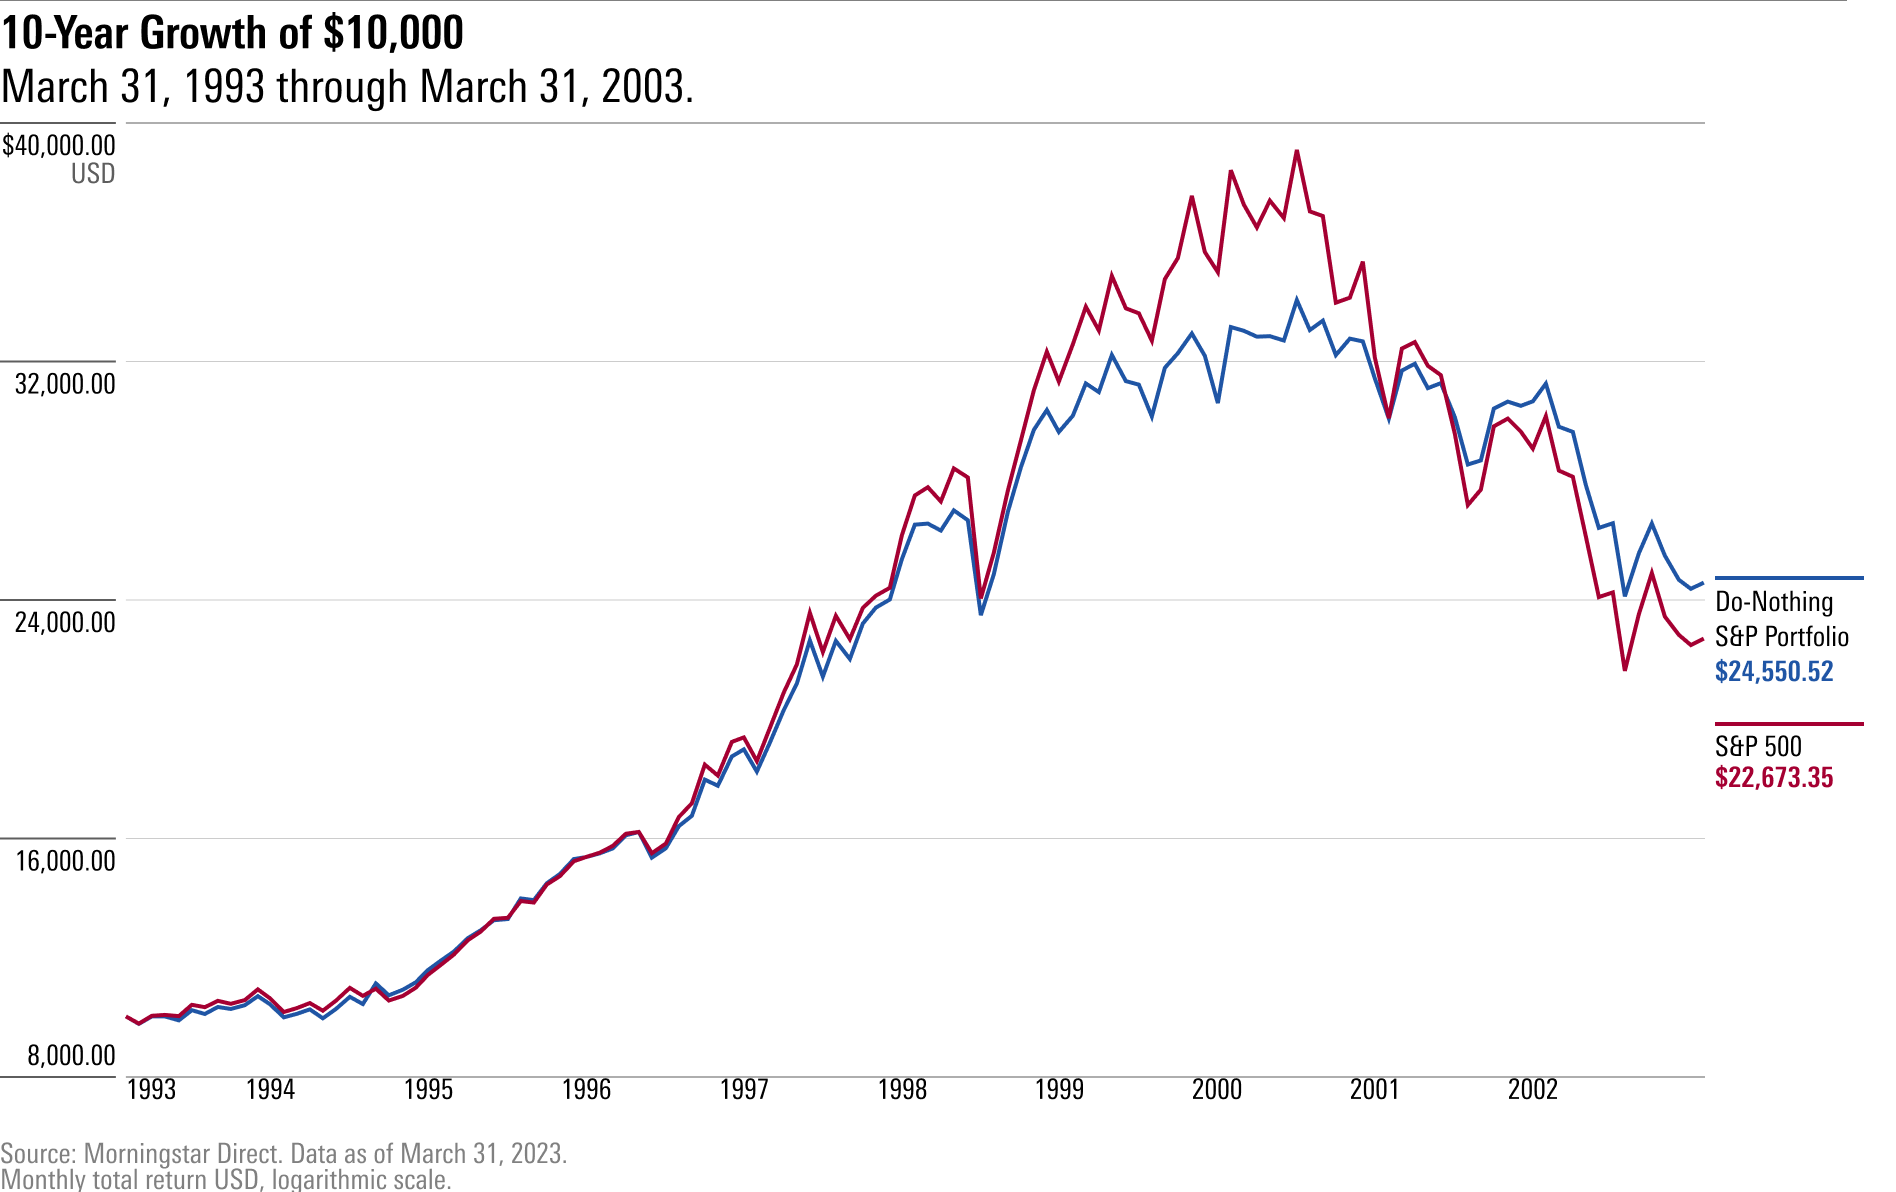
And, as with the other two decades, the Do Nothing Portfolio shone even more brightly once risk was factored in, as its Sharpe ratio over the 10 years ended March 31, 2003, exceeded the S&P 500′s.

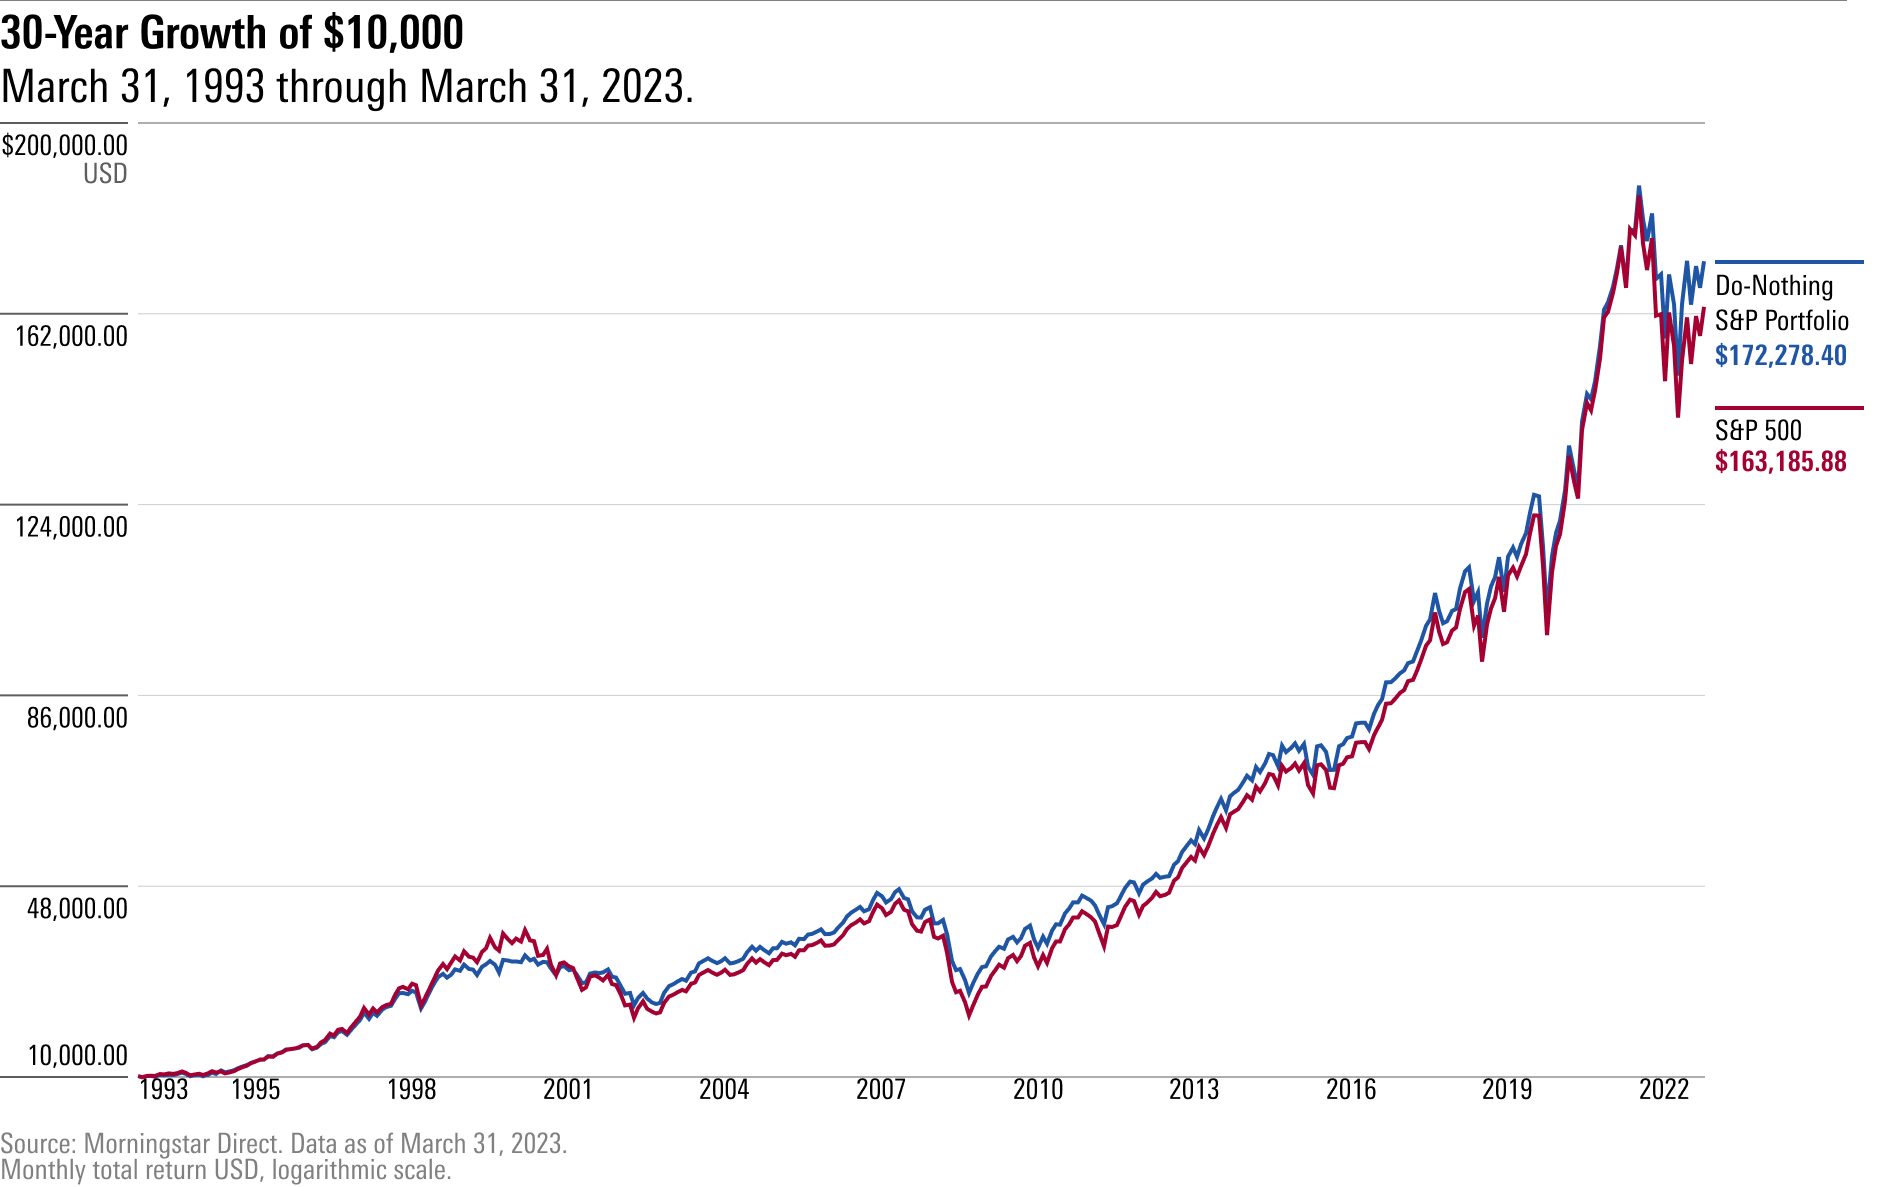
All told, the Do Nothing Portfolio would have acquitted itself very well over the full 30-year period, earning a slightly higher return than the S&P 500 with less volatility.
Factors Behind the Do Nothing Portfolio’s Success
What explains the Do Nothing Portfolio’s success? At a high level, it was able to participate in much of the market’s upside (89% upside capture ratio) but held its ground far better when trouble set in (83% downside capture ratio, which compares favorably to the average manager’s 100% downside capture).
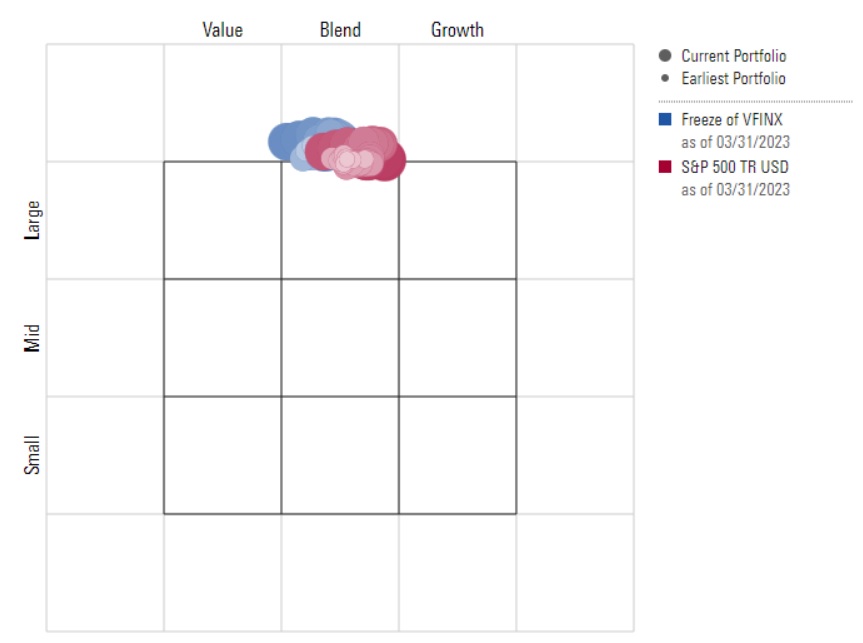
That resiliency appears to owe to a few factors. First, as mentioned, the portfolio held more cash than the actual S&P 500, and that likely provided some ballast when the market sold off in 2000 and 2008. Second, the Do Nothing Portfolio tilted more toward value than the S&P 500 did.
To illustrate, here’s the style trail of the Do Nothing Portfolio (the blue dots) plotted against the S&P 500 (the red dots) over the 10 years ended March 31, 2023. The Do Nothing Portfolio’s holdings—at least the roughly 400 names that started and finished the full 10-year period and were the subject of this analysis—were cheaper, by multiple measures, than the S&P 500′s.
What looks to have made the difference is the way the portfolio let its winners run and refrained from entering new positions. It was more concentrated in its top holdings than the S&P 500, with Apple AAPL alone coming to soak up more than 11% of the portfolio by March 31, 2023, compared with 7% in the actual index. While Apple no longer appears to be that cheap, it was invitingly so earlier in the decade.
Because the Do Nothing Portfolio doesn’t have to immediately make room for new index additions, such as Tesla TSLA and Meta Platforms META, or replace names that have left the portfolio (through delisting), it gives stocks like Apple the ability to run further than they otherwise could. This can be a competitive advantage, as larger institutions, like mutual funds, lack the same ability to concentrate to this extent.
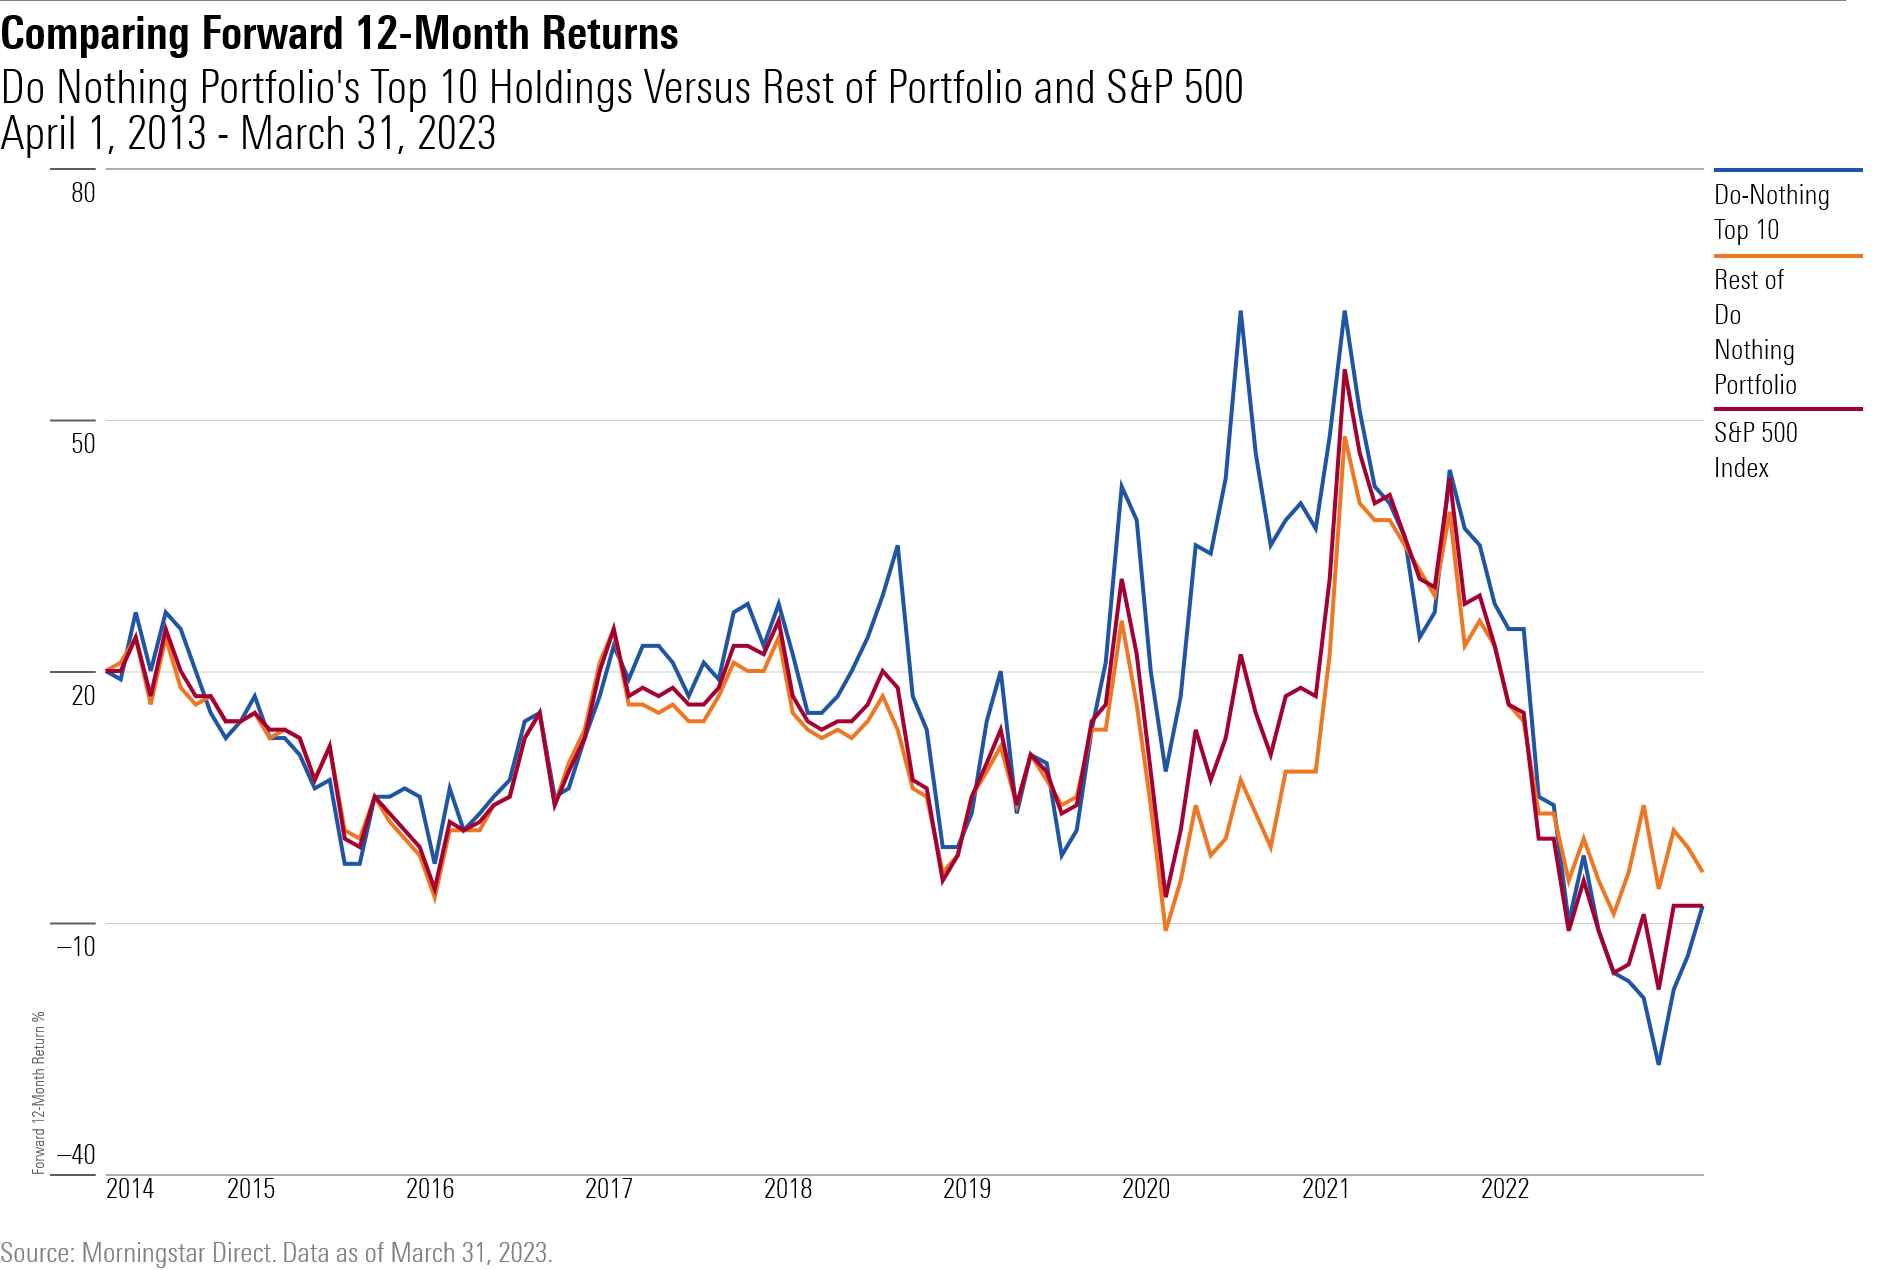
That seems to bear itself out when we examine the outsize contribution that the Do Nothing Portfolio’s top 10 holdings made to its success when compared with the rest of its holdings and to the actual S&P 500. Indeed, its top 10 holdings routinely outperformed the S&P 500 while the remainder of the portfolio’s holdings was thoroughly indexlike.
In summary, the Do Nothing Portfolio appears to have succeeded by slowly amassing cash, holding off on adding new names to the portfolio (some of them pricier), and letting its winners run.
Lessons
The Do Nothing Portfolio’s success potentially holds lessons for individual investors like us, too.
- Don’t insist on being fully invested at all times. A little extra cash, gradually amassed, can cushion the blows and is available to deploy as needed at the end of a long time horizon. It also can nicely complement a strategy of letting winners run, as it acts as a counterweight to the additional concentration at the top of the portfolio.
- Avoid equating success with particular buy and sell decisions. The Do Nothing Portfolio didn’t rush to replace one delisted stock with the new kid on the block. It let the cash build, biding its time. In general, the fewer decisions we have to make, the better. And this seemed to hold true for even seemingly mundane choices like whether to continue holding 500 stocks in the portfolio or make do with fewer.
- Acknowledge the power of letting winners run. No doubt, this won’t suit everyone, in particular those who feel squeamish about having a big share of their portfolio tied up in a handful of names. But the Do Nothing Portfolio owed at least some of its success to leaving its biggest gainers alone, notwithstanding conventional notions of risk management.
- Leave intuition at the door. The responsible voice in our head tells us that a strategy of doing nothing can’t possibly work. Yet, markets repeatedly upend our expectations, which we often form by attempting to decode recent events and their future implications. That’s even true of committees making stock selections for the indexes they oversee. Patience and humility beat action and good intentions.
The author or authors do not own shares in any securities mentioned in this article. Find out about Morningstar’s editorial policies.
/cloudfront-us-east-1.images.arcpublishing.com/morningstar/RNODFET5RVBMBKRZTQFUBVXUEU.jpg)
/cloudfront-us-east-1.images.arcpublishing.com/morningstar/LJHOT24AYJCHBNGUQ67KUYGHEE.jpg)
/cloudfront-us-east-1.images.arcpublishing.com/morningstar/V33GR4AWKNF5XACS3HZ356QWCM.jpg)
:quality(80)/s3.amazonaws.com/arc-authors/morningstar/550ce300-3ec1-4055-a24a-ba3a0b7abbdf.png)