
After Earnings, Is Berkshire Hathaway Stock a Buy, a Sell, or Fairly Valued?
With solid performance in insurance but softness in rails and energy, here’s our outlook for Warren Buffett’s Berkshire Hathaway.


Berkshire Hathaway BRK.A/BRK.B reported earnings on Nov. 4. Here’s Morningstar’s take on Berkshire’s earnings and our outlook for its stock.
Key Morningstar Metrics for Berkshire Hathaway
- Fair Value Estimate BRK.A: $600,000.00
- Fair Value Estimate BRK.B: $400.00
- Morningstar Rating: 4 stars
- Morningstar Economic Moat Rating: Wide
- Morningstar Uncertainty Rating: Low
What We Thought of Berkshire Hathaway’s Earnings
On the positive side, Geico seems to be recovering along with the rest of the U.S. personal auto industry, which has faced an incredibly difficult environment since the COVID-19 pandemic. The industry has been heavily impacted by significant cost inflation and supply shortages in the United States (which has made repairs and replacements far more expensive for insurers), as well as a meaningful increase in accident severity and medical costs. Geico’s top-line growth was much better than we expected; more importantly, it was profitable growth, as underwriting margins have improved significantly in response to increased pricing across the industry.
As for Berkshire’s other insurance operations, earned premium growth at both Berkshire Hathaway Reinsurance Group and Berkshire Hathaway Primary Group was up more than 25% year over year during the quarter, aided in a large part by the Alleghany acquisition, as well as price hardening in the property and casualty business. Catastrophe losses at BHRG were trivial, allowing the unit to post record underwriting profits of $1.4 billion. BHPG also saw little in the way of catastrophe losses, with the insurance unit posting underwriting profits of $510 million for the quarter.
The manufacturing, service, and retailing segment also posted better-than-expected results for the quarter. While top-line growth of around 1% year over year was anticipated, given the headwinds the firm’s building products and consumer products units have been facing, pre-tax margins remained elevated at 10.3%. This was up slightly from the MSR segment’s 10% pre-tax margins during the prior year’s period and still well above our forecast calling for pretax margins of 9% on average annually during 2023-27.
On the downside, BNSF came in below expectations on declining volumes and average revenue per car/unit, as well as higher-than-expected compensation costs. BNSF’s third-quarter revenue decline of 12% was worse than the 10% top-line decline at Union Pacific, its closest comparable and peer. BNSF’s revenue growth reflected a 7% decline in average revenue per car/unit (including fuel surcharges) and a 5% decline in volumes, while Union Pacific saw average revenue per car/unit decrease 7%, with volumes declining just 3%. On the plus side, the gap in operating ratios narrowed between the two railroad operators during the quarter.
Normally a beacon of stability, Berkshire Hathaway Energy reported a 4% decline, negatively impacted by a 14% decline in revenue from Berkshire Hathaway HomeServices. Meanwhile, increases in energy operating expenses (including Pacificorp’s $1.3 billion increase in estimated pre-tax loss accruals due to wildfires) drove the segment’s pre-tax profits into negative territory. We view this as a momentary blip in BHE’s overall results and continue to believe ongoing constructive rate case outcomes will lead to EBITDA growth in an average annual range of 5%-6% over the next five years for its regulated U.S. utilities, even as the company ramps up growth and operating capital expenditures. We see the residential real estate and brokerage business eventually recovering as rates decline some over the next several years.
Berkshire Hathaway Stock Outlook
We see Berkshire Hathaway as a broadly diversified conglomerate with a collection of moaty businesses, a rock-solid balance sheet, and a business model that allows it to pursue opportunities to generate returns in excess of our estimate of its cost of capital or return the bulk of its excess capital to shareholders.
The firm’s broad diversification (even within its insurance operations) not only provides management with a wide array of investment opportunities at any given time but also helps the company minimize losses when they do occur in one or more subsidiaries. We’ve seen the firm repeatedly take advantage of its differentiated structure to tap into unique internal opportunities.
As such, no one quarter’s results are going to have much of an impact on how we think about the firm in the long term. While we would have been happier to see Berkshire buy back a lot more stock during the quarter, it speaks to management’s discipline when investing shareholder capital. They’re always looking for the best value when putting money to work. This is why cash continues to build up on their balance sheet.
Surprisingly, we were somewhat less concerned than we feared about Berkshire’s cash hoard surpassing the $150 billion threshold, which CEO Warren Buffett described as being likely untenable to shareholders at the company’s annual meeting in May 2017. Perhaps this is because short-term rates are above 5% right now and Berkshire had $126 billion invested in T-Bills at the end of September. In 2017, when short-term rates were below 1%, Berkshire had $61 billion in T-Bills.
Investors should also note that Berkshire’s stock has historically been more defensive in nature. Its stock tends to underperform the S&P 500 Index during the market’s better years and does much better when the market goes into correction/bear territory.
Berkshire Hathaway Stock Price
Berkshire Hathaway Stock Valuation
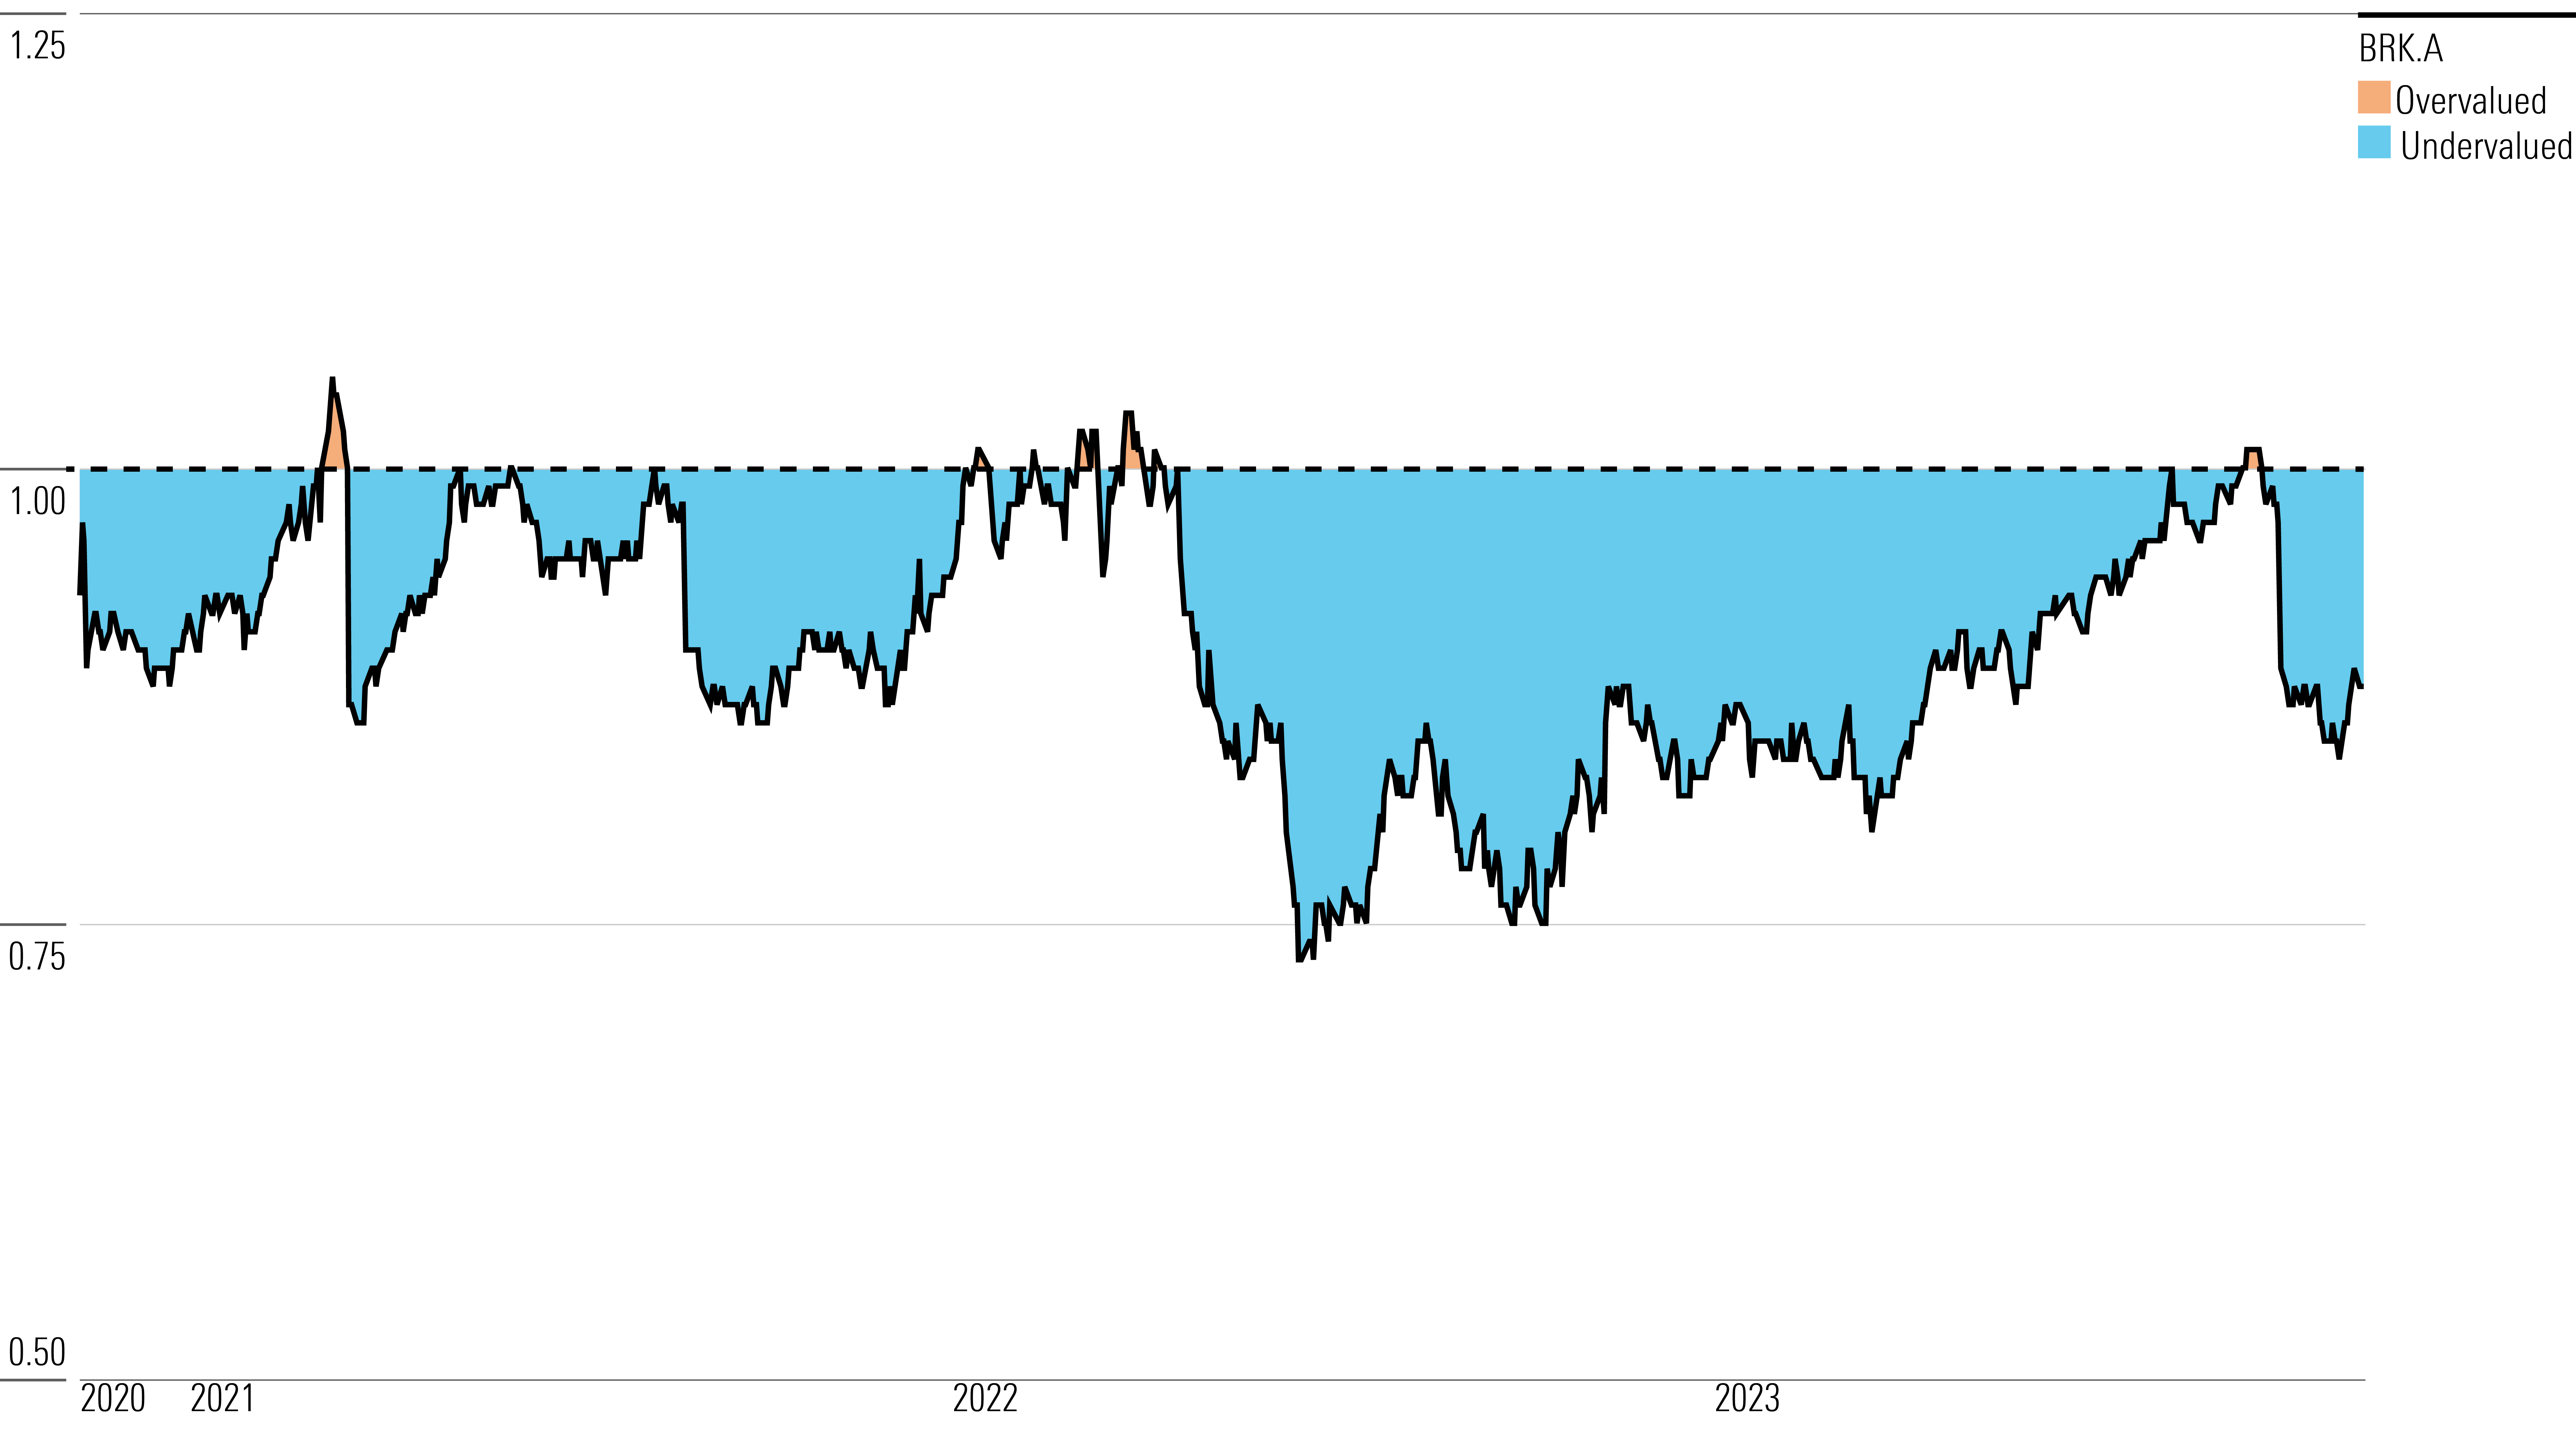
We recently raised our fair value estimate for Berkshire Hathaway stock to $600,000 per Class A share and $400 per Class B share, which is currently equivalent to 1.49 times our estimate for its book value per share at the end of 2024 and 1.37 times for 2025. As of today’s close, the shares are trading at 1.3 times our estimate for Berkshire’s book value per share at the end of 2024 and 1.2 times for 2025. Stock is also trading at a 12%-13% discount to our fair value estimate.
We’d add that historically, Buffett has encouraged investors to buy Class B stock instead of Class A whenever the latter shares are trading at more than a 1% premium to the former (which is the case right now), and to buy Class A stock when the two classes are at parity, given their superior voting rights. That said, we’d encourage investors to continue to look for a slightly wider margin of safety, believing that something closer to a 15%-20% discount to our fair value estimate is a good entry point for long-term investors.
Fair Value Estimate for Berkshire Hathaway Stock
With its 4-star rating, we believe Berkshire Hathaway’s stock is undervalued compared with our long-term fair value estimate.
We’ve increased our fair value estimate for Berkshire Hathaway to $600,000 per Class A share from $555,000, after updating our forecasts for the company’s operating businesses and insurance investment portfolio. Our new fair value estimate is equivalent to 1.43 times our estimate for Berkshire’s book value per share at the end of 2024 (1.32 times for 2025). For some perspective, during the past five years, the shares have traded at an average of 1.40 times the trailing calendar year-end book value per share (1.43 times over the last 10 years). We use a 9% cost of equity in our valuation and assume Berkshire pays a minimum of 15% corporate alternative minimum tax on adjusted financial statement income for taxable years beginning in 2023.
Our fair value estimate is derived using a sum-of-the-parts methodology, valuing each of Berkshire’s operating segments separately and then adding them together for the total estimate. After revising our projections for 2023-27, we have increased our valuation for Berkshire’s insurance operations to $297,000 per Class A share (from $257,500), owing primarily to adjustments we’ve made to earned premium growth, underwriting profitability, and returns and overall yield on the investment portfolio.
Berkshire Hathaway Historical Price/Fair Value Ratio]
Read more about Berkshire Hathaway’s fair value estimate.
Economic Moat Rating
We’ve historically believed that Berkshire’s economic moat is more than the sum of its parts, although the parts are fairly moaty in their own regard. The insurance operations—Geico, BHRG, and BHPG—remain important contributors to the overall business. Not only are they expected to account for around 30% of Berkshire’s pretax earnings (and 50% of our valuation of the firm), but they are also overcapitalized (maintaining a larger-than-normal equity investment portfolio for a property and casualty insurer) and generate low-cost float.
These temporary cash holdings, which arise from premiums being collected in advance of future claims, have allowed Berkshire to generate additional returns as the company invests these funds in assets that are commensurate with the duration of the business being underwritten. And they have tended to come at little to no cost to Berkshire, given the company’s proclivity for generating underwriting gains over the past several decades.
Read more about Berkshire Hathaway’s moat rating.
Risk and Uncertainty
Our Morningstar Uncertainty Rating for Berkshire is Low. We don’t currently consider any environmental, social, or governance issues at the firm to be material enough to affect our rating, primarily due to its lower exposure to some of the main ESG risks inherent to the industries in which it competes. However, Berkshire has generally scored lower on governance issues because of the makeup of its board and board committees, the unequal voting structure of its shares, and its historical lack of engagement and opaqueness on governance issues.
Berkshire faces the risk that insurance claims exceed loss reserves or that material impairments affect its investment portfolio. Several of the firm’s key businesses—insurance, energy generation and distribution, and rail transport—operate in industries that are subject to higher degrees of regulatory oversight, which could affect future business combinations, as well as the setting of rates charged to customers. Many of the company’s noninsurance operations are exposed to the cyclicality of the economy, with results suffering during economic slowdowns.
Read more about Berkshire Hathaway’s risk and uncertainty.
BRK.A/BRK.B Bulls Say
- Book value per share (which is a good proxy for measuring changes in Berkshire’s intrinsic value) increased at an estimated 18.3% CAGR during 1965-2022, compared with a 9.9% annualized return for the S&P 500 TR Index.
- Berkshire’s stock performance has generally been solid, increasing at a 9.5% CAGR during 2018-22, compared with a 9.4% average annual return for the S&P 500 Index. In addition, Berkshire has gained 13.3% from 2013-22, compared with a 12.6% average annual return for the S&P 500.
- At the end of June 2023, Berkshire had approximately $166 billion in insurance float. The cost of its float has been negative for much of the past two decades.
BRK.A/BRK.B Bears Say
- Given its size, Berkshire’s biggest long-term hurdle will be its ability to consistently find deals that not only add value but are large enough to be meaningful.
- Another big issue facing the firm is the longevity of chair and CEO Warren Buffett (who turned 93 at the end of August 2023) and managing partner Charlie Munger (who turns 100 in January 2024).
- Berkshire’s insurance business faces competitive and highly cyclical markets that occasionally produce large losses, and several of its noninsurance operations are economically sensitive and focused on U.S. markets.
This article was compiled by Tom Lauricella.
The author or authors do not own shares in any securities mentioned in this article. Find out about Morningstar’s editorial policies.
/cloudfront-us-east-1.images.arcpublishing.com/morningstar/ECVXZPYGAJEWHOXQMUK6RKDJOM.jpg)
/cloudfront-us-east-1.images.arcpublishing.com/morningstar/KOTZFI3SBBGOVJJVPI7NWAPW4E.jpg)
/cloudfront-us-east-1.images.arcpublishing.com/morningstar/V33GR4AWKNF5XACS3HZ356QWCM.jpg)