
Sequence Risk During Retirement
What every retiree should understand.
/s3.amazonaws.com/arc-authors/morningstar/1aafbfcc-e9cb-40cc-afaa-43cada43a932.jpg)

A Simple Model
Today’s topic is Certified Non-Fresh. Sequence risk during retirement—the danger arising from withdrawing assets from a shrinking portfolio—is a familiar subject. For example, my colleagues Amy Arnott and Larissa Fernand have each published sequence-risk articles, and Christine Benz often discusses the problem.
This article, though, is a bit different. Other treatments of sequence risk either describe the issue in general terms or provide historical examples. This column will use a streamlined model to demonstrate the principles underlying the problem.
The situation is simple. The investor retires with a $1 million portfolio, spending $40,000 of assets per year, with the initial withdrawal amount increasing by the annual inflation rate of 2%. Thus, the first year’s withdrawal would be $40,000, the second year’s $40,800, and the third year’s $41,616. (Yes, that 2% inflation rate is optimistic. But as the next paragraph shows, the portfolio’s projected returns are not particularly aggressive, so it all evens out.)
Each year, the portfolio either: 1) breaks even, 2) gains 6%, or 3) gains 12%. As these events occur in equal amounts, the portfolio achieves each of these annual totals for 10 years out of 30, thereby posting a 5.89% annualized gain over the entire 30-year period. (No, not 6%—math is hard.) The order of performance is immaterial. Whatever the sequence of returns, the annualized return is 5.89%.
Two Investors
Let us consider two cases. The first retiree enjoys the strongest possible start, recording 10 years of 12% returns, followed by a decade of 6% gains, and then breaking even in the final decade. The second retiree experiences the reverse. She endures the weakest possible start, treading water during the first decade of retirement, then posting 6% returns, before finishing with 12% results. The following chart depicts the two investors’ fates.
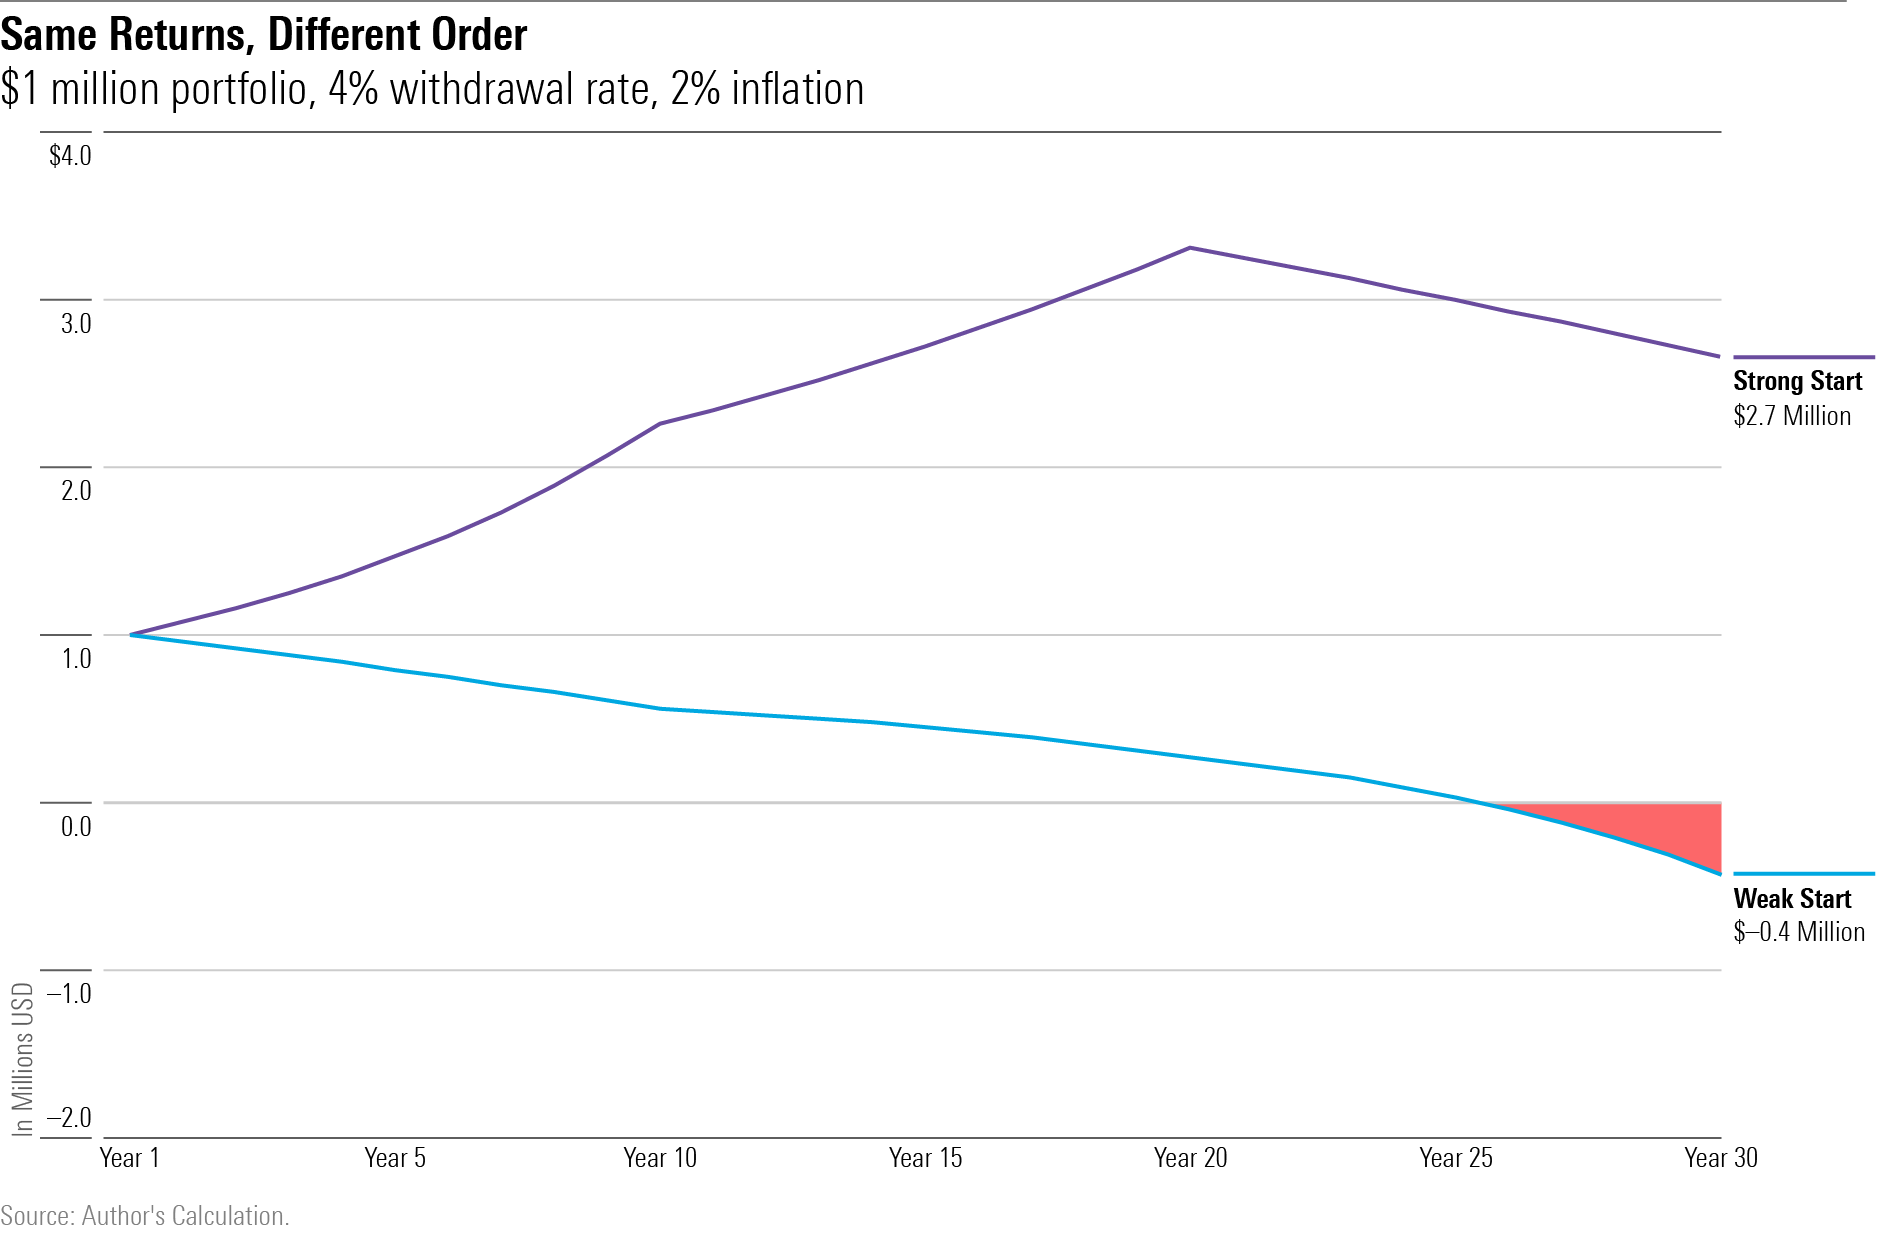
Quite the disparity! The first retiree had no worries, growing the portfolio to more than $3 million by year 20. From there, her assets declined modestly, but without even the faintest possibility of a bad outcome. Besides paying her bills, the investor left a handsome legacy. No such luck for the second retiree. By year 26, she was bankrupt. (In real life, investors facing such situations rarely go bust because they slash their spending in response, but their fates are nonetheless unenviable.)
Here is the intuition behind those outcomes. In year 11, the scheduled withdrawal amount for each retiree was $48,760. By that time, the first investor owned $2.2 million, which made for a 2.2% withdrawal rate. Easy to absorb, given the portfolio was now earning 6%. The second retiree was also earning 6%, but her portfolio had shriveled to $562,000, thereby raising her withdrawal rate to 8.7%. She reached the point of no return: Each year, the portfolio would further dwindle, as its payments surpassed its receipts.
No Bear Market
It should be noted that while the model’s annual results are openly unrealistic, its decadelong totals are not. For the 10 years from March 1999 through February 2009, the annualized after-inflation return for Vanguard Balanced Index was negative 1.7%—an almost exact match for the negative 2.0% real returns posted by each retiree’s portfolio during their lowest-performance decades. Moreover, while Vanguard Balanced Index suffered several steep drawdowns during that period, the model’s portfolios never did. Their woes owed to stagnation, not outright losses.
Lesson 1: Illustrations of the perils awaiting investors who retire immediately before the onset of bear markets are useful, but they do not tell the entire story. Sequence risk also threatens those who retire into a prolonged stretch of fallow returns, even if no bear market ensues. (If flat performance over an entire decade, accompanied by 2% inflation, strikes you as unlikely because the portfolio’s bonds would earn yields, then consider the prospect of 3% annualized returns with 5% inflation. That combination would deliver similar results.)
Without Sequence Risk
One might think that a fixed 5.89% annual payout would be better than any of the risky alternatives. Not so. The fixed payout certainly beats what the second investor experienced, because it never encounters trouble. At least as modeled in this column, the portfolio return surpasses the withdrawal rate, so the fixed payout grows steadily, if not spectacularly. But the fixed payout is well behind the profits accumulated by the first investor’s portfolio.
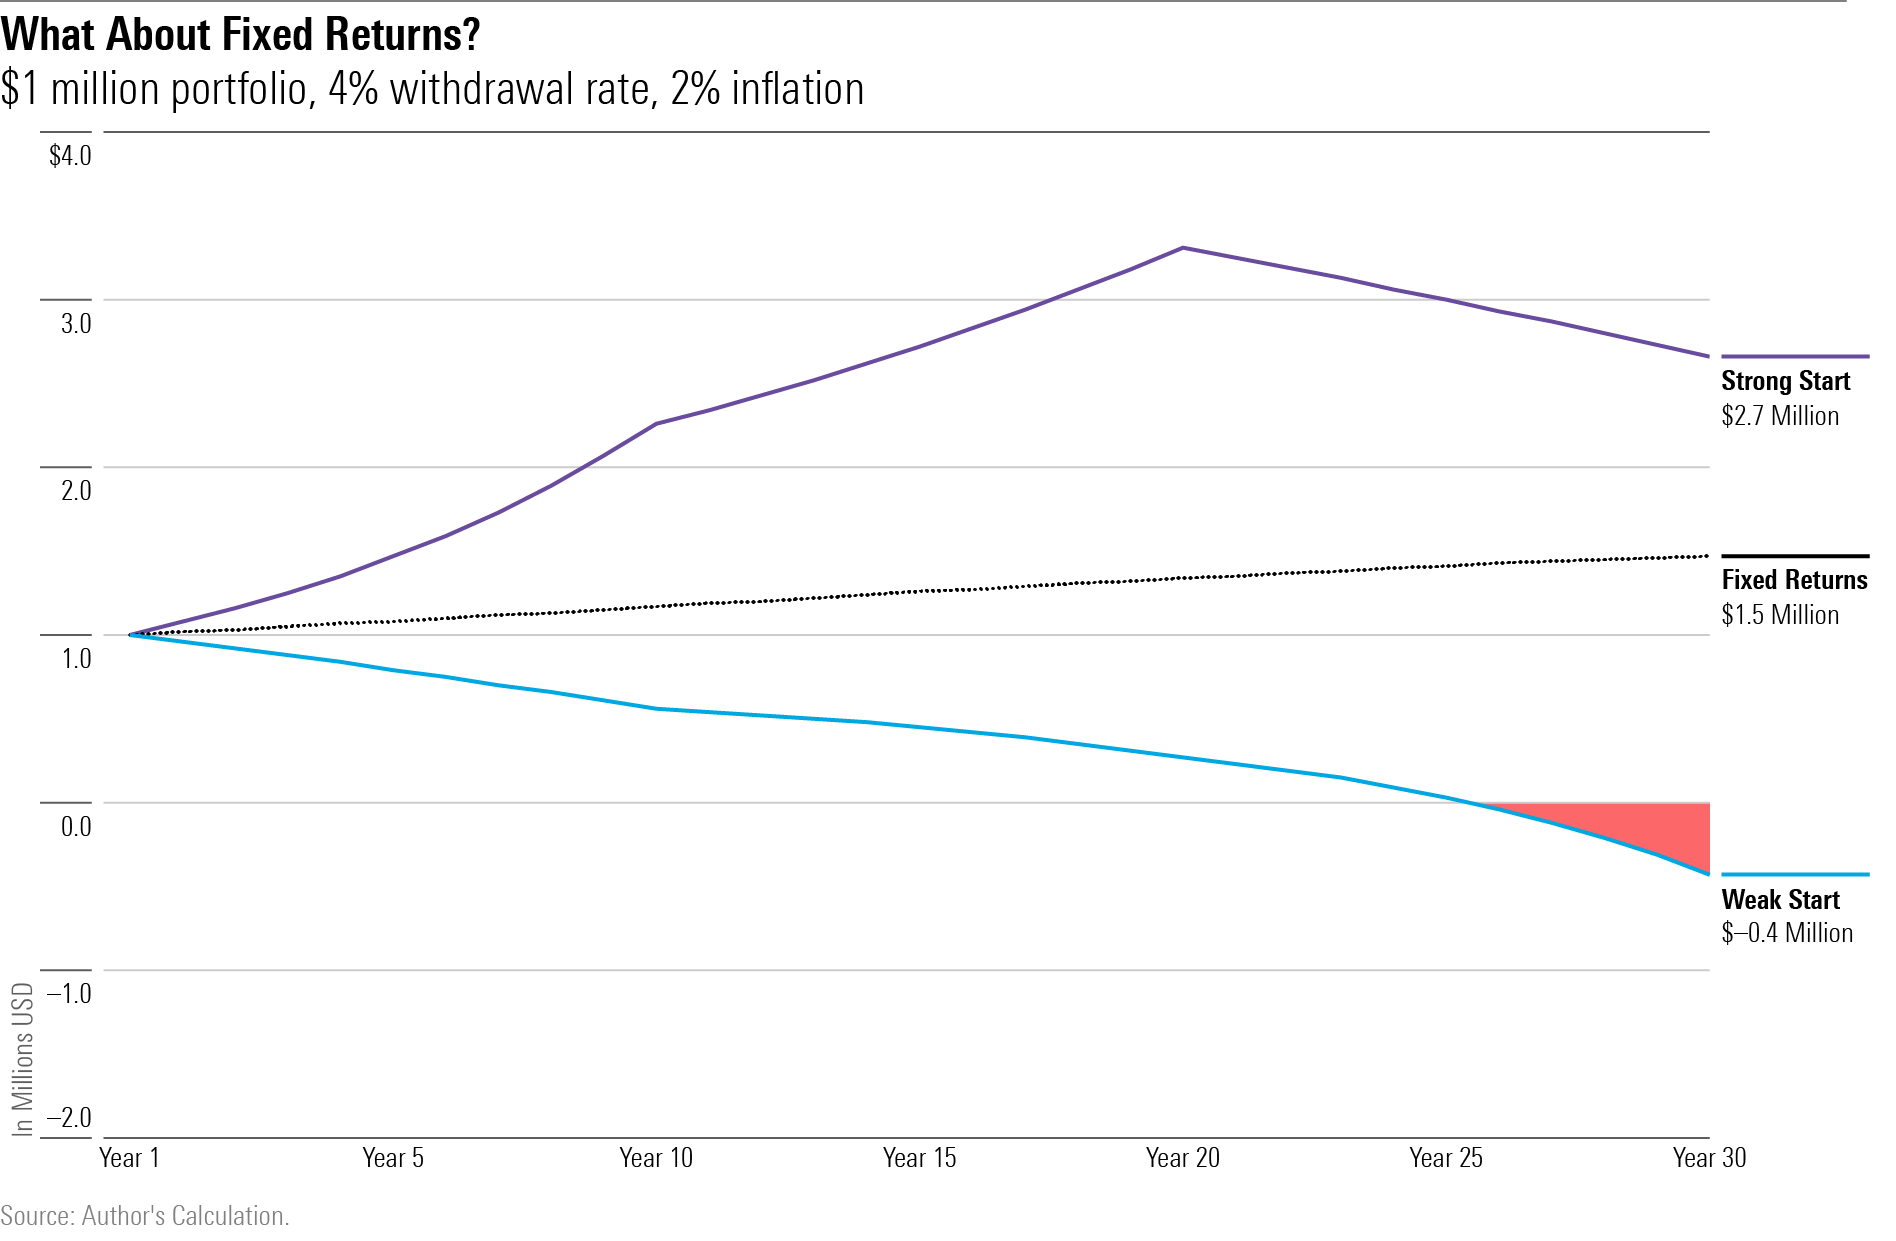
Lesson 2: Reducing volatility helps prevent retirement disasters! Holding bonds improves the investment math. But stock market volatility can help as well as harm. If equities rally during the early years of retirement, then the retiree will benefit from owning stocks, even if the 30-year returns on equities eventually only match (or potentially even trail) those of bonds.
Escape Routes
Addressing how retirees can mitigate sequence risk far exceeds the scope of this column—for some answers, see “The State of Retirement Income,” written by Arnott, Benz, and myself—but I can offer some context. The next exhibit shows how the unlucky second investor would have fared had she begun with initial withdrawals of 1) $35,000, 2) $30,000, or 3) the original $40,000 but refrained from taking the inflation adjustment during the first 10 years.
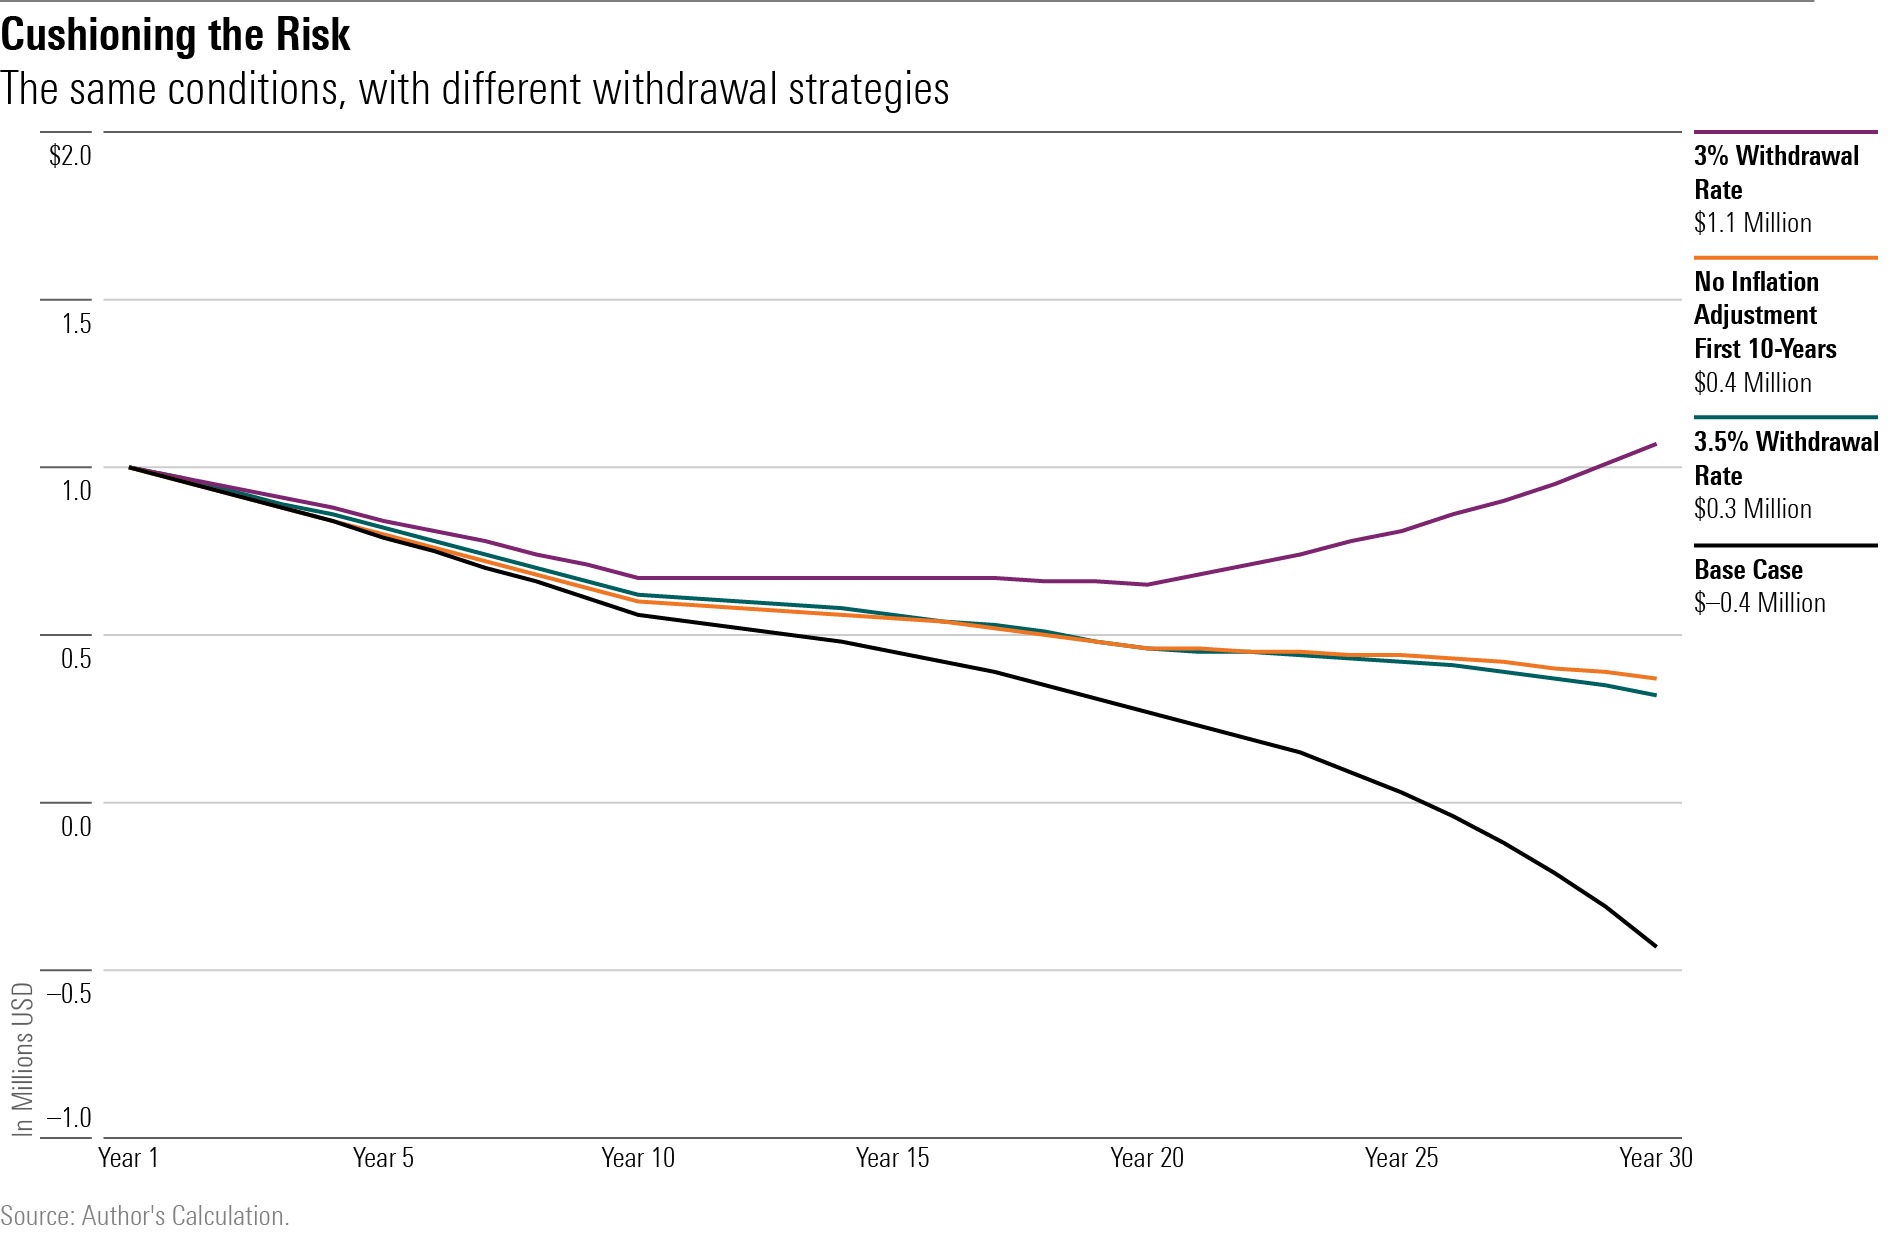
Each strategy fixed the problem. The only fully comfortable solution was the most extreme measure, cutting the initial distribution to $30,000; this would have halted the portfolio’s erosion after year 10 and then boosted its value after year 20. However, the other two approaches would also have permitted three decades’ worth of withdrawals, albeit with some nervous moments along the way.
(I was surprised that forgoing the modest 2% annual inflation adjustment for a mere 10 years made such a big difference. But that tactic has a ripple effect. Not only does the portfolio benefit from lower spending during its first decade, but because the inflation adjustment does not begin until year 11, spending is also reduced in subsequent years. Thus, total payments decline substantially.)
Lesson 3: Formal financial plans are more complex than the model presented in this article, but they are not more prescient. Inevitably, a retiree’s portfolio will not match the forecast’s performance, often dramatically. For that reason, retirement plans are created to be discarded. Nevertheless, making the effort provides the groundwork for future decisions. Critically important is understanding and appreciating the effects of sequence risk. The order of a portfolio’s returns matters greatly—sometimes, even more than their level.
Editor’s note: This column was originally published on Nov. 5, 2022.
The author or authors do not own shares in any securities mentioned in this article. Find out about Morningstar’s editorial policies.
The opinions expressed here are the author’s. Morningstar values diversity of thought and publishes a broad range of viewpoints.
/cloudfront-us-east-1.images.arcpublishing.com/morningstar/G3DCA6SF2FAR5PKHPEXOIB6CWQ.jpg)
/cloudfront-us-east-1.images.arcpublishing.com/morningstar/6ZMXY4RCRNEADPDWYQVTTWALWM.jpg)
:quality(80)/s3.amazonaws.com/arc-authors/morningstar/1aafbfcc-e9cb-40cc-afaa-43cada43a932.jpg)