
How Retirement Income Guardrails Can Ease Clients’ Worries
Effectively communicating withdrawal strategy improves client experience.

This article is written by Derek Tharp, Ph.D., CFP, CLU, RICP, lead researcher at Kitces.com and an assistant professor of finance at the University of Southern Maine.
Retirement income guardrails—strategies that predetermine when spending retirement adjustments would be made and the spending adjustments themselves—have become increasingly popular in recent years.
While the Guyton-Klinger model is arguably the most well-known guardrails framework, there are other strategies advisors could use, such as Kitces’ Ratcheting Safe Withdrawal Rate and risk-based guardrails. However, the reality is that most advisors do use some sort of dynamic spending strategy that effectively serves as guardrails, too—just without all of the communication benefits that come from actually articulating guardrails (in dollar terms) in advance.
What do I mean? Consider the following strategy that may be common among advisors using Monte Carlo simulations:
- Set an initial spending at a 95% probability of success.
- If the probability of success falls to 70% (or lower), recommend decreasing spending to raise the probability of success.
- If the probability of success rises to 99% (or above), recommend increasing spending to lower the probability of success.
Oftentimes, these internal thresholds that advisors target are left unspoken, but the reality is that advisors generally will recommend increasing or decreasing spending based on changes in the client’s probability of success. We might refer to this as an “uncommunicated guardrail.” It’s a guardrail in practice that will help a client keep their spending on track, but it is never articulated (or calculated), so it just lingers in an advisor’s mind, waiting for the advisor to take action if or when the need arises.
However, this is a big missed opportunity. There’s a tremendous amount of stress that guardrails can help alleviate when properly communicated, and uncommunicated guardrails could be—at least in the client’s eyes—quite similar to having no plan at all.
How Guardrails Can Help Alleviate Stress
Perhaps the greatest benefit of guardrails is helping clients answer the question, in advance, of what would happen during a significant market downturn. Consider the following guardrails:
Portfolio: $2 million
Initial Spending: $100,000 per year
If the portfolio rises to $2.5 million, increase spending to $110,000 per year.
If the portfolio falls to $1.6 million, decrease spending to $90,000 per year.
Suppose, in the example above, the probability of success at a $100,000-per-year spending level was 90%. Suppose further than an advisor communicated this probability of success to a client and didn’t take it any further.
Now, suppose the client is watching their portfolio fall during a downturn. In even the best circumstances, it is hard to imagine retirees feeling good about seeing a portfolio decline. They are made even worse when we don’t know a) when we need to take action, and b) what action we’ll take.
While clients with a trusted advisor looking out for them would offer some peace of mind, advisors can likely provide even more peace of mind by helping clients understand what will happen if and when declines occur.
Moreover, assume a client has view-only access to their Monte Carlo plan and is also watching their probability of success decline with time. This might end up being a double whammy to a client. Not only are they seeing their portfolio decline, but they are also watching a (often vastly misunderstood) metric trend in a negative direction.
What if, instead, a retiree had only seen the withdrawal strategy part of the guardrails plan—and not the probability-of-success changes? Certainly, watching their portfolio decline still isn’t going to be fun, but at least they are armed with the knowledge that a) no change is recommended until their portfolio reaches $1.6 million, and b) that change would be a reduction of $10,000 reduction in annual spending.
While a $10,000 cut will differ in how painful it is depending on a client’s circumstances, let’s say that this particular retiree is a big traveler and usually spends about $20,000 annually in travel. If they are looking at their $1.8 million portfolio and are aware of the withdrawal changes triggered by the $1.6 million guardrail threshold, they know they would still need to face significant declines before that guardrail would be triggered. Furthermore, perhaps they also know that they could cut their travel back $10,000 if they had to, so they already know exactly what adjustment they would make if the time comes.
If we are comparing these two retirees—the first flying in the dark with just some vague notion that their advisor is watching things (perhaps while also seeing that their probability of success is dropping) versus the second with a clear guardrails plan in place, we can see how guardrails provide an opportunity to enhance a client’s experience working with an advisor.
How Advisors Can Communicate Guardrails
If most advisors using Monte Carlo are effectively using “uncommunicated guardrails,” then the next step in articulating guardrails is calculating the guardrails themselves. While this process has been covered in greater depth previously on Nerd’s Eye View, the process effectively comes down to “solving for” each of the guardrails components in dollar terms.
This process can admittedly be a bit cumbersome in traditional Monte Carlo software, but it can be done nonetheless. For example, an advisor trying to solve for a set of guardrails would do the following:
- Calculate the initial spending level that is reasonable given a client’s portfolio size. For the sake of illustration, let’s continue the examples above and assume that the client has a $2 million portfolio, and their advisor would like to target an initial 95% probability of success. The advisor puts the client’s plan into their software and calculates that an initial spending level of $100,000 would provide a 95% probability of success. We now have the initial portfolio value and initial spending level.
- Solve for the portfolio values that would hit our guardrail thresholds. Let’s continue the example of using 70% (lower guardrail) and 99% (upper guardrail) as our probability thresholds. An advisor could use a guess-and-check approach to change portfolio values in their Monte Carlo software until they arrive at their threshold probability-of-success levels. Let’s suppose that these levels are $1.6 million for the lower guardrail and $2.5 million for the upper guardrail. The advisor has now solved for their portfolio guardrail triggers (in dollars).
- Calculate spending changes corresponding to the desired adjustment once a guardrail is hit. There are several ways an advisor could define these adjustments. For example, a flat percentage adjustment could be used (for example, increase or decrease by 10%). This would be consistent with methodologies like Guyton-Klinger. However, if we’re using a more sophisticated tool like Monte Carlo, we might as well take advantage of better controlling our risk levels, so let’s say that, in this example, we want to adjust back to a 95% probability-of-success level if increasing spending and up to an 80% probability-of-success level if decreasing spending. The advisor would now guess and check their client’s spending levels (at the higher/lower guardrail portfolio balances) using their Monte Carlo software. For the sake of illustration, let’s just assume that those values are $110,000 in annual spending at the upper guardrail and $90,000 in annual spending at the lower guardrail. We’ve now calculated the adjustments to be made in a manner that rounds out our guardrails.
As noted above, this is a very cumbersome process to do manually. While it may work to calculate these guardrails by hand as a one-time illustration to help understand how risk-based guardrails work, it is hard to imagine an advisor realistically wanting to devote the amount of time it would take to not just build initial plans for 50 to 150 clients this way but also keep those plans up to date and on track. The guess-and-check iterations for determining guardrails don’t happen just once when setting a plan but would need to be carried out every time a plan is updated.
Arguably, this may be one reason why distribution-rate-driven guardrails have been more commonly implemented by advisors. However, distribution-rate-driven guardrails have numerous issues of their own, perhaps most notably their inability to account for real-world spending patterns of retirees such as taking more from a portfolio in the early years of retirement while deferring Social Security and then reducing one’s distribution rate once Social Security kicks in.
Helping Clients Set the ‘Right’ Guardrails
While the peace of mind that can come from the short-term spending plan established by guardrails can be tremendous on its own, there is arguably some uncertainty that could remain for clients. Perhaps a client thinks, “OK, I understand what this guardrail adjustment looks like, but what comes after that? Could this whole plan quickly spiral out of control on me?”
This is a reasonable fear. We know what is around the first corner, but what’s around the second corner? A client may fear that while the first adjustment is palatable, the second, third, or fourth adjustment is much more uncomfortable.
For this reason, finding a way to communicate the long-term income experience of a given guardrails plan can help further provide peace of mind. While there are many ways advisors could do that, one consideration is to “stress test” a plan through some of the worst historical sequences we’ve seen. While there’s no guarantee that future market sequences couldn’t be even worse, clients may gain some peace of mind by seeing how going through known bad markets would have looked.
For example, the advisor could show a client what adjustments they would have faced when encountering the worst sequences in US history, such as the Great Depression, the stagflation era, the dot-com bubble, or the global financial crisis.
Perhaps such an exercise could show a client how their spending (shown in the first image below), as well as their portfolio balance and guardrails thresholds (shown in the second image), would be impacted if they retired just before the financial crisis hit, providing an illustration that looks like the following:
Income and Guardrail Scenario for Individual Retiring November 2007 Through 2024
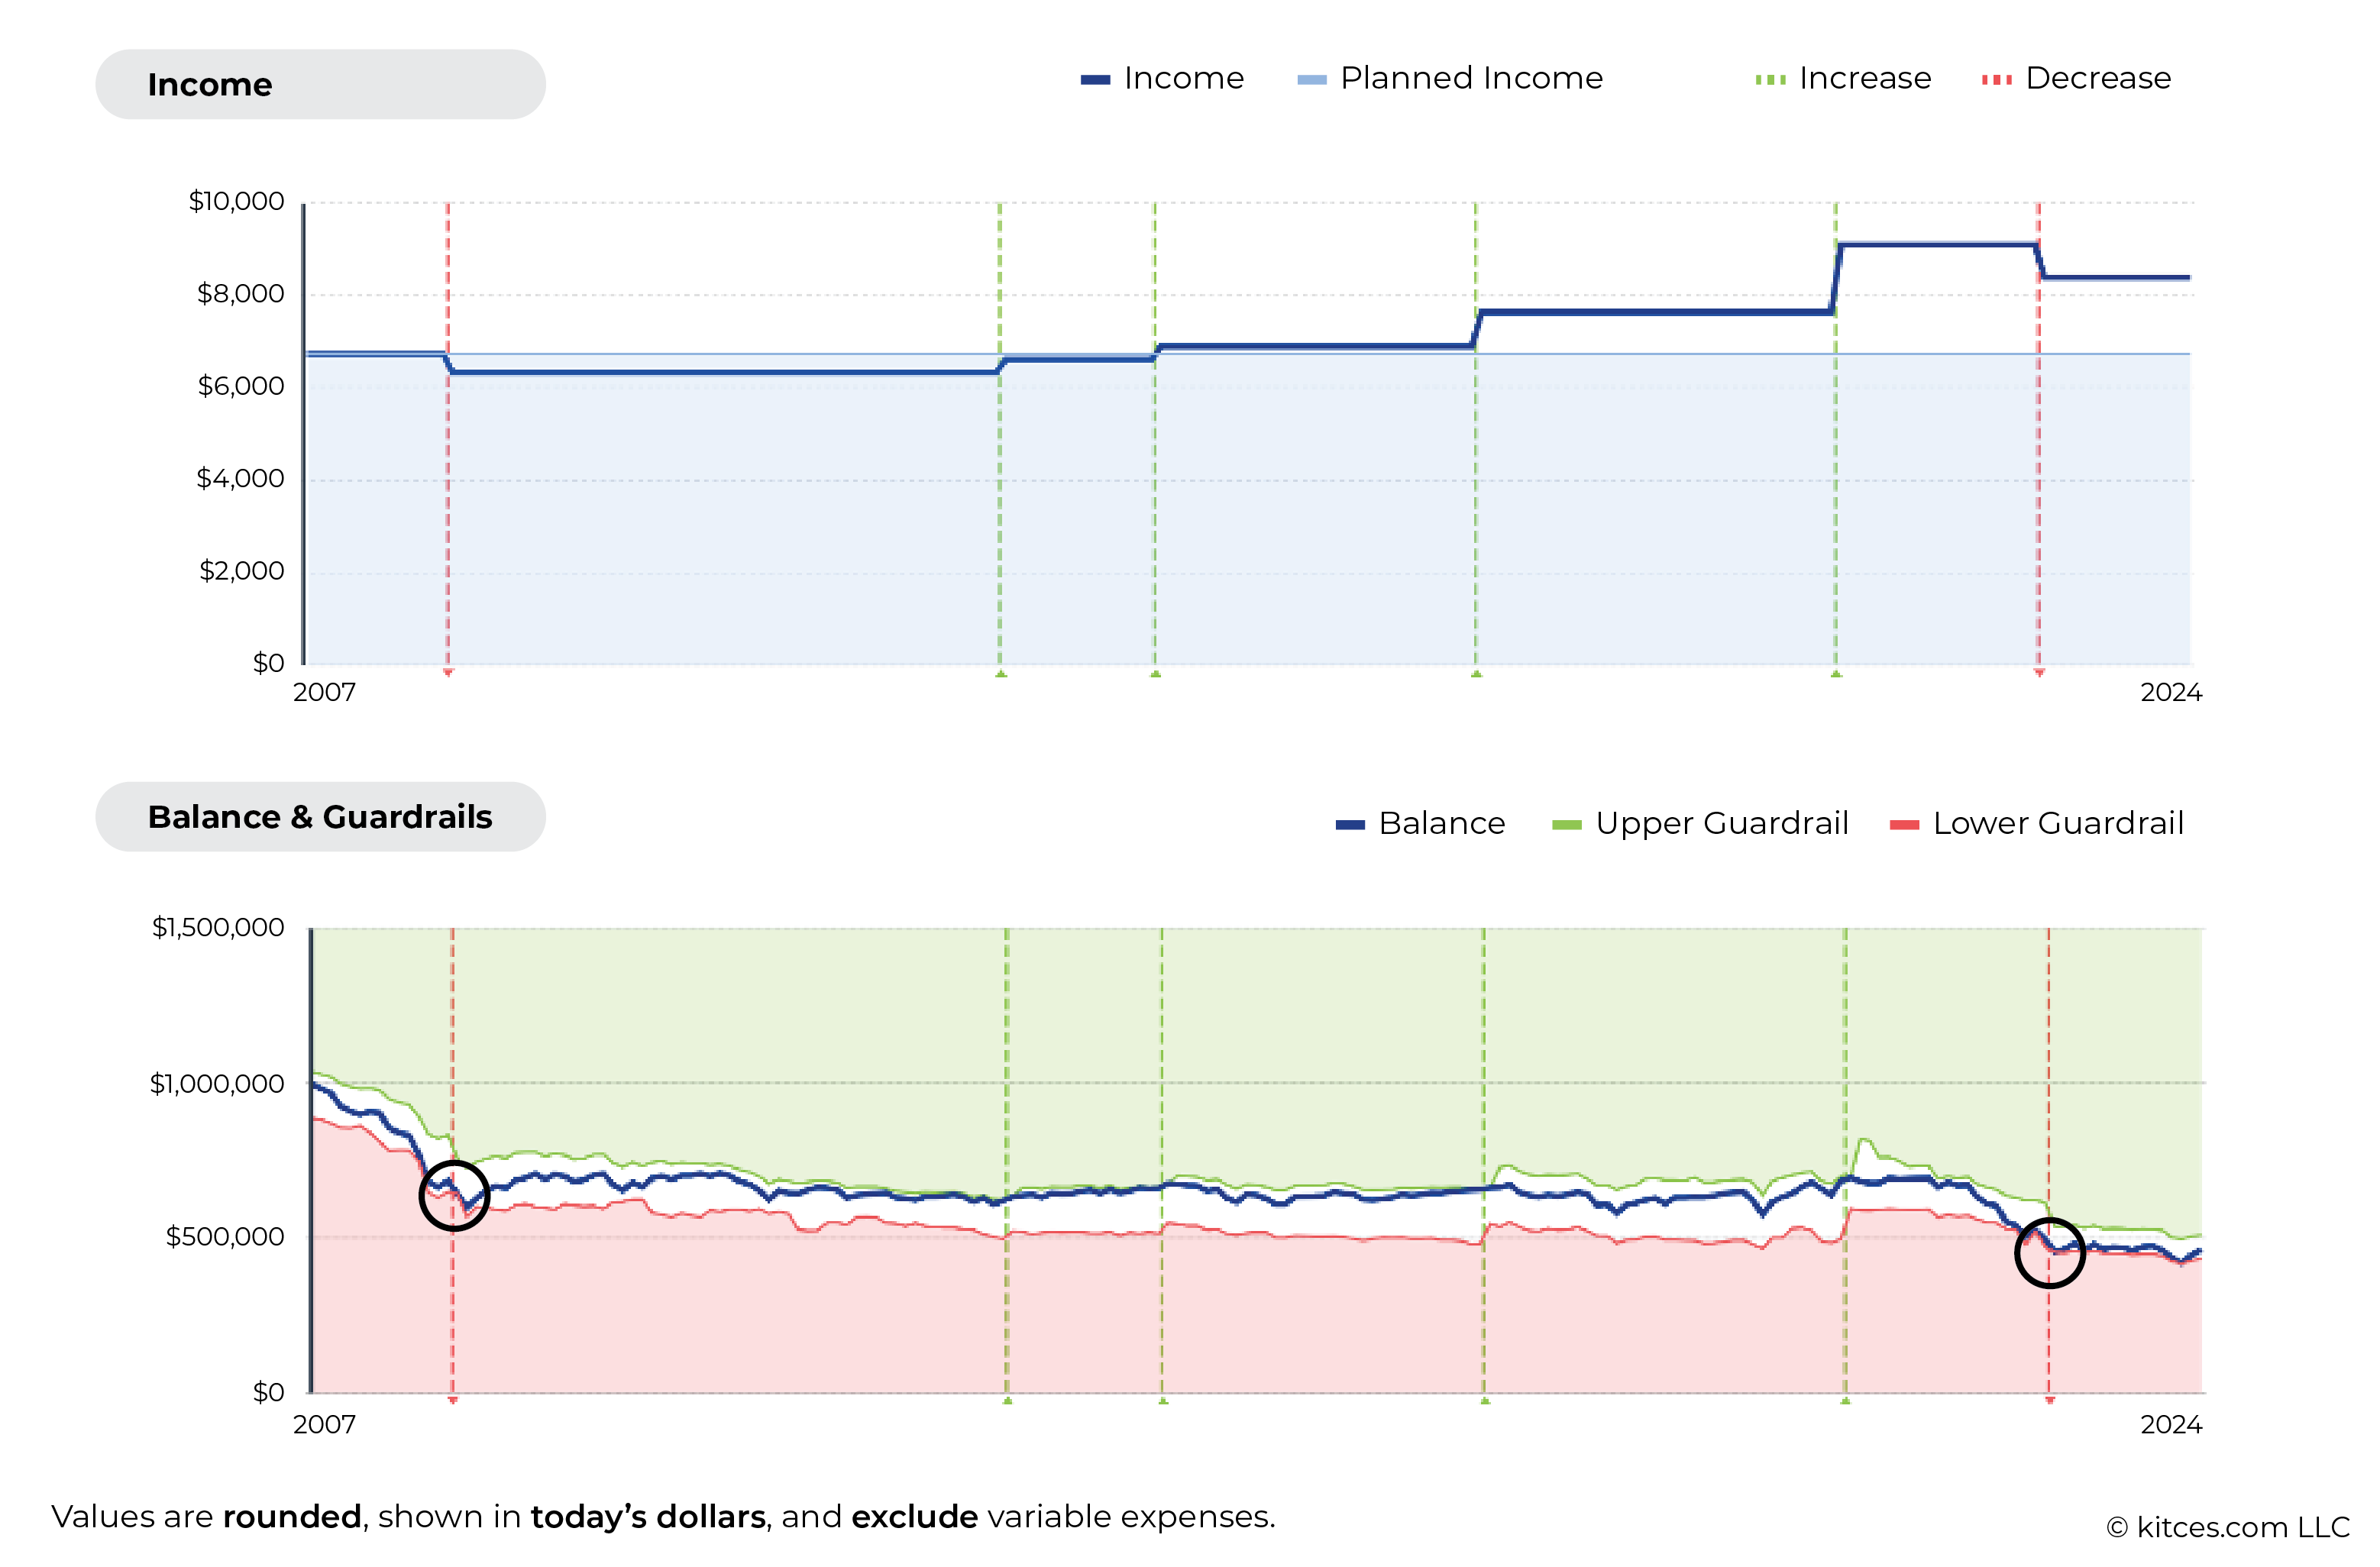
The chart shows both downward spending adjustments (red dotted lines) and upward spending adjustments (green dotted lines). As the second image shows, once the portfolio balance hits the lower guardrail, then we trigger a decrease in spending.
As we can see, if a retiree had used this particular guardrails strategy while retiring just before the financial crisis, they would have faced a spending cut of about 6% relative to their planned income near the onset of retirement.
While some retirees might be comfortable with this level of retirement income risk, others may feel like they would like less risk of a potential spending reduction and they would like to preserve more of a retirement portfolio balance going through a similar downturn.
One major advantage of risk-based guardrails over distribution-rate guardrails frameworks like Guyton-Klinger’s model is that advisors can have a tremendous amount of control over the adjustment parameters. We can adjust the upper guardrails, lower guardrails, and actions triggered at the guardrails. For some who want to really guard against downward-spending-adjustment risk, it might even be prudent to forgo income increases entirely, allowing a plan to effectively build up more of a reserve. Alternatively, strategies such as annuitization could play a role in providing a more significant income floor.
So, let’s assume a retiree looked at the chart above and thought they wanted to choose a more conservative guardrails strategy. Perhaps the advisor could adjust the initial targeted probability of success to be higher and raise the threshold for upward adjustments, resulting in a stress test that looked like the following (which includes a comparison to the “aggressive” income levels and portfolio balance shown in yellow below, identical to the scenario illustrated in the previous graphic).
Income and Guardrail Scenario for Individual Retiring November 2007 Through 2024 (Conservative vs. Aggressive Guardrails)
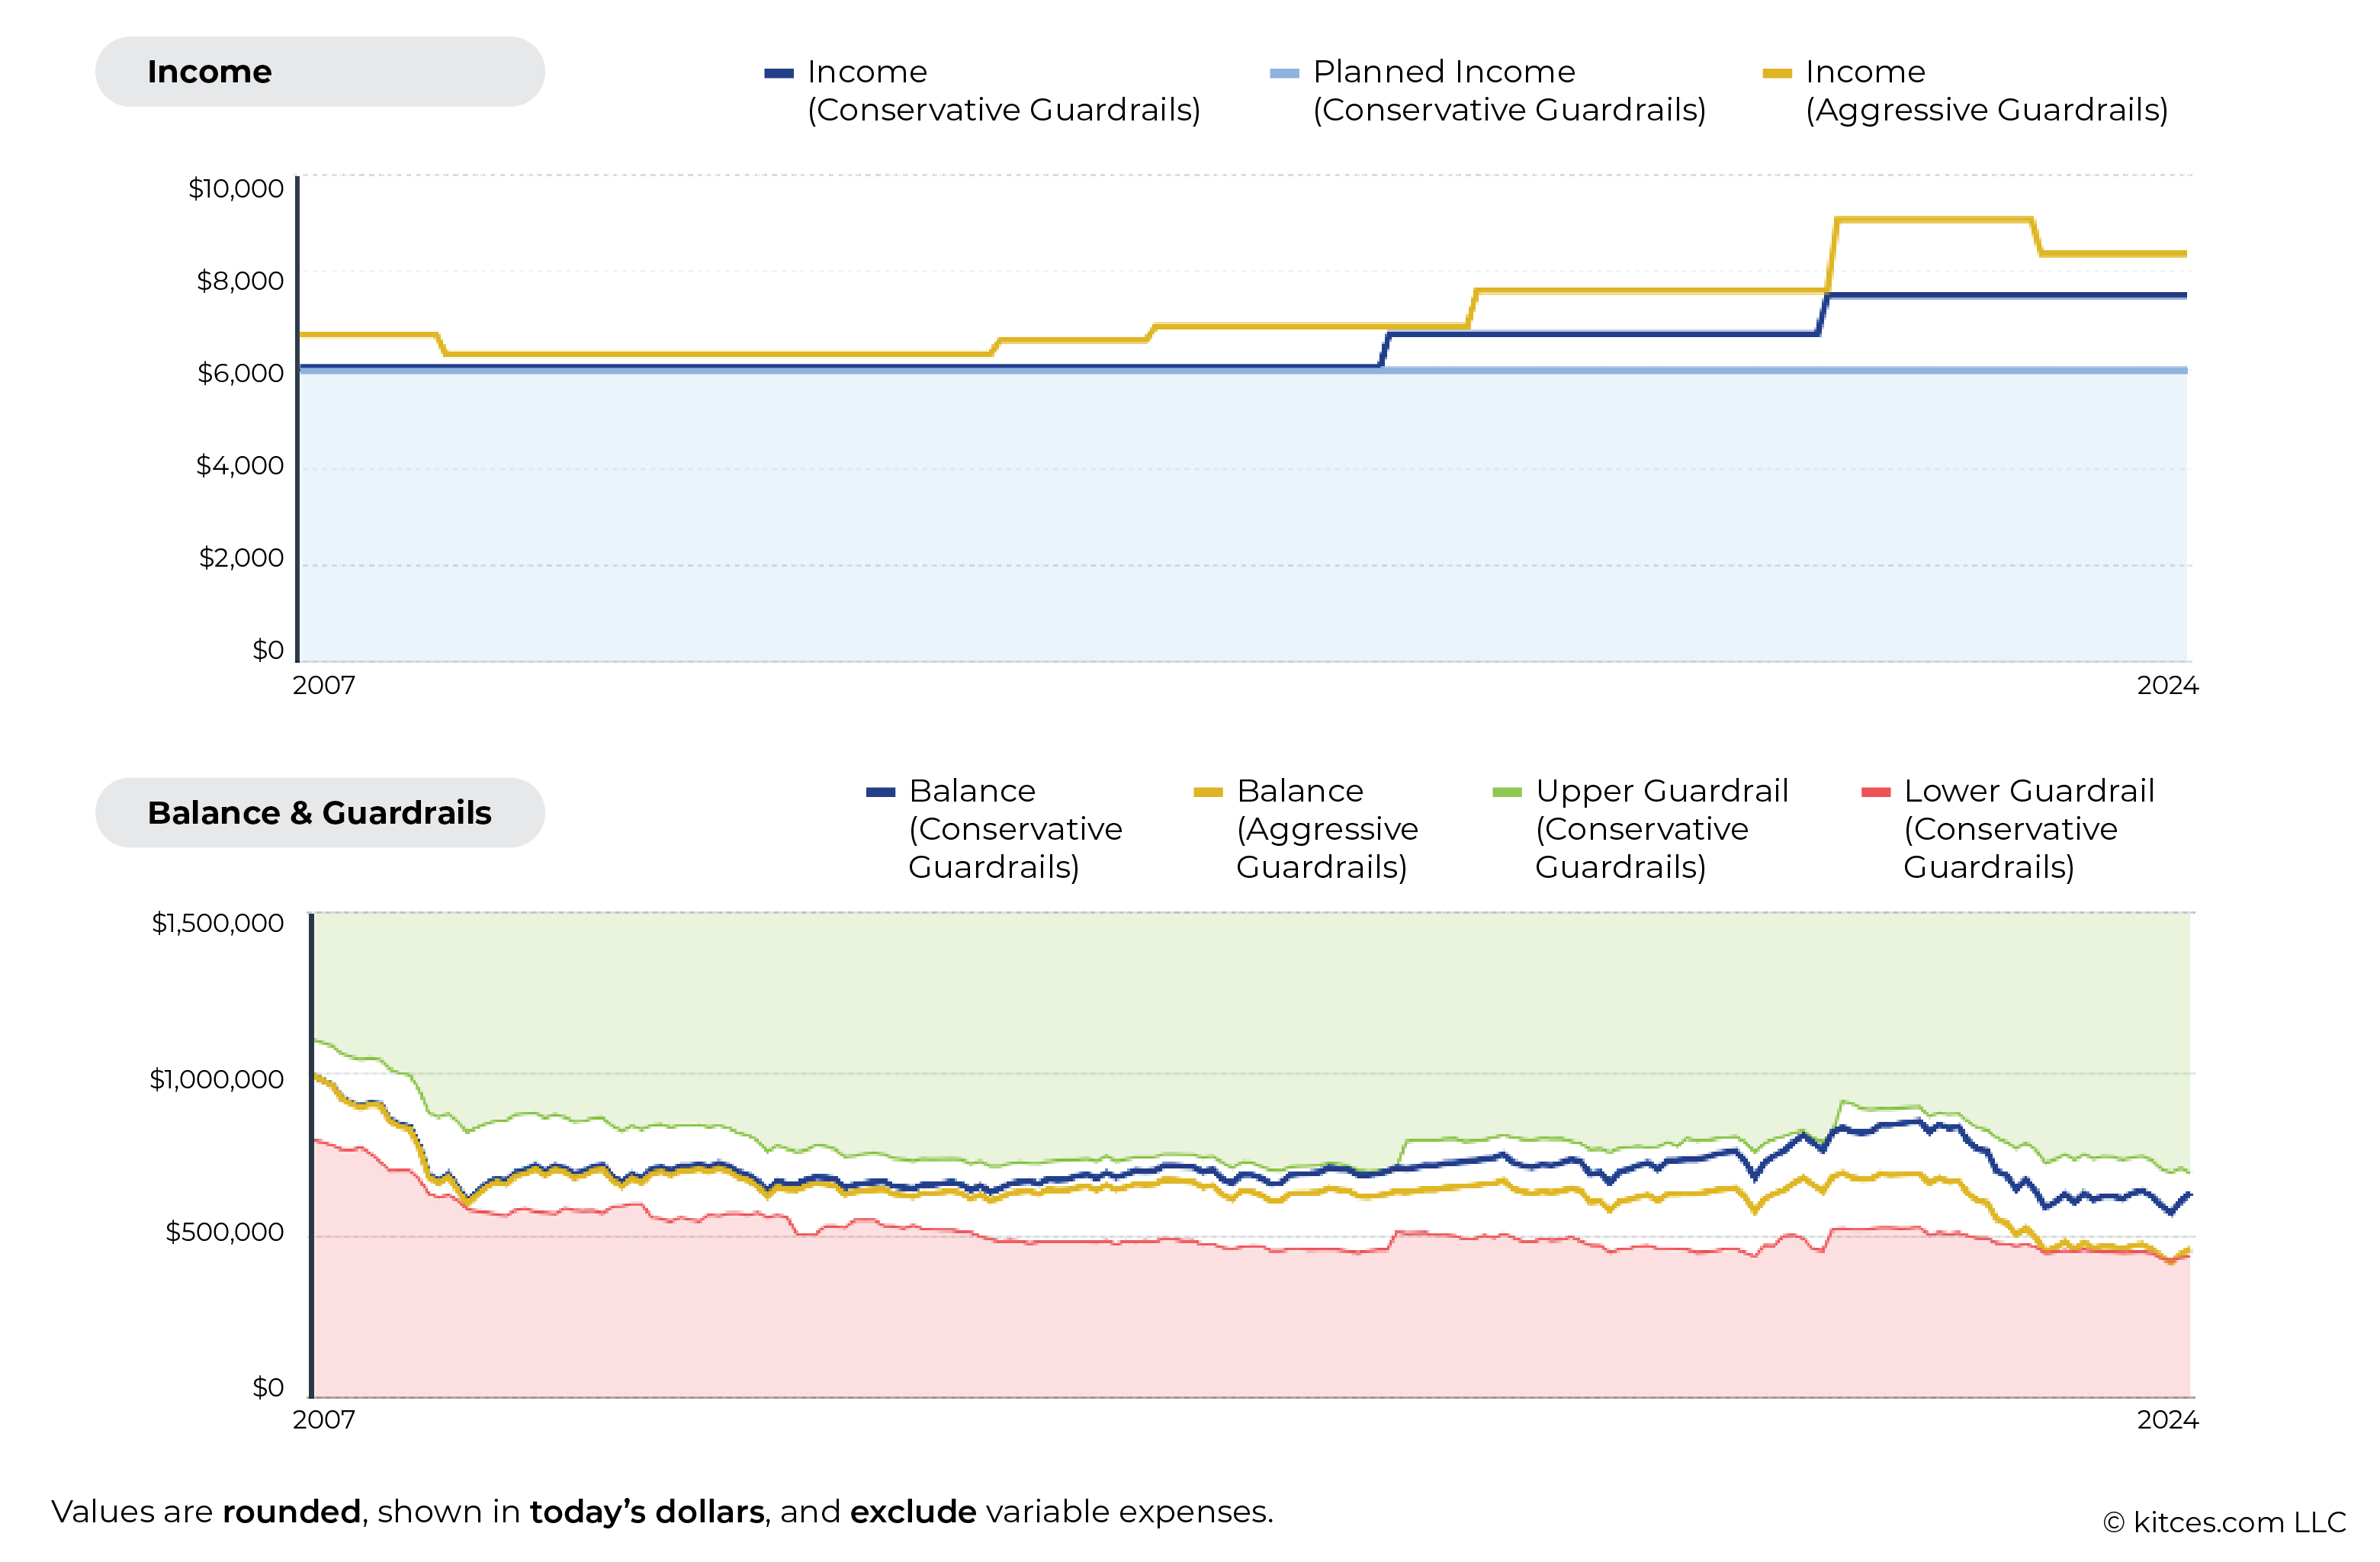
Now, as we can see, the decline during the financial crisis was not significant enough to result in a client ever hitting their more conservative lower guardrail (in contrast to the lower guardrail being crossed twice in the more aggressive example illustrated earlier). Looking at their portfolio values, we can see that the portfolio did experience a similar decline, but the upper and lower guardrails also move around as total risk factors change in a client’s plan, and, in this case, the lower guardrail was narrowly missed in 2009. From this point forward, we see that the retiree was able to maintain spending at their planned level until the prolonged bull market coming out of the financial crisis led to several increases in spending as the client’s upper guardrail was hit.
To further continue the stress test, perhaps the advisor can also show the client how their guardrails strategy would have fared during the Great Depression, the stagflation era, and the dot-com bubble. If the client is comfortable with the downward risk seen historically for their particular set of guardrails parameters, then the advisor can determine that this is a good guardrails plan and proceed accordingly for the client.
With this extra step in place of not just establishing the short-term income plan but also helping the client understand the long-term prospects of the strategy they have in place, advisors can further reduce the potential anxiety associated with navigating bear markets.
Going back to the initial example, our retiree with $1.8 million in their portfolio knows that their spending won’t need to be reduced until their portfolio reaches $1.6 million, but they’ll also know that the spending reductions they would have faced during the worst times in US market history would have been tolerable. In other words, there are no monsters lurking behind the second or third adjustments, at least to the extent that a bear market isn’t worse than the worst periods we’ve seen in US history.
Unfortunately, there is no real way to carry out this exercise in typical financial planning software. Currently, we’re only seeing these types of capabilities in specialized retirement income planning software.
Ultimately, the key point is that how advisors present plan results to clients can have a significant impact on a client’s experience and the stress they feel going through a market downturn. Monte Carlo simulation alone, even if guided by “uncommunicated guardrails,” leaves a lot of uncertainty that can result in stress among clients. Furthermore, since watching a portfolio balance decline is already stressful, a client who is simply watching probability-of-success levels decline concurrently might only be more stressed seeing those probability-of-success numbers.
However, by using guardrails to express potential short-term adjustments in dollar terms, clients can gain some peace of mind with respect to when a first cut would be called for and what that cut would be. Particularly if a client is comfortable with that cut, the ability to plan ahead for it can provide a tremendous amount of confidence during a downturn. Additionally, the ability to communicate long-term income experiences of a given plan and make modifications to ensure that a given strategy is tolerable for a given client can further reduce anxiety that clients may feel during downturns. At least to the extent that downturns are no worse than the most painful bear markets we’ve seen in the US to date, clients may be able to have greater peace of mind that they can stomach not just an initial cut but also subsequent cuts that could come their way!
Disclosure: Derek Tharp is a senior advisor at Income Lab, which carries out analyses like those advocated for in this article and was used to produce the graphics included in the examples in this article.
The author or authors do not own shares in any securities mentioned in this article. Find out about Morningstar’s editorial policies.
/cloudfront-us-east-1.images.arcpublishing.com/morningstar/EC7LK4HAG4BRKAYRRDWZ2NF3TY.jpg)
/d10o6nnig0wrdw.cloudfront.net/07-24-2024/t_99436285e257449398ad25308659356e_name_file_960x540_1600_v4_.jpg)