
Retirement Asset Allocation: Incorporating Guaranteed Income
When should investors hold more equities?
/s3.amazonaws.com/arc-authors/morningstar/1aafbfcc-e9cb-40cc-afaa-43cada43a932.jpg)

A Reader’s Request
A reader wrote: “Most retirees have significant sources of income outside of their investment accounts: Social Security and a pension and/or annuities. There should be guidance as to how to incorporate these income sources into the asset allocation calculation. It would be very helpful to provide a column that discusses how one should make such calculations.”
Your wish is my command. Two researchers, Dr. David Blanchett (formerly of Morningstar) and Dr. Michael Finke, have tackled this topic in a paper called “Annuitized Income and Optimal Equity Allocation.” Jackpot! I save a great deal of time, as modeling this problem is laborious, and you get a better answer, because their methodology is considerably more thorough than mine would have been.
2 Retirees
Imagine two couples who are freshly retired. Of the same age and equally wealthy, they share identical spending goals. They differ only in the composition of their wealth. The first couple, which earned a low salary but gained an inheritance, relies mostly upon investments. The second is in the opposite position, receiving high guaranteed income from the combination of large Social Security checks and a supplemental pension while possessing a much smaller nest egg.
We can directly compare their fortunes by converting the income payments into balance-sheet assets, thereby placing them on the same scale as the investment holdings. The authors accomplish that task by using a formula that would require the rest of this article to explain. For this illustration, though, I will simply assume that each future dollar of annual Social Security payments is worth $30 today.
2 Retirement Couples
| Annual Income | Balance-Sheet Income | Investment Assets | Guaranteed Income | |
|---|---|---|---|---|
| Couple #1 | $20,000 | $600,000 | $1,800,000 | 25% |
| Couple #2 | $60,000 | $1,800,000 | $600,000 | 75% |
If paid fair value for their financial resources, each couple would receive the same amount. However, their situations are in a critical aspect dissimilar. The first couple begins with a 25% fixed-income allocation, while the second starts with a 75% stake. Whatever the proper asset allocation for the first couple’s portfolio, it cannot be the fitting solution for the second couple. The answers must differ.
How the Model Works
But how? Blanchett and Finke put numbers to the intuition. Their approach is as follows.
1) Assume a married couple (male and female), both age 65.
2) Forecast their expected life spans using the Society of Actuaries Immediate Annuity Mortality Table.
3) For each succeeding year, probability-weight the chance that at least one household member will still be surviving.
4) Stipulate that each household consumes a combination of fixed real income (for nondiscretionary costs) and income that floats with the size of the investment portfolio (for discretionary expenses)
5) Model expected stock and bond returns using forecasts from Morningstar’s Investment Management division.
6) Assess an annual portfolio-management fee of 0.50%.
7) Run 1,000 Monte Carlo simulations, scoring the results through a constant relative risk aversion utility function, or CRRA.
I provide the particulars not to convince you that the authors’ recommendations are correct—no such assurances can be made with computations that require so many assumptions. Besides, investment circumstances have changed since the paper was published. My purpose instead is to show that the study was very carefully constructed. At the very least, its findings are directionally accurate.
Recommended Allocations
With that in mind, let’s examine some of its findings, returning to our two retirees. Not entirely coincidentally, the authors model each couple’s situation, providing estimates for when the guaranteed income accounts for 25% of future wealth, as well as for 75%. Below are the suggested equity allocations for each investment portfolio, assuming a 4% stipulated withdrawal rate and moderate preferences for both the stability of the income stream and a bequest motive.
Equity Allocations for 4% Withdrawal Rate
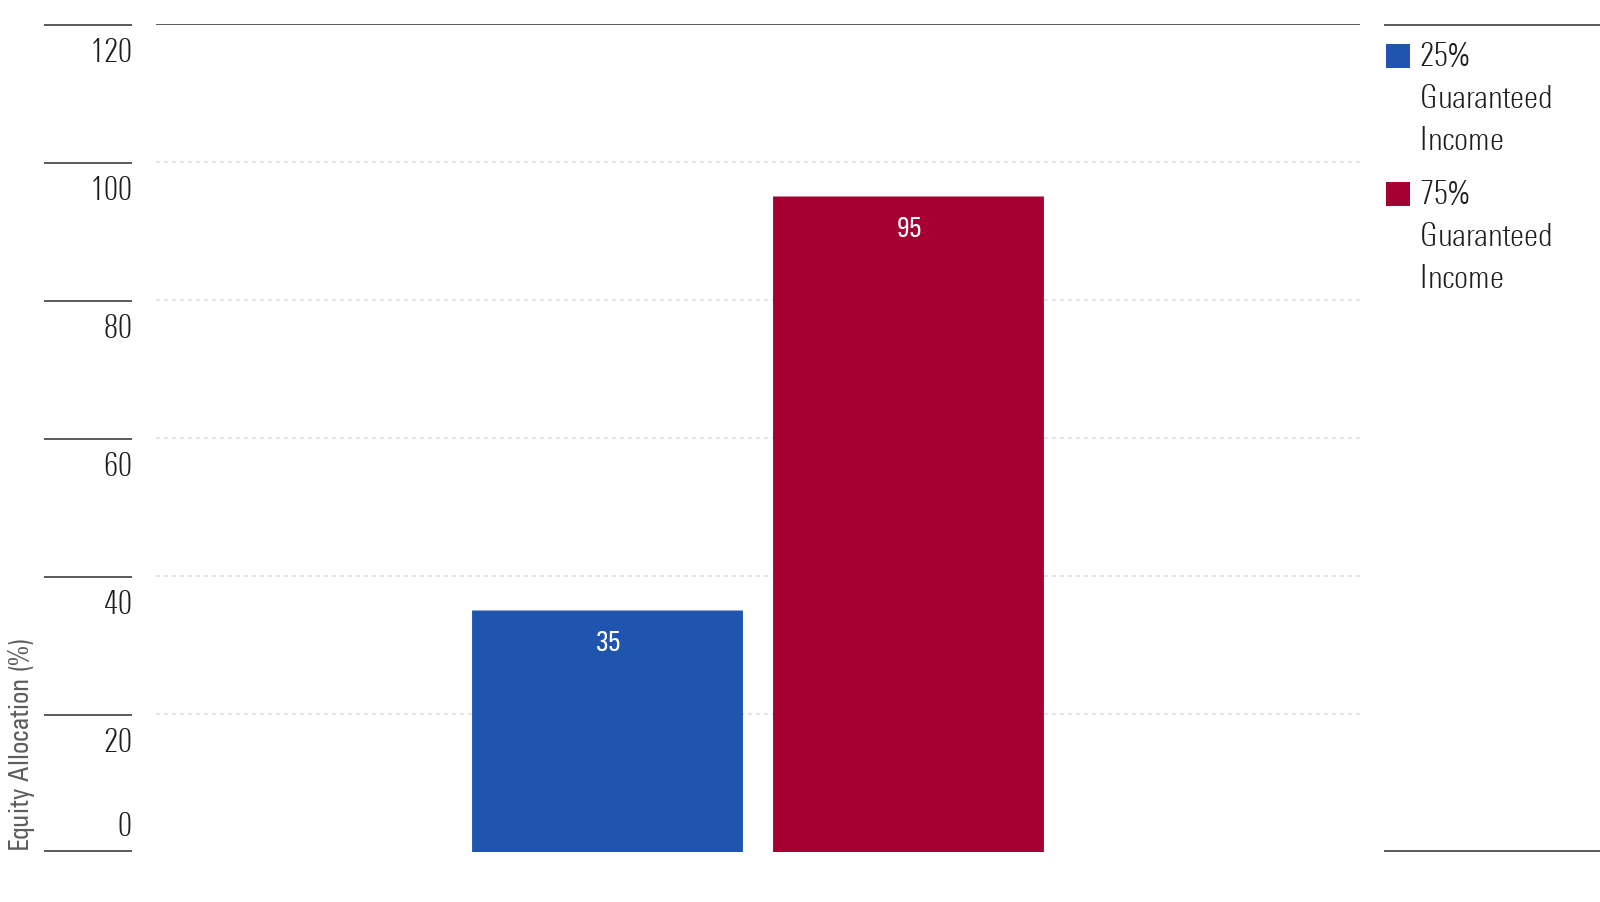
Well, that’s a contrast! But of course, the discrepancy makes sense, given the difference in starting points. Multiplied by the 75% position occupied by their investment assets, the first couple’s 35% equity weighting computes to an overall stock market exposure of 26%. Meanwhile, even with a 95% equity position, the second couple has total stock market exposure of only 24%. Effectively, the investors land in almost the same place.
With Different Withdrawal Rates
Here’s how the recommendations would change when holding all assumptions constant except for the withdrawal rate. The table below depicts the model’s guidance for 2% and 6% withdrawal rates, along with the previous 4%.
Testing Alternate Withdrawal Rates (Assuming Moderate Income Stability and Bequest Preferences)
| Withdrawal Rate | Guaranteed Income | Equity Allocation |
|---|---|---|
| 2% | 25% | 60% |
| 75% | 100% | |
| 4% | 25% | 35% |
| 75% | 95% | |
| 6% | 25% | 55% |
| 75% | 90% |
Halving the withdrawal rate to 2% from 4% has the anticipated result of increasing the equity allocation. Why not assume more risk when one’s required spending needs are easily met?
However, raising the withdrawal rate to 6% leads to a mixed result. Following the established logic, the second couple is instructed to reduce their equity allocation. But the recommendation for the first couple is once again to increase the equity allocation. Cut the withdrawal rate, buy more stocks. Raise the withdrawal rate, buy more stocks. The paradox occurs because the 6% rate is overly ambitious. When facing a high possibility of failure, the model concludes, it is better to invest boldly and hope the markets cooperate than to concede by being too cautious.
Besides the 25%, 50%, and 75% cases, the authors provide the figures for 5% and 95%. Also, they model how the allocations vary for other income stability and bequest preferences. In all, they provide their recommendations for five levels of guaranteed-income percentages, with five withdrawal rates, across nine combinations of preferences. As that makes for 225 asset-allocation suggestions, please see Table 3 in their paper if you seek further details. I will not provide them here.
Conclusion
This topic is not well suited for back-of-the-envelope solutions. It contains several moving parts, which are difficult if not impossible to integrate without using a formal model. Perhaps Morningstar will build such a model, update it with current market data, and make it available on this website. (I will lobby for that event.) Until then, though, the authors’ paper can certainly provide useful guidelines.
The opinions expressed here are the author’s. Morningstar values diversity of thought and publishes a broad range of viewpoints.
The author or authors do not own shares in any securities mentioned in this article. Find out about Morningstar’s editorial policies.
/cloudfront-us-east-1.images.arcpublishing.com/morningstar/WNDFS2S4FNA6LEJDB2Y6E4XHYQ.png)
/cloudfront-us-east-1.images.arcpublishing.com/morningstar/YBH7V3XCWJ3PA4VSXNZPYW2BTY.png)
/cloudfront-us-east-1.images.arcpublishing.com/morningstar/EC7LK4HAG4BRKAYRRDWZ2NF3TY.jpg)
:quality(80)/s3.amazonaws.com/arc-authors/morningstar/1aafbfcc-e9cb-40cc-afaa-43cada43a932.jpg)