
Static-Dynamic Factor Attribution--Another Dimension
Morningstar's new static-dynamic attribution tool provides more insight into how well factor exposure adjustments were timed.


It is relatively clear how to assess whether a particular stock investment did well. There is a purchase price and a sale price. This gives an exact return by which to measure performance. Looking at the stock’s price chart, one can assess how well the investment was timed. But this tells us very little about why the stock performed well.
We have a lens for stock returns that looks at returns as a sum of returns of risk factors. Risk factors are drivers of return that are common to all stocks. We can imagine that the returns of stocks and stock portfolios are driven by factors. Examples include value-growth, quality, and momentum style factors or technology and healthcare sector factors. Each day, these factors will apply a small force to the stocks, and on any given day, one factor could be forcing the price up and another down. In our models, we use a small number of factors, in the order of 30 to 40, to model the movements of tens of thousands of stocks worldwide.
A fund’s investment style can be broadly categorized by its exposure to the size and value-growth risk factors, such as large growth or mid-cap blend. This still leaves room for meaningful differences in factor exposures or portfolio allocations between sectors or other factors.
As a portfolio’s diversification and analysis time span increase, the risk factor returns tend to explain a large portion of a portfolio’s returns. When you buy a stock, you buy into its set of risk factor exposures. In turn, a portfolio’s total risk factor exposure position is the aggregate over all its holdings. So, each time a stock is bought or sold, the portfolio’s net exposure to each risk factor potentially changes. That is, every investment decision potentially affects all the risk-factor exposures. On top of this, each stock’s set of exposures slowly changes with time. Because of this lack of separability, it is difficult to pinpoint exactly when an exposure to a risk factor began and ended.
However, we would like to be able to make clean statements about the success or failure of each of a portfolio’s risk factor exposures. This is where performance attribution comes in. How much of a portfolio’s return was due to being exposed to each of the risk factors? And how much was instead due to stock-specific drivers beyond what the risk factors cover?
Morningstar's Performance Attribution tool attributes a portfolio's return over a chosen time span to a set of risk factors and a stock-specific category. Our improved methodology accounts for the interactions between daily returns that occur because of compounding and attributes the interactions across the interacting factors.
Morningstar is also extending the attribution suite with a new static-dynamic attribution tool. The tool provides more insight into how well the factor exposure adjustments were timed. The attribution to each factor is further split into static and dynamic components. A factor’s static attribution represents the returns attributable to the factor’s average exposure over the considered time span. The factor’s dynamic component represents the returns attributable to deviations from this average exposure.
In essence, a factor’s dynamic attribution aims to reflect the correlation between the factor’s exposures and premia. If the factor’s exposures and premia tend to deviate up and down together, they are correlated, and this will cause a positive factor dynamic attribution. If their deviations are independent, the dynamic attribution will be zero. Regardless of a factor’s dynamic attribution, its static attribution may be positive or negative, depending on its average exposure and the average premia.
We explore an example to explain the idea of the new static-dynamic attribution. A fictitious investor switches from the value fund LSV Value Equity LSVEX to the growth fund MainStay Winslow Large Cap Growth MLAAX at the end of August 2018. We assess the value-growth static-dynamic attribution over the five-year time span 2016-20 inclusive.
The components contributing to the static-dynamic attribution are presented in the chart below. The yellow solid line is the exposure to the value-growth factor, the yellow dotted line is the mean exposure, and the area between is shaded yellow to highlight when the exposure is above/below the mean. The blue line is the cumulative-sum premia, and the red line is the cumulative-sum contributions to the multiperiod dynamic attribution. We note that while compound premia might seem more normal, it is the cumulative-sum premia that more directly helps interpret the cumulative-sum dynamic contributions.
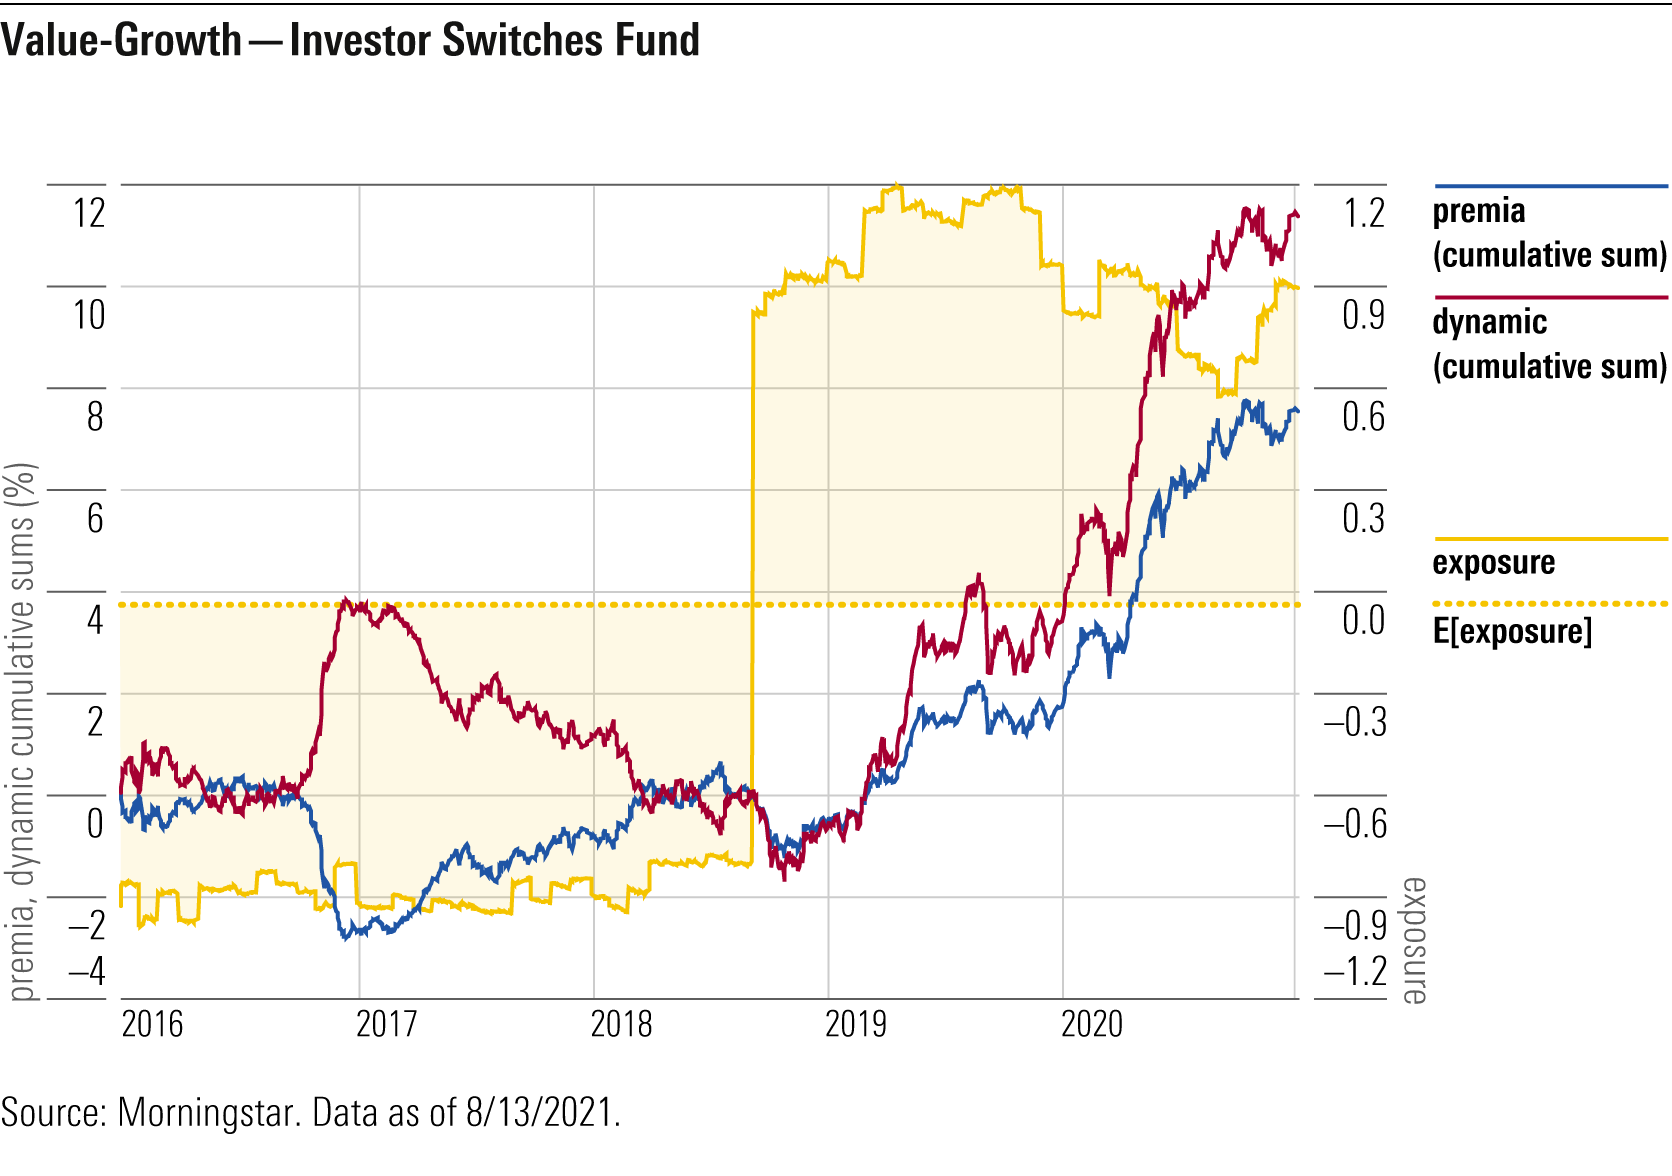
The average exposure was near 0. Before the switch, the exposure was below average at approximately negative 1, corresponding to a value position, while the premia fluctuated, netting to approximately 0%. Since the exposure was below its average, the cumulative dynamic component mirrors the premia, netting to approximately 0%.
After the switch, the exposure was above average, fluctuating near 1, which corresponds to a growth position, while the premia had a positive run, accumulating to approximately 8%. The positive exposure deviation from the average coincides with the net positive premia, so this period contributes positively to the dynamic attribution.
Put together, we have a period of below-average exposure with below-average returns, followed by a period of above-average exposure with above-average returns. The exposure and premia are positively correlated, so we expect a positive dynamic attribution.
The standard attribution tells us that the value-growth factor was responsible for 10.9% return over the five-year period. The static-dynamic attribution extension provides the additional insight that the timing of the value-growth exposures generated 11.3% return, while the average exposure position produced negative 0.5% return. Quite a different story.
The static-dynamic attribution adds an extra dimension to standard attribution, quantifying how much of the return can be attributed to the general exposure strategy, how much to relatively short-term tactical exposure adjustments, and how much to the specific stocks selected. By assessing performance from this perspective, one can reach a better understanding of what drove their portfolio’s returns, which may inform future decisions.
Details of the new standard and static-dynamic methodologies, along with multiple examples, can be found in the full paper.
/cloudfront-us-east-1.images.arcpublishing.com/morningstar/EC7LK4HAG4BRKAYRRDWZ2NF3TY.jpg)
/cloudfront-us-east-1.images.arcpublishing.com/morningstar/6ZMXY4RCRNEADPDWYQVTTWALWM.jpg)
/cloudfront-us-east-1.images.arcpublishing.com/morningstar/URSWZ2VN4JCXXALUUYEFYMOBIE.png)