
How to Stress Test Fixed Income Strategies
See how Morningstar analysts craft custom stress periods to see if funds are performing as expected.
/s3.amazonaws.com/arc-authors/morningstar/c6bd816b-3f1a-49af-ae14-2efdb6122500.jpg)

Ensuring a strategy performs as expected is an important part of selecting and monitoring an investment.
Below we’ll show you one way, often used by Morningstar fixed-income strategy analysts, to create performance reporting stress periods in Morningstar Direct.
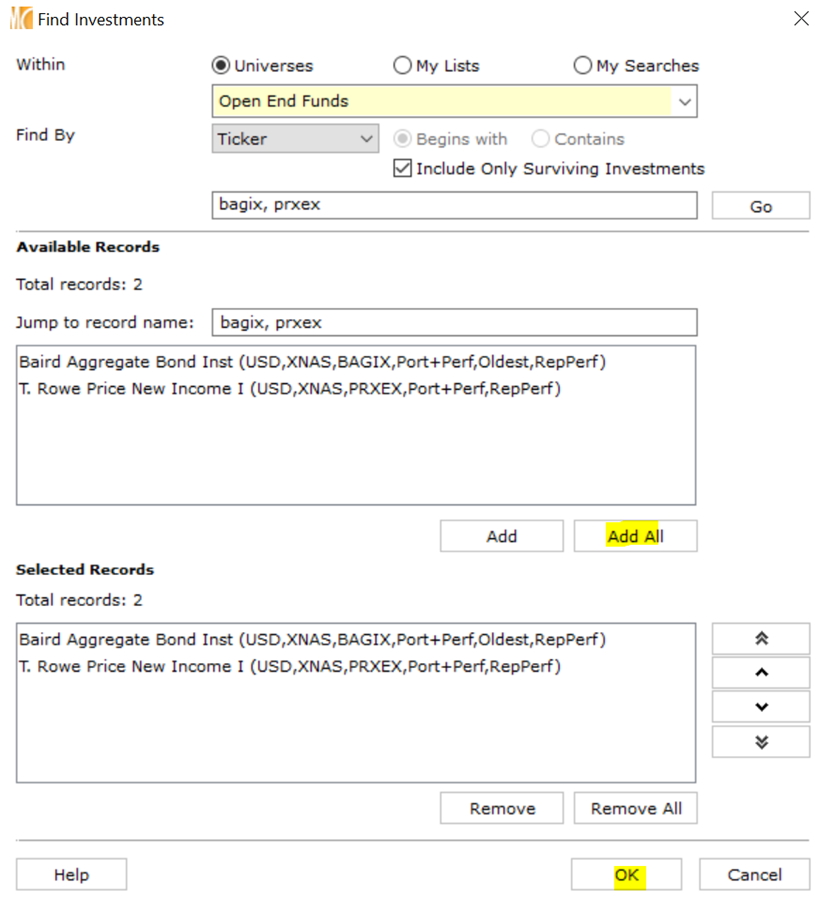
For this exercise, we'll test how Baird Aggregate Bond Institutional (BAGIX), which has a Morningstar Analyst Rating of Gold, and Neutral-rated T. Rowe Price New Income I (PRXEX) held up in two key stress periods: the pandemic-driven sell-off in early 2020 and the first quarter of 2021's interest-rate shock.
1. Go to the Performance Reporting tab of Morningstar Direct.
2. Select “Templates.”
3. Hit “new."
4. Select "multiple investments.”

5. Enter Baird Aggregate Bond Institutional (BAGIX) and T. Rowe Price New Income I (PRXEX) (use tickers separated by a comma to add both at once).
6. Hit OK.
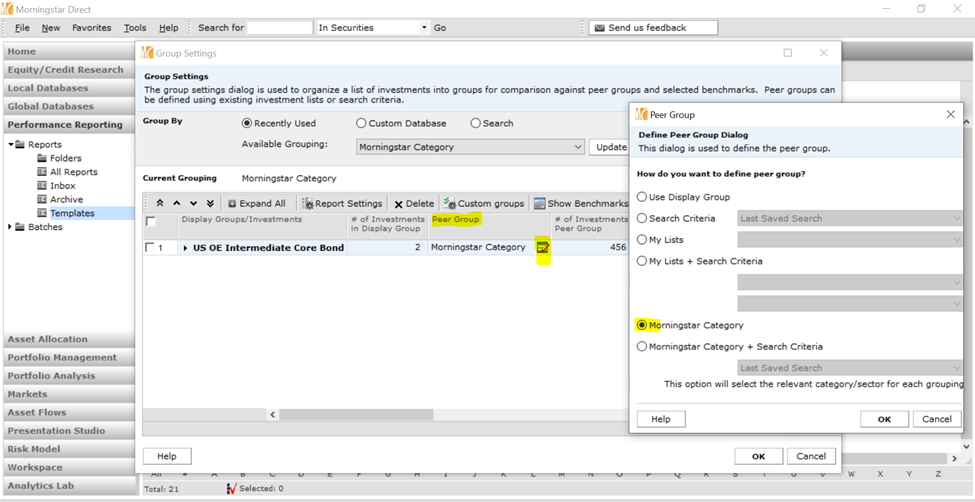
7. Within the “Group Settings” box, pull in a peer group. You can create custom peer groups, but to keep this example simple, let’s use the intermediate core-plus Morningstar Category. To do so, select the pencil in the “Peer Group” box.
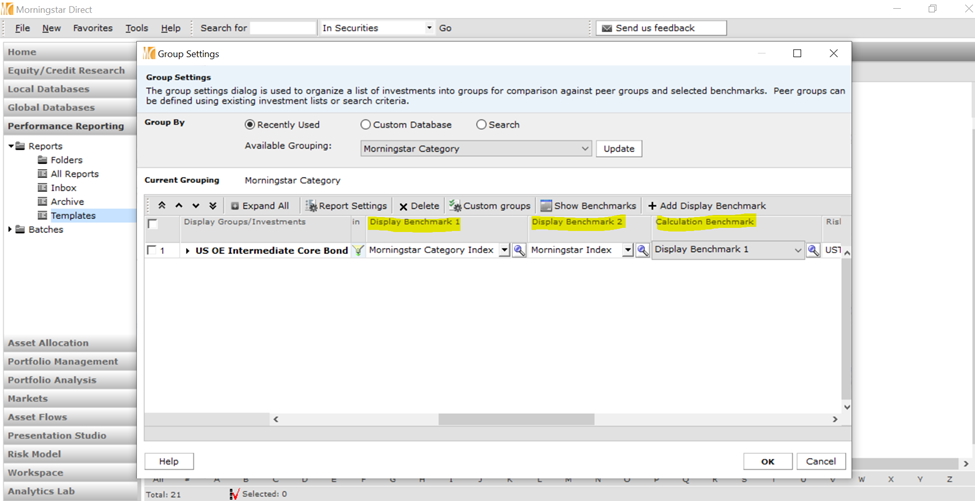
8. Within the “Group Settings” box, select two preferred display benchmarks and one calculation benchmark.
- Our ratings committee likes to see the category benchmark as well as the strategy's primary prospectus benchmark (or the appropriate Morningstar benchmark).
9. Hit OK.
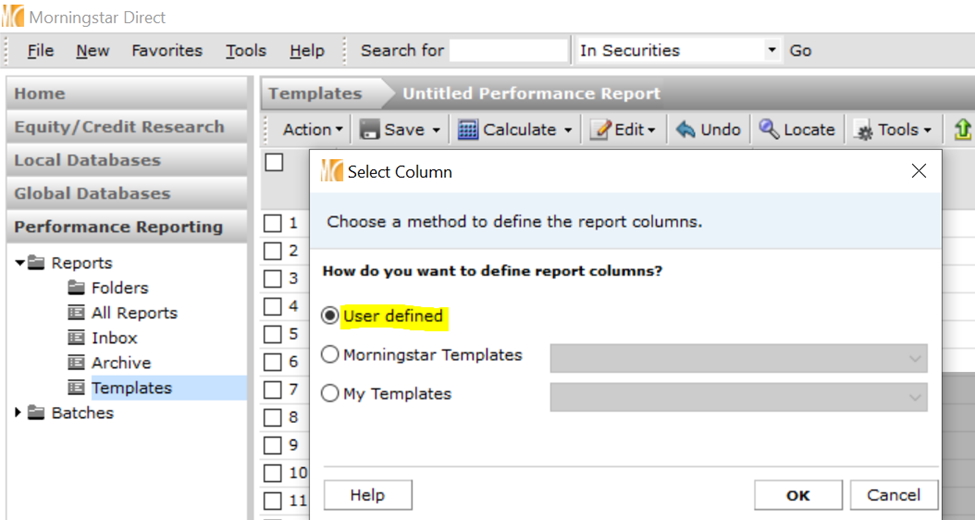
10. A box will appear. Select “user defined.”
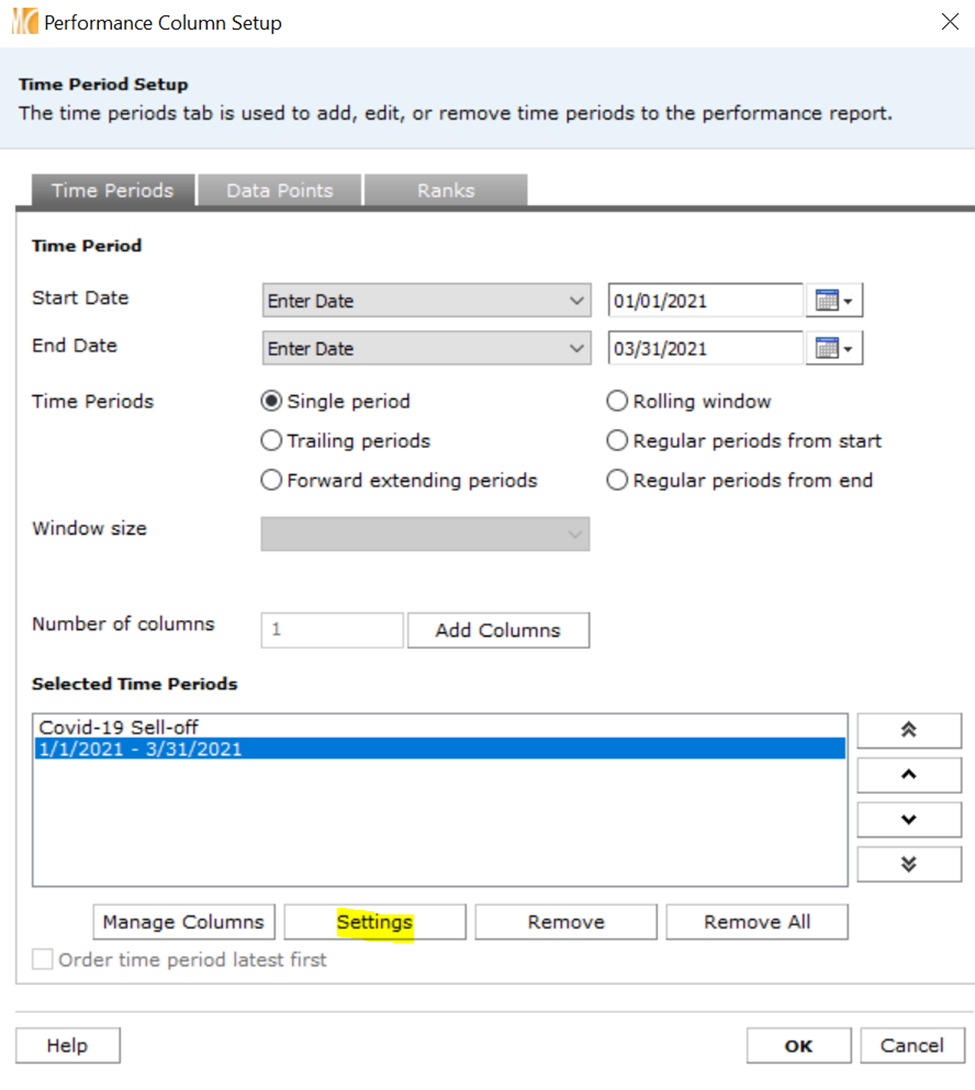
11. In the “Time Periods” tab, put in desired time periods. You can rename them in settings.
- Pandemic-driven Sell-off (2/20/2020–3/23/2020)
- IR Shock (1/1/2021–3/31/2021)
12. In the “Data Points” tab, pull in the “Return” data point.
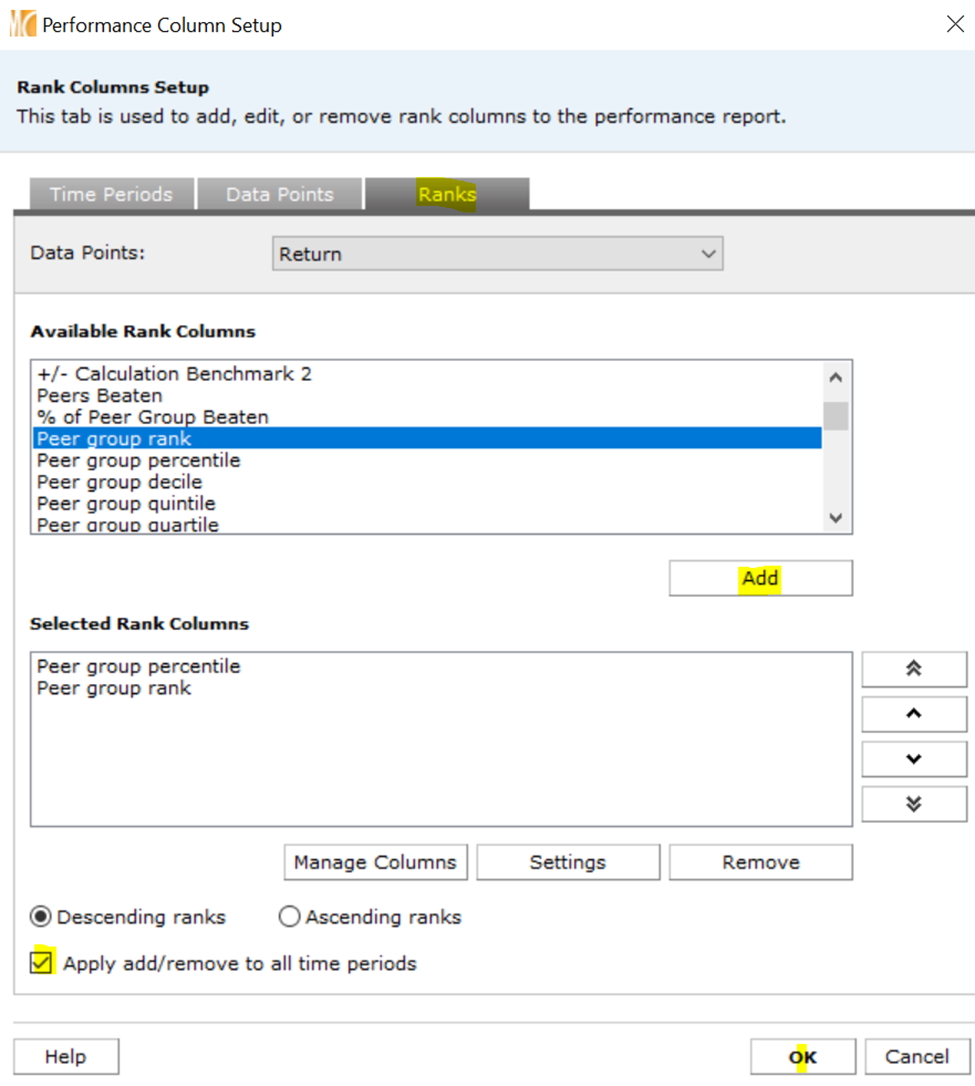
13. In the “Ranks” tab, pull in the desired ranks for return data point, so we can see how the fund performed relative to our chosen peer group.
- "Peer group percentile"
- "Peer group rank"
- Check the "Apply add/remove to all time periods" box
14. In “Supplementary data points,” click OK (No need for additional data points for this).
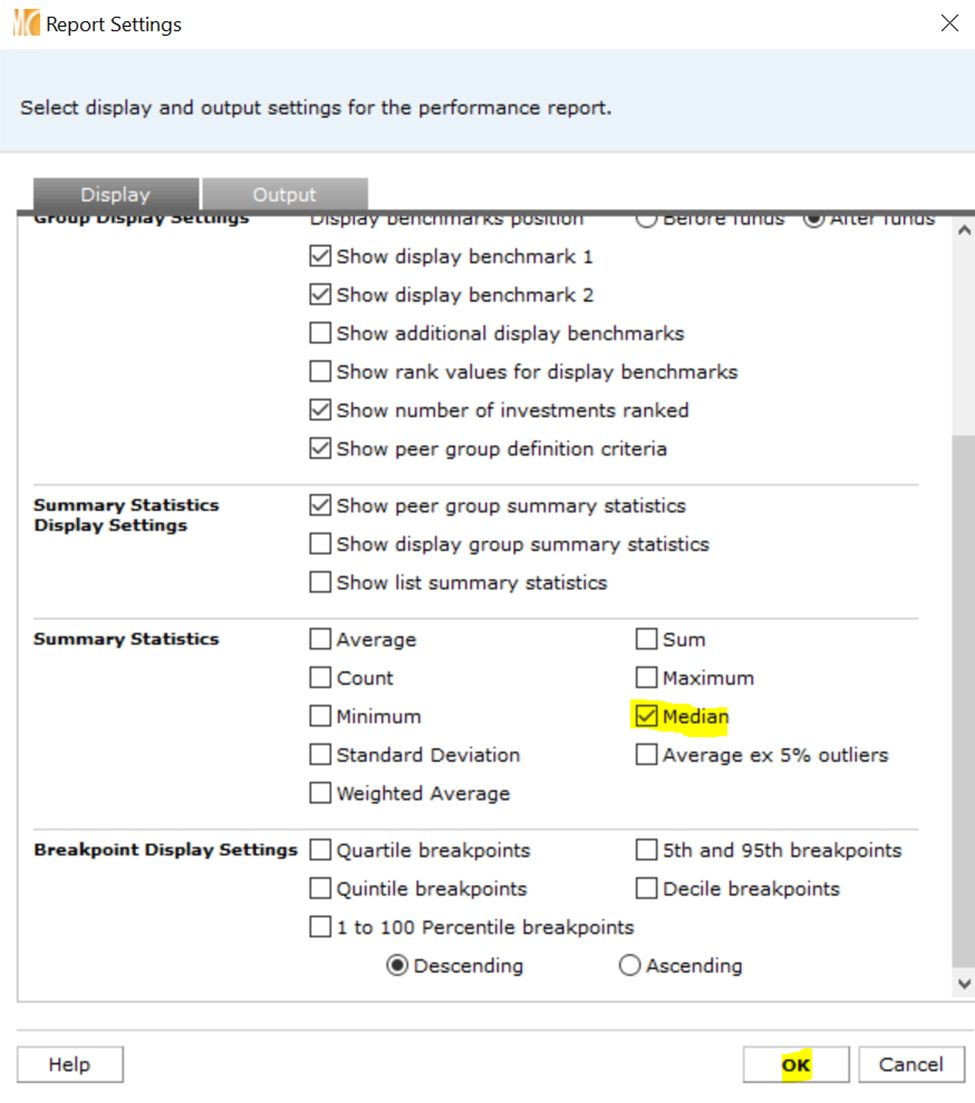
15. If you don’t see “median” measurement under Peer Group Summary Statistics, then complete the steps below.
- Action -> report settings -> check "median" under "summary statistics"
16. Calculate, then save the report as you’d like.

Now, let’s analyze at each performance period.
COVID-19 Sell-off (2/20/2020 – 3/23/2020)
What happened?
- Lower-rated assets (like high-yield corporate credit) and less-liquid investment-grade securitized credit (think BBB rated structured credit that seemed fine in more-typical credit sell-offs) suffered most as investors flocked to U.S. Treasuries and cash.
IR Shock (1/1/2021 – 3/31/2021)
What happened?
- Rates rose sharply. Strategies with longer durations (or more interest-rate sensitivity) suffered most. More-credit-sensitive securities with shorter durations did well.
Given what we know about each strategy, did they perform as expected?
Gold-rated Baird Aggregate Bond is one of the most reliable strategies in the category because it rarely makes bold bets on industries, sectors, or individual names, and it keeps its duration in line with its Bloomberg U.S. Aggregate Bond Index benchmark. Still, it can be a little more volatile than its peers and index because it leans toward corporate credit and higher-quality securitized fare.
Normally, the strategy should perform in line with or slightly trail peers in credit-sensitive stress periods like the pandemic-driven sell-off, and that’s what it did.
In rate-driven sell-offs, like the 2021 IR Shock period, this strategy should perform roughly in line with its benchmark given its duration neutral stance, which it also did.
Neutral-rated T. Rowe Price New Income is more flexible and less-predictable. The strategy emphasizes corporate and securitized debt over U.S. Treasuries but is riskier than peers. For example, it has a more flexible notion of below-investment-grade debt; when more-conservative definitions are used, the strategy's high-yield limit has reached the high single digits. The lead manager also can make explicit duration bets within a 20% band relative to his bogy.
In the pandemic-driven sell-off in early 2020, it not only failed to provide enough downside protection when credit markets collapsed, it didn’t reposition itself well enough to benefit from the swift rebound.
The strategy held up as expected in the 2021 IR Shock period given its tactically short duration.
/cloudfront-us-east-1.images.arcpublishing.com/morningstar/EC7LK4HAG4BRKAYRRDWZ2NF3TY.jpg)
/cloudfront-us-east-1.images.arcpublishing.com/morningstar/6ZMXY4RCRNEADPDWYQVTTWALWM.jpg)
/cloudfront-us-east-1.images.arcpublishing.com/morningstar/URSWZ2VN4JCXXALUUYEFYMOBIE.png)
:quality(80)/s3.amazonaws.com/arc-authors/morningstar/c6bd816b-3f1a-49af-ae14-2efdb6122500.jpg)