
Trump Optimism Abounds, but Caution Warranted
Sentiment indicators are soaring, but current conditions aren't improving yet, and many potential Trump-administration proposals may not have the hoped-for impact.

World markets were tame this week, with relatively small changes. U.S. equity markets were comparatively unchanged for a second week in a row, taking a pause from the furious fourth-quarter rally based on the potential of Trump administration initiatives. (His lack of substantive program details at this week's press conference certainly didn't help matters.)
Economic news was mixed, with some bias to the downside as retail sales disappointed on Friday. The first of the earnings reports, mainly from the financial sector, were mixed, with some disappointments and some successes in the fourth quarter, but with prospects for 2017 looking up.
European markets did better with unexpectedly strong industrial output gains across the continent. Even France and the United Kingdom managed strong performances. This follows last week's news of higher inflation (viewed as a positive) and better purchasing manager data, which has been sharply improving for some time. Clearly, a lower euro is doing its work. Emerging markets also did well this week, gaining almost 2%.
With slowing U.S. data, rates on the U.S. 10-year bond continued to decline. Rates have now fallen back to 2.38% from 2.44% last week and a December high of almost 2.6%. Given the interest-rate-dependent housing sector, this was probably the best news of the week.
More Sentiment Indicators Make Their Move; Base Economy, Not Just Yet As long-term readers know, we are not huge fans of sentiment indicators, especially consumer-oriented ones. Additionally, we are dismayed that a lot of business-oriented sentiment indicators--many that supposedly had means based on hard data and not opinions--have begun to perform more like the despised consumer surveys.
Now many of these reports seem to be more a reflection of recent headlines, hopes, and fears than hard data. Plus, even when they are right, the results are often more concurrent than leading. Purchasing manager surveys, builder sentiment, and various consumer sentiment surveys have been included among the many indicators. Even the normally dour small-business sentiment report showed an unprecedented move to the upside in a report released this week.
We would be at least a little cautious with all these reports, as many seem to be based on hoped-for Trump administration changes than improving current conditions. If the hoped-for Trump programs don't come quickly, we think that many will be disappointed with the slowing level of economic activity. We believe that rapidly diminishing or nonexistent growth in the working-age population, higher inflation resulting in substantially lower real-wage growth, and higher interest rates hitting key sectors including housing, are driving the slowing.
Clearly, everyone is more optimistic than I am about which policy changes will be implemented quickly. We acknowledge that even a few small changes could help the economy quickly, including the taxation of repatriated corporate cash, a streamlined corporate tax program, and a modest cut. If Congress and the president get together quickly on these policies, my caution will prove to have been unwarranted and I will be badly wrong.
However, it will be incredibly difficult to enact just the helpful parts of what many are suggesting. At the very least, many things will have to be watered down and many harmful provisions will likely be needed if we are to hope for quick passage of any measure. Meanwhile, higher interest rates and higher inflation will continue to inflict more harm on the economy. An overly generous and broad-based tax cut and silly infrastructure projects in markets that are already suffering from a severe shortage of workers will do far more harm than good. These measures would likely raise inflation and interest rates, the death knell of any recovery. This time is different. It is not like when other presidents entered office with the economy on its back and stimulus being the ideal solution to the problem (Reagan, Obama, and to a lesser degree, Bush II).
Retail Sales Fail to Accelerate in December, Disappointing Investors Retail sales excluding vehicle sales and gasoline had another rough month, moving from a pattern of slowing growth to outright decline, as shown below. Given higher inflation and more limited employment growth, this comes as no surprise to us.
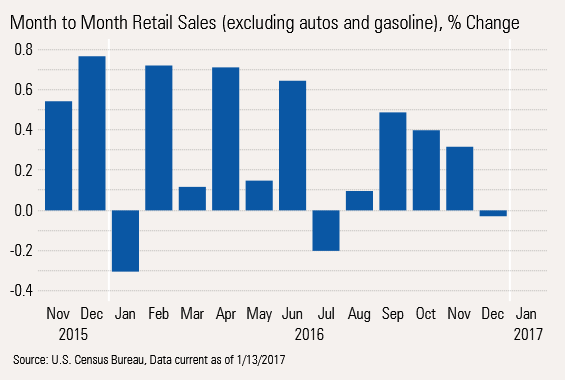
Year-Over-Year Data Lethargic, but Not as Worrisome as Month-to-Month Data
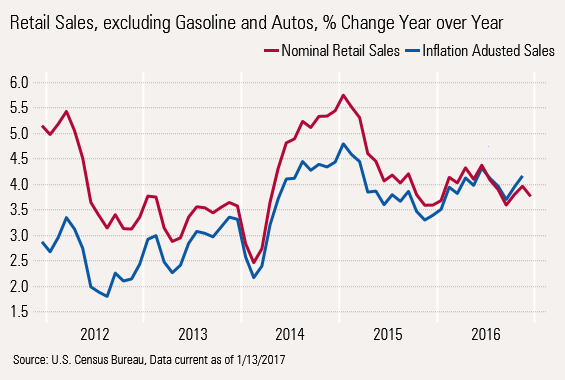
Year-over-year, averaged growth has been stuck in a narrow range of 3.5%-4.0% in terms of inflation-adjusted data since 2014. The range would be even narrower and last longer if the data could be adjusted for the negative weather effects in winter 2013-14 and the artificial bounce in 2014-15 from weather-depressed levels. Though we won't know for sure until next week when the CPI data for December is released, we suspect that inflation-adjusted sales will drop a couple of tenths of a percent in December to about 4%, similar to the drop in nominal sales and in line with sales growth of the past year.
Which Data--Month-to-Month or Year-Over-Year--Presents the Truest Picture? We've got monthly data suggesting collapsing retail sales and year-over-year data showing only the tiniest bit of slowing. And then there are the consumer confidence numbers that are off-the-charts wonderful. So which data has it right?
First, we have never been fans of sentiment data. Why ask consumers what they might do when what they actually did a week earlier is so easily accessible? So we will put that one aside, though it doesn't suggest an imminent disaster.
The month-to-month data is nearly impossible to inflation-adjust or properly seasonally adjust, so we have never put a lot of stock in it. And for some reason we have found that when auto sales are particularly strong, it isn't usually good news for other retailers. We have always suspected that less available short-term cash (the down payment) and the time necessary to shop for a car explain this phenomenon. This is especially true of restaurants receipts, which did indeed have a dismal December, dropping 0.8% month to month.
In addition, there is the issue of mix shift from department stores to online retailers (nonstore retailers). Seasonal factors move slowly over time, but short-term sales changes are much more dramatic. That means the seasonal factors used in the month-to-month data may not be very representative. The year-over-year data is much less subject to this issue. Note the contrast between department stores and nonstore retailers was particularly wide in December with
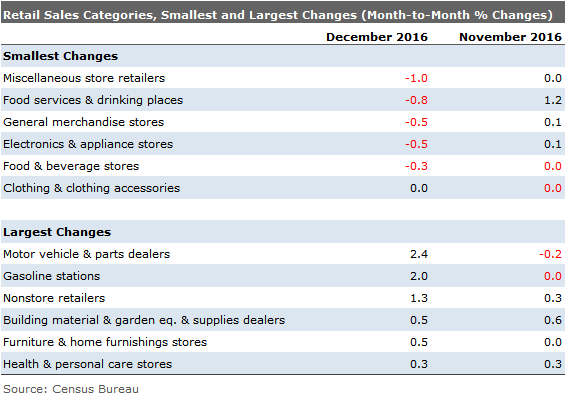
Our Conclusion: Consumer Spending Is Doing Fine but No Trump Bounce With all the optimism in recent sentiment-based reports, one might be shocked to find that consumer spending is going nowhere fast. A combination of higher prices and lower employment growth is beginning to kick in and has kept consumers from loading up their shopping carts despite the feeling of change that is clearly in the air. And that breadth of consumer optimism may be what is keeping year-over-year retail sales from being even worse. Keep in mind, too, that we report on auto sales separately and those have showed some improvement in December. Also remember that this data is not inflation adjusted, which might shift some of our conclusions when that data is released next week. Small-Business Optimism Soars, Hiring Stays Muted Small businesses seem even more excited than consumers about the election of Trump, based on a recent survey. We haven't been huge fans of the NFIB on Small Business Sentiment report for some time. The sample base is small and of varying size, the businesses surveyed are very small, and too many questions are pure sentiment and seem to sway with the headlines.
We have found some value in a few of the individual sector questions but have generally ignored the headline composite. For the month of December we really couldn't do that. The index sprinted upward by 8 points to 105.8 from 98.4 in November and 94.1 in September. That is one of the largest upward jumps we have ever seen. The move when Ronald Reagan was elected was similar in size but that took years, not months, to happen. And the sharp Reagan move was spirited along by a strong economic recovery after a double-dip recession.
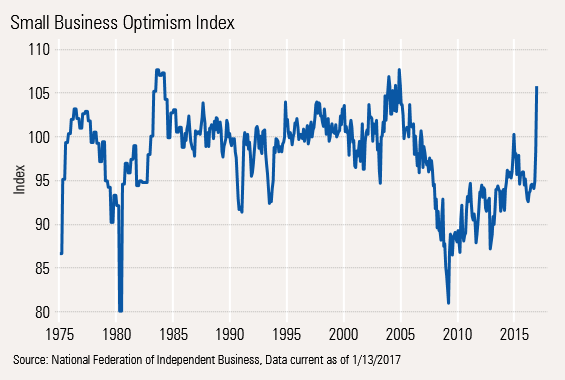
Small-business people have been a glum bunch most of this recovery, with overall readings vacillating in the mid-90s, well below the 100 level that is supposed to mark normal optimism. Small businesses have complained about two things for most of the past 10 years: taxes and regulation. In the most recent survey, 21% worried most about taxes and 19% about regulation, approaching 2 times the percentages for each of the next two categories (poor sales and labor quality at 12% each). Not surprisingly, when worries over taxes were at their lowest level around 2005, we saw the highest level of small-business optimism. The mid-2000s was also the period when small- business hiring was at its best relative levels compared with large corporations (25% of all new jobs added around 2005, just 20% today).
So, we believe the large jump in sentiment is due to prospects for lower taxes and less regulation under the new Trump administration, just as those prospects have pushed up the stock market and consumer sentiment as well. However, we are bit surprised about the huge surge so quickly before the nature of the Trump programs is even clear. As we said earlier, it took years for small-business people to react to the last president that ran on a platform of lower taxes and less regulation (Reagan).
Unfortunately, some of the more mundane but important elements of the report were not nearly as bullish as the headline number. Therefore, we would be a little cautious when interpreting the strong one-month bounce in the headline indicator. We have always felt a little better about some of the employment indicators in this report than the headline figure. One of our favorites has always been the percentage of firms looking for workers that had few or no qualified applicants, as shown below. We have not averaged the data as we usually do, just to make our point a little clearer.
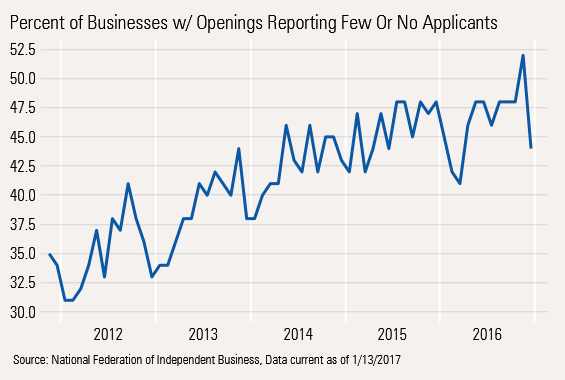
This report showed an increasingly tight labor market up until 2015. Then, the indicator topped out at around 48 and hasn't done a lot since. In the December report there was a rather large drop in this indicator. This is certainly not panic-worthy, but the economy is not seeing a new boom, either. Also on the dark side, credit availability and higher interest rates remained a concern for small business.
On a more positive note, past hiring and especially planned hiring did show some modest improvement, but nothing like what the headline number would suggest. Capital spending plans looked a bit better, too. That's important because we believe that business investment spending will be the key swing factor for the economy in 2017. Business spending has been below par for some time and has been one factor holding back GDP growth even as consumer spending remained strong. Let's hope these small-business people put their money where their mouths are.
Job Openings Report Shows More of the Same For the past couple of months, private sector employment has disappointed Wall Street, and most economists with monthly job growth recently hovering around 160,000 jobs per month. That's down from the full-year average of 190,000, the 2015 average of 228,000, and an even higher 241,000 in 2014.
For the past two years we have contended the problem is more likely a shortage of workers and not a shortage of jobs. Strong growth in open positions, more employees changing jobs voluntarily, and anemic hiring growth have been the backbone of our argument. This month's Job Opening and Labor Turnover report shows more of the same, especially the long-term picture. Quits, hires, and openings all tend to move together with some time lags. Openings generally lead hires and hires lead quits. All three measures are also subject to the normal ups and downs of the economy. In a strong economy, openings accelerate faster than hires, closing the gap between hires and openings as we show between 2005 and 2007, after basically moving together from 2003 to 2005. The same concurrent bounce happened again at the start of this recovery in 2010 to about 2013. Then openings soared as apparently there were not enough people in the right locations with the right skills to fill job openings. It's unprecedented for openings to run so far above hiring (or even being above at all).
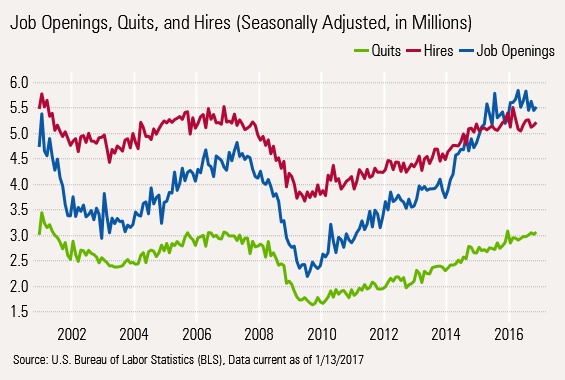
While that is good news for workers--raising the potential for wage increases--it is not entirely good news. It's like running out of capacity on a factory floor: it's great that business is spectacular. However, the fact that the factory cannot meet demand denotes that full growth potential--for the company and for the economy--is not being realized. In fact, any growth at all is impossible to achieve if there isn't enough plant capacity or enough workers. We believe that the lack of workers is the biggest reason employment growth has slowed rather dramatically the past several years.
Although, as we discussed last week, slower GDP growth cannot be ruled out as a culprit, either. And the chicken-or-egg-first question will continue to perplex economists. Is slow employment growth limiting GDP growth, or is slow GDP growth limiting employment changes?
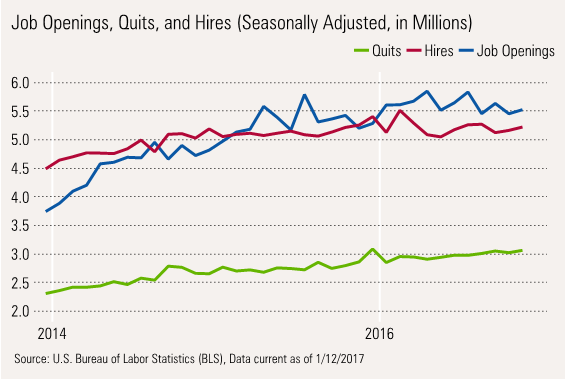
Skills Mismatch Limiting Growth and Profits A shorter-term look at the JOLTs data suggests that while the skills mismatch continues, it hasn't gotten dramatically worse over the past year. Openings are just about where they were a year ago at about 5.5 million. (As noted in our analysis of the small- business report, hard-to-fill positions are also in a topping pattern, though small businesses did find it somewhat easier to find workers in December.) They have been modestly higher during summer 2016, but not by much. To turn an age-old question on its head, do we have a large batch of discouraged employers? Are firms setting their sights on lower growth, rather than struggle to find more employees? Is this why openings are topping out?
Unemployed Workers per Job Opening Continues to Fall Certainly, employers trying to fill open positions are facing a real challenge.
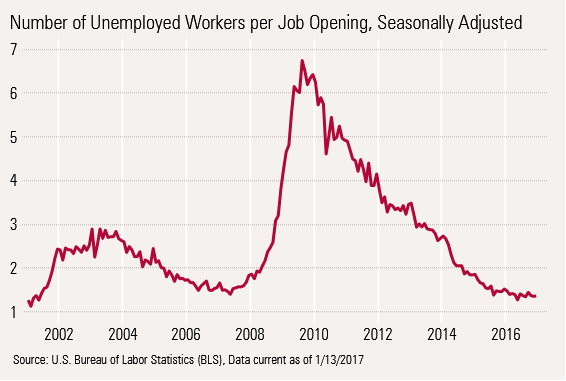
Comparing the number of unemployed people with the job openings that have been posted is a quick indicator of the tightness of the labor market and the amount of difficulty a company may have filling a position. The November data suggests that the market is now tighter than any time since 2002 and is on the verge of setting a new record low, with a reading of 1.36.
There is some variance by industry in terms of level, but most industries are also near industry-specific lows. At the moment, four major sectors (out of 12) show more openings than the number of people unemployed in that industry. Those are the very largest sectors: professional and business services, education and healthcare, government, and finance. Even the highly troubled retail sector is only showing 1.22 openings per unemployed person, its best December reading of the recovery. Only two sectors, manufacturing and construction, have readings above two, and even those readings are better than any December reading of this recovery.
Very Tight Labor Markets Suggest That Stimulus May Do More Harm Than Good Even though we have been talking about the labor market tightening for some time, we are shocked at how much things have tightened up over the past few months. We have mentioned that some homebuilders have forgone growth because they can't find enough workers. This is the most visible example, but we believe there are many other sectors in a similar boat. More stimulus on an overheated situation won't help. That doesn't mean that there aren't a lot of the unemployed that are in a world of hurt. Unfortunately, stimulus and infrastructure building won't likely help unemployed coal miners, retailers that are losing ground to Amazon or Cobol/mainframe computer programmers. Generalized government spending plans won't bring these professions back from the dead. Instead, they have the potential to raise inflation and misallocate assets to the government sector.
Budget Deficit Worsens Some, Suggesting Issues and Opportunities for Trump Fiscal year 2017 is proving more fiscally challenging than we had anticipated. The budget deficit expanded substantially in 2017, from $170 billion to $228 billion, a whopping 34% increase, for the first three months of the fiscal year. An approximately $19 billion shortfall of the $48 billion was related to a one-time payment the Federal Reserve made a year ago that did not recur this year. That still means that the deficit increased by $30 billion on a year-over-year basis. Most of the problem is on the revenue side of the equation as expense growth remains limited. In fact, expense growth has dipped from 3.9% to 3.5% despite a big jump in interest expenses.
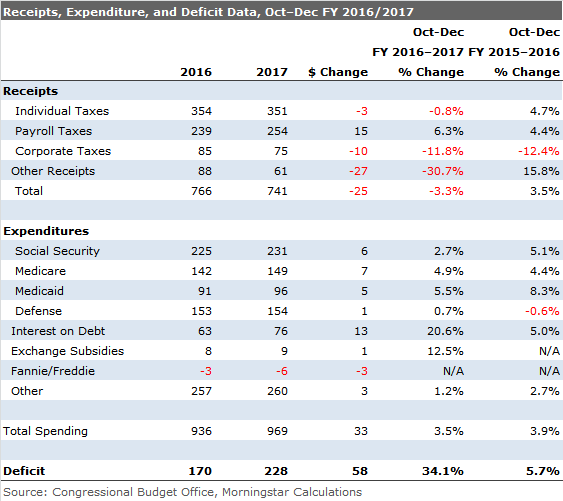
The problem is definitely related to revenue. Revenue was down by over 3% this year instead of being up by the same amount as it was last year. Even excluding the Fed's special payment, which is included in the "other" category, revenue would still have been down 1%. Corporate taxes were the big problem, followed by lower individual tax collections that were driven down by fewer capital gains and lower small-business income, which often flows through individual tax collections. Withheld income tax and payroll taxes improved modestly over a year ago. If current trends continue, the full-year deficit will likely widen from $540 billion to $650 million, about $50 billion more than our previous thinking.
Fiscal Stimulus May Not Be So Easy This Time Around Given already rising costs of social programs, on its current trajectory the deficit will get far worse in the years ahead. This suggests more limited-than-expected room for fiscal expansion and infrastructure building. After bottoming at $439 billion, we believe the deficit is moving toward $650 billion in fiscal year 2017 and toward the $1.4 trillion experienced after the last recession and stimulus program.
In our opinion, the market will have increasing difficulties absorbing all of the new debt, because none of the massive debt used to finance the last batch of stimulus programs has been repaid. At the start of the recession in 2007, the total federal government debt was about $9 trillion. Today that debt is $19 trillion and has never shrunk, not even for one year since 2007, despite seven and one half years of recovery. Over that same time, GDP has increased much more slowly, moving from just $14.5 trillion to $18.5 trillion. In other words, debt is up by $10 trillion and GDP, in nominal terms, is up just $4 trillion. Debt has gone from being a healthy margin below GDP and to roughly equal. The import of this is that fiscal expansion on a grand scale is not really possible. On the margin, there might be a little room, but certainly not like there was in 2009 when the real stimulus programs began.
There May Be Some Hope on the Corporate Tax Side As I mentioned earlier, a lack of tax collection is at the crux of this year's deficit situation--and business taxes are at the heart of the problem. With business revenue likely to fall from $330 billion a couple of years ago to our estimate of $270 billion for 2017 (out of receipts that are currently $3.2 trillion), this sector is ripe for a restructuring. With revenue already falling, despite (or perhaps because of) one of world's highest corporate tax rates, some new creative thinking on this front would not hurt. Certainly measures to reduce taxes on repatriated cash from abroad could provide a quick dose of cash for the Treasury and offer the possibility of more cash in the U.S. for expansion. Some tax, even at reduced tax rates, could bring in substantial revenue on cash hoards that have been building for years. Furthermore, a more ready source of domestic cash could help stimulate U.S. corporate spending.
/d10o6nnig0wrdw.cloudfront.net/04-29-2024/t_eae1cd6b656f43d5bf31399c8d7310a7_name_file_960x540_1600_v4_.jpg)
/cloudfront-us-east-1.images.arcpublishing.com/morningstar/PKH6NPHLCRBR5DT2RWCY2VOCEQ.png)
/cloudfront-us-east-1.images.arcpublishing.com/morningstar/GJMQNPFPOFHUHHT3UABTAMBTZM.png)