
Markets Brief: Don’t Declare Victory on Inflation Yet
Analysts warn of a bumpy road ahead, but inflation is still expected to continue moving lower.


Inflation has fallen dramatically from the 40-year highs it notched two years ago, but recent data has investors wondering whether progress is stalling. A series of hot January prints is “a warning sign that this is not going to be as simple as we thought,” says Roger Aliaga-Díaz, global head of portfolio construction and chief economist, Americas at Vanguard.
In other words, the easy gains are likely behind us as the so-called “last mile” in the inflation fight proves more difficult than expected, at least for now. That has major implications for the Federal Reserve and the path of monetary policy. Stubborn price pressures could delay highly anticipated rate cuts even further.
Late last year, bond market investors were pricing in six interest rate cuts for 2024, with the first of those slated as early as March. Now expectations have shifted to three or four cuts, with the first coming at the central bank’s June meeting.
In the long run, however, economists say investors shouldn’t lose hope that all progress is in the rearview mirror. A major rebound in inflation isn’t the base case for most analysts, and there are still signs of further disinflation on the horizon—not to mention how short-term distortions may be coloring the data. Some economists also say that housing inflation, which has been a major driver of headline inflation, isn’t accurately reflected in the government’s data.
The Fed’s Preferred Inflation Gauge Rose In January
On Thursday, the Bureau of Labor Statistics reported a 2.4% annual increase and a 0.4% month-over-month increase in the Personal Consumption Expenditure Index in January. The core measure of PCE, which excludes volatile food and energy prices, rose 2.8% on a yearly basis and 0.4% on a monthly basis.
Personal Consumption Expenditures Price Index
The PCE is the Federal Reserve’s preferred gauge of inflation, and it has been closely watched alongside the Consumer Price Index report for clues about the health of the economy and the likely path of monetary policy. While the headline data showed the biggest monthly jump in a year, it was also in line with economists’ expectations and did not spook markets. However, it did follow an unexpectedly hot January CPI report. That’s giving analysts reasons to believe that the path to the Fed’s 2% CPE target won’t be a straight line.
“One of the key takeaways from the latest data is that the disinflation process is bumpy, and it’s going to remain bumpy,” says Lydia Boussour, senior economist at EY.
January Inflation Data Was Especially Noisy
Some of that bumpiness may be temporary. Inflation data is complicated, after all. “There’s a lot of noise in the data, typically in January,” Boussour explains, pointing to the seasonal adjustments and revisions that regularly happen in the first month of the year.
Blerina Uruçi, chief US economist at T. Rowe Price, says January’s data included unusually high financial services prices, which don’t generally worry the Fed. There was also an unusually large gap between housing prices for renters and housing costs for homeowners, which could be attributable to a change in BLS methodology.
“This seems like a bump in the road,” Uruçi says, adding that “some factors driving prices higher may not be sustained in the coming months.” On the other hand, she says January’s data “does signal that the very steady deceleration in inflation that we saw in the second half of the year seems to have lost some steam.”
Goods Deflation vs. Services Inflation
It’s also possible that January’s uptick in prices was a window into more systemic factors affecting the economy.
“So far, a lot of inflation gains have come from the goods side,” Aliaga-Díaz explains. “This really isn’t the part of inflation that’s within the Fed’s control. We’ve been lucky so far that goods inflation was transitory” and has eased as supply chains normalized.
Services inflation, which includes housing prices, is proving much more difficult to crack. It’s tied to the labor market and a wage and price cycle “that’s much more difficult to break,” Aliaga-Díaz says. He explains that services inflation is also driven by housing costs, which “may last for longer than we thought.”
Those costs also show up in inflation data on a long lag, which means they may continue to affect readings from the BLS even after dynamics in the housing market have shifted. While forward-looking data supports the consensus among analysts that shelter inflation is headed lower in the coming months, the risk remains of another uptick in housing costs.
“What the numbers would tell you is that there’s more disinflation coming from shelter costs, but at the same time, sometime in the next six to nine months, it could reaccelerate,” says Tim Murray, capital market strategist in the multi-asset division at T. Rowe Price.
PCE Components
Inflation Could Continue Falling
Boussour is optimistic that inflation will continue falling in the coming months, despite those pressures. “Some are concerned that the progress will be slower” on the services side of the economy, she says, “but that’s not necessarily our view.”
Slowing consumer demand and more cautious consumers in general could mean fewer price increases from companies this year, she says. Moderating wage growth will contribute to that dynamic. At the same time, according to Boussour, productivity gains mean companies will be under less pressure to raise prices to protect their margins.
And on top of that, Boussour points out that the last year of inflation gains may not have been as smooth as it looks in hindsight. “When people say we’ve gotten this amazing progress in inflation, it was also bumpy,” she says, pointing to the months in 2023 when high energy prices pushed up the headline inflation rate.
What Does Hot Inflation Data Mean for Rate Cuts and Investors?
So where does this leave the Fed? According to Uruçi, after January’s data, the central bank “can afford to wait and see before they start cutting rates.”
In the bond market, traders are now pricing in three or four cuts in 2024, according to the CME FedWatch tool, with a 53% chance of the first cut coming in June. At the beginning of the year, they anticipated that the Fed would begin easing policy as early as March. Despite the delay and bumps along the way, most strategists still expect rate cuts at some point this year as inflation improves.
“While [January’s] large monthly gain suggests rate cuts aren’t imminent, the continued move back toward the Fed’s 2% target is consistent with rate cuts appearing on the horizon,” economists from Wells Fargo wrote this week.
“We do expect inflation to continue coming down gradually,” adds Aliaga-Díaz. “But I think the Fed will come to remain alert and be very cautious.” He says that despite the recent noise, long-term investors shouldn’t be overly concerned. “Financial markets are pricing in that eventually the Fed will bring things … to the inflation target.”
For the Trading Week Ended March 1
- The Morningstar US Market Index rose 1.08%.
- The best-performing sectors were technology, up 2.73%, and consumer cyclical, up 2.08%.
- The worst-performing sector was healthcare, down 0.93%.
- Yields on 10-year US Treasury notes fell to 4.18% from 4.26%.
- West Texas Intermediate crude prices rose 6.76% to $79.77 per barrel.
- Of the 704 US-listed companies covered by Morningstar, 432, or 61%, were up, two were unchanged, and 270, or 39%, were down.
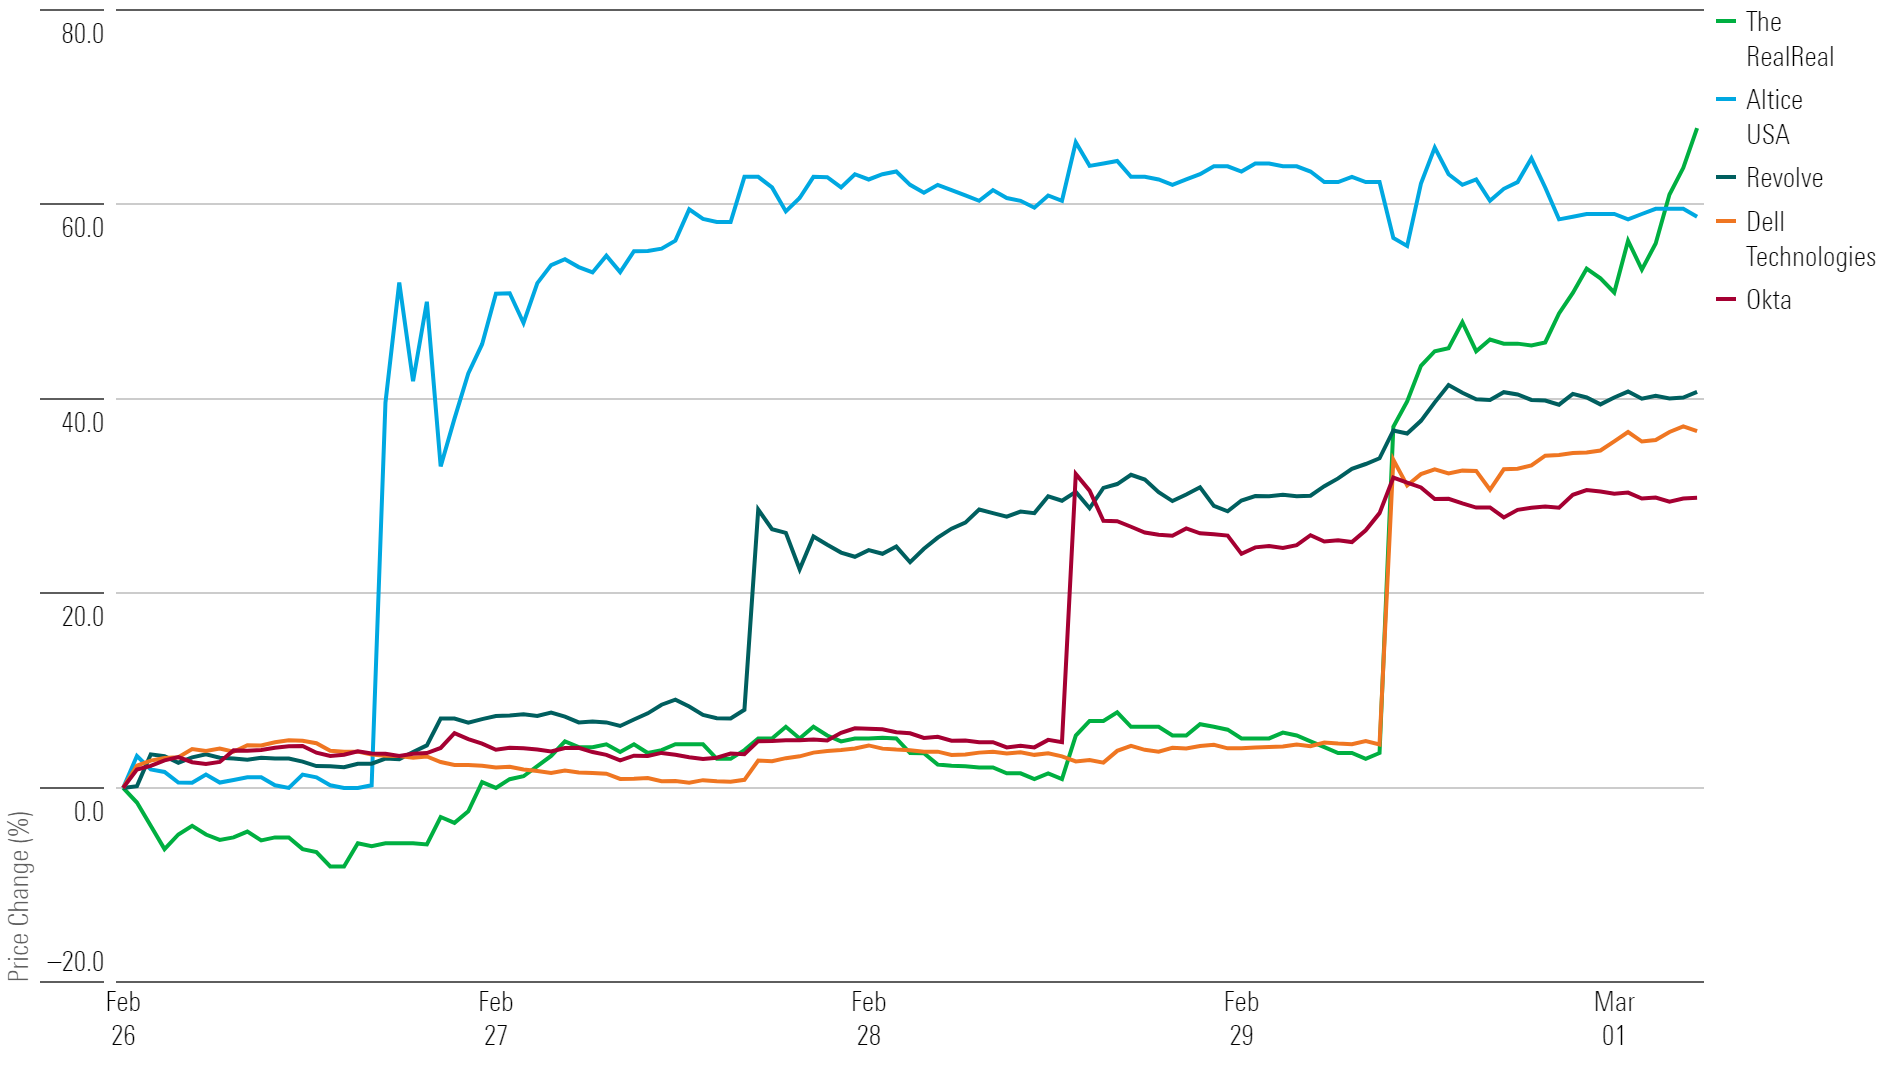
What Stocks Are Up?
RealReal REAL, Altice USA ATUS, Revolve Group RVLV, Dell Technologies DELL, and Okta OKTA.
Best-Performing Stocks of the Week
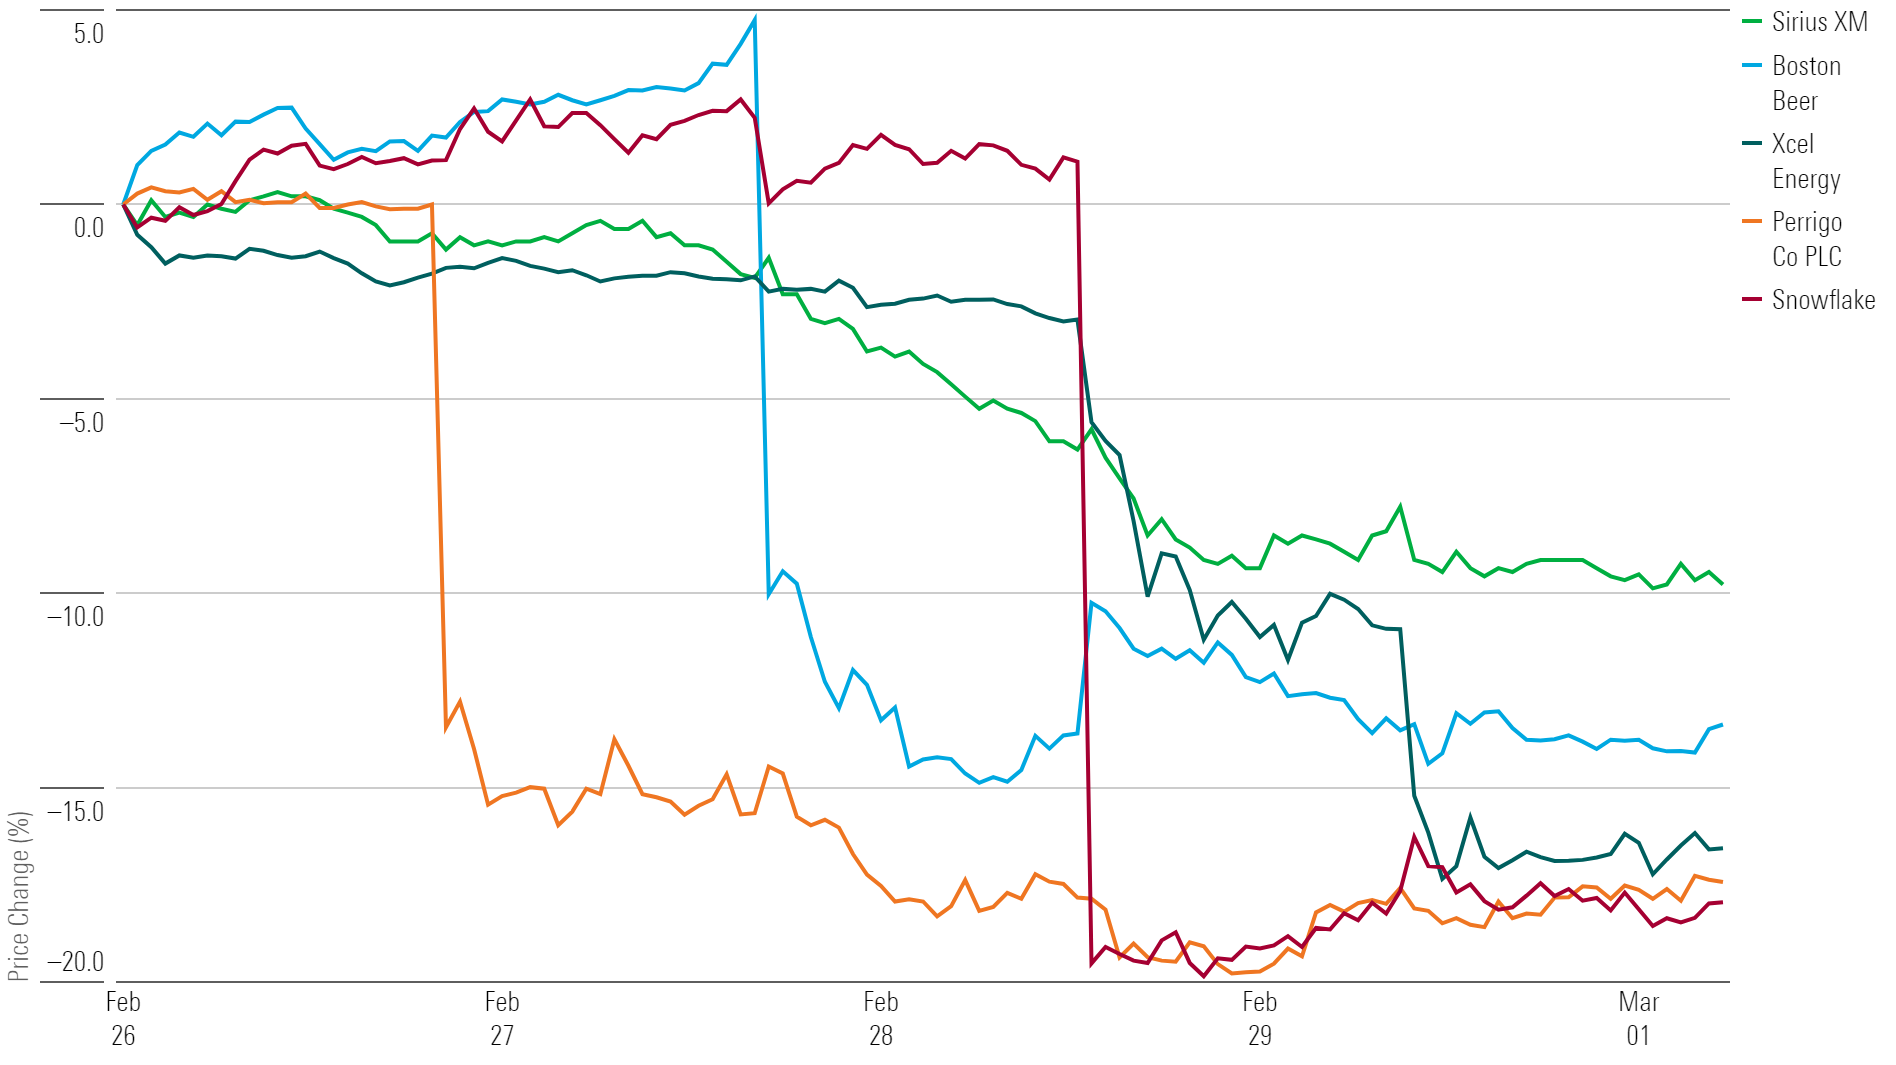
What Stocks Are Down?
Snowflake SNOW, Perrigo PRGO, Xcel Energy XEL, Boston Beer SAM, and Sirius XM SIRI.
Worst-Performing Stocks of the Week
The author or authors do not own shares in any securities mentioned in this article. Find out about Morningstar’s editorial policies.
/cloudfront-us-east-1.images.arcpublishing.com/morningstar/AGAGH4NDF5FCRKXQANXPYS6TBQ.png)
/cloudfront-us-east-1.images.arcpublishing.com/morningstar/ZYJVMA34ANHZZDT5KOPPUVFLPE.png)
/cloudfront-us-east-1.images.arcpublishing.com/morningstar/QFQHXAHS7NCLFPIIBXZZZWXMXA.jpg)