
13 Charts on Q1’s Dramatic Rotation in Stocks
As Trump’s trade war led stocks to post their worst first quarter since 2022, diversification proved its worth.

Key Takeaways
- Tariffs upended the rosy outlook for stocks, sending the market down more than 4% in the first quarter—its worst start to a year since 2022.
- Technology stocks posted their worst first quarter since 2020, while value stocks and defensive sectors like healthcare rose.
- Non-US stock markets far outperformed US stocks, led by rallies in Chinese and European stocks.
- Bonds were a safe haven, as prices rose despite the Federal Reserve holding off on cutting interest rates.
After two years of relatively smooth sailing and blockbuster returns for stocks, the first quarter of 2025 was a rude awakening. President Donald Trump’s trade wars changed the market conversation from a focus on a “soft landing” for the economy and Federal Reserve interest-rate cuts to worries about tariffs reviving upward pressure on inflation, collapsing consumer confidence, and rising odds of a recession.
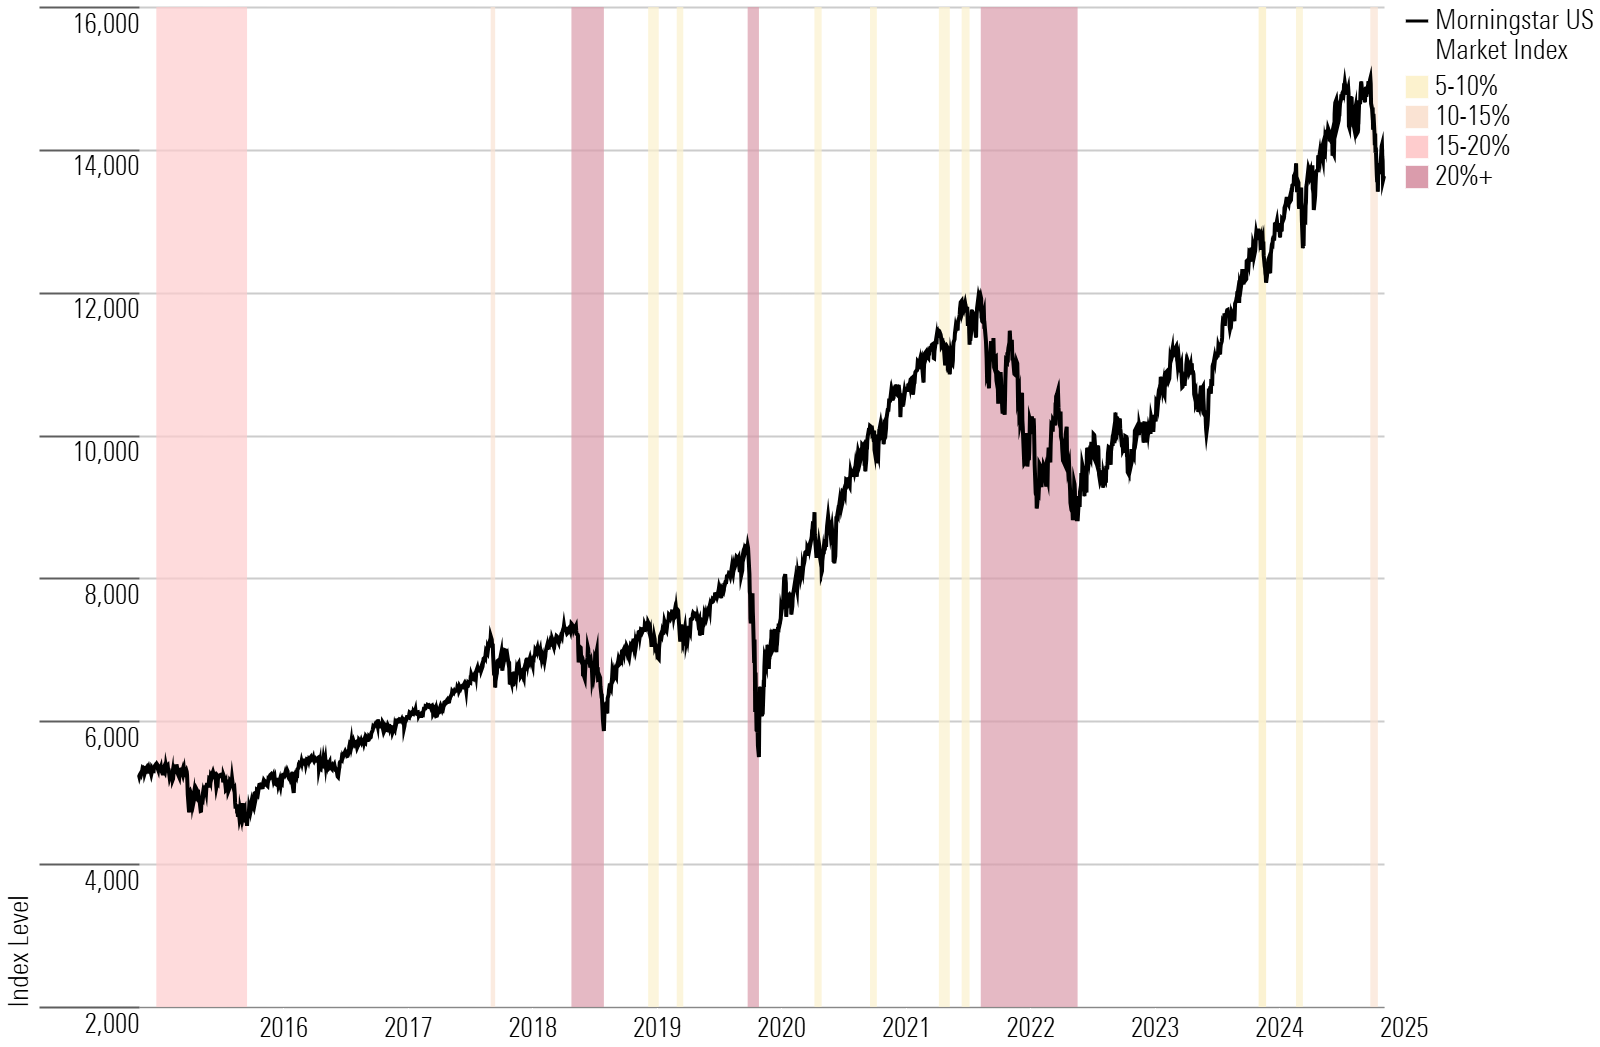
The result was a sharp turn lower in the US stock market from record highs in mid-February to a correction, with a 10% drop from the market’s peak. Leading the declines were the hottest stocks of 2024, especially the names at the center of the artificial intelligence boom.
Looking through the volatility, however, stocks haven’t fallen as far as some gloomy headlines might suggest. The Morningstar US Market Index dropped more than 4% in the first quarter, but it’s up more than 7% over the past year.
Not only that, but there were havens for investors with diversified portfolios. Value stocks, which had been left in the dust the by the big rally in tech, rose during the first three months of the year, with gains among dividend stocks, consumer defensives, and healthcare names. Non-US stock markets rallied. Treasury bonds also posted gains, living up to their traditional role as ballast for portfolios.
Strategists say investors should brace for more volatility in the months ahead, especially with more tariff announcements to come from the Trump administration. However, many are still constructive on the outlook for markets over the longer term.
Key Stats: Q1 2025 Stock and Bond Market Performance
- Stocks finished the quarter down 4.63% after entering correction territory in mid-March. It was the market’s worst quarter since the second quarter of 2022, when stocks fell 16.85%.
- Value stocks took the lead over growth stocks, with the Morningstar US Value Index returning 4.44% compared with a 9.24% loss for the Morningstar US Growth Index.
- The Morningstar US Core Bond Index gained 2.78% after losing 3.04% in the fourth quarter. Yields fell slightly but remain attractive by historical standards, according to analysts.
- Dividend stocks rose in the first quarter as the broader market fell. The Morningstar Dividend Composite Index gained 2.23%, compared with the market’s 4.63% loss.
- The Fed held interest rates steady in January and March but telegraphed that two 0.25-percentage-point rate cuts would happen later in the year.
- Gold and copper prices surged on tariff fears, while oil prices fell.
- Bitcoin and other cryptocurrency prices plunged alongside tech and AI stocks.
Q1 Stock Market Performance
The technology stocks that propelled the market higher for the better part of two years dragged it lower in the first quarter. Chip giant Nvidia NVDA saw losses of more than 19%, while Alphabet GOOGL/GOOG lost 18% and Tesla TSLA plunged more than 35%. One side effect of those losses was a significant drop in valuations across the mega-cap tech sector and the stock market more broadly.
Stocks entered official “correction” territory in mid-March, falling more than 10% from their most recent peak in February, though the market finished the quarter off its lows.
The Morningstar Wide Moat Composite Index, which is made up of stocks our analysts believe have the largest and most durable competitive advantages, fell 6.58% for the quarter. That’s a 180-degree turn from its 3.69% return in the fourth quarter and 8.61% return over the past year.
The first quarter also brought a rotation, as investors sought safety (and bargains) outside of last year’s winners. Energy and healthcare stocks, which lagged in the fourth quarter, surged ahead. International markets like China and Europe also soared after lagging the US in recent years.
Stock Market Pullbacks
Value vs. Growth Performance
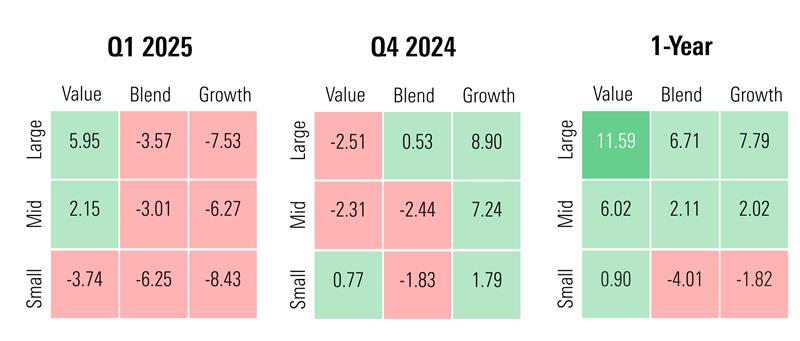
As Big Tech stumbled, value stocks took the lead over growth stocks. The US Value Index gained 4.44% for the quarter, while the US Growth Index fell 9.24%. Within the style box, large-cap value gained 5.95%, the best return of any category. Large-cap growth stocks lagged, falling 7.53%. Small caps struggled across the capitalization spectrum, with small-cap growth notching the worst return of any category.
US Equity Style Box Performance
Stock Sector Performance
Of the 11 major stock sectors, the worst losses came from consumer cyclicals. After climbing 10.47% in the fourth quarter of 2024, the category plunged 12.83% in the first quarter, as worries about declining consumer confidence, higher interest rates, tariffs, and a broader economic slowdown dragged on stocks.
The tech sector didn’t fare much better, ending the quarter down 12.06% after dominating the market for the better part of the last two years. It was the Morningstar US Technology Index’s worst quarter since the second quarter of 2022, when it lost 22.33%.
The best performance came from energy stocks, which gained 9.03% in the first quarter, even as oil prices fell. Healthcare stocks also fared relatively well, rising 5.45%.
Q1 Dividend Stock Performance
Dividend stocks outperformed the broader market in the quarter as investors searched for steady, reliable cash flow in an uncertain environment for equities. The Morningstar Dividend Composite Index was up 2.2%, compared with the market’s 4.6% loss.
The Morningstar Dividend Leaders Index, made up of the 100 stocks from the Composite Index with the highest yields, gained 9.0%. The Morningstar US Dividend Growth Index rose 1.4%.
Federal Reserve Still on Hold
After cutting rates by a full percentage point in the fall of 2024, the Fed kept interest rates steady at its first two policy setting meetings of 2025. The target range for the federal-funds rate is 4.25%-4.50%, lower than the peak of 5.50% last summer but still high enough to be considered restrictive.
Complicating the picture for central bankers is ongoing uncertainty surrounding fiscal, trade, and other policy in Washington. With the effect that new tariffs and tighter immigration restrictions will have on the economy still unknown and inflation still above the Fed’s target, central bankers are kicking the can down the road. Analysts agree that widespread tariffs will likely result in higher inflation, but it’s not yet clear whether this will be short-lived and allow the Fed to resume cutting interest rates.
Treasury Yield and Federal-Funds Rate
Global Market Performance
As the US stock market lost ground in the quarter, international markets surged amid a global shift. Chinese markets gained 14.17%, while eurozone markets rose 12.24%, thanks in part to major fiscal initiatives designed to stimulate growth and enhance the region’s defense capabilities amid the ongoing conflict between Russia and Ukraine.
In March, German spending plans that broke the country’s long-standing tight fiscal discipline boosted stocks and bond yields. German markets rose more than 15% for the quarter, UK markets rose 8.44% and Japanese and Canadian markets also ended the first quarter in the green after tumbling at the end of last year.
Q1 Bond Market Performance
The bond market remained mostly in the green in the first quarter as equities sold off and investors sought safety in fixed income. That was a sharp contrast with the fourth quarter, when stocks soared as bonds struggled. Yields on the 10-year Treasury note dropped to 4.23% at the end of the quarter after peaking at 4.79% in early January. Bond yields move in the opposite direction of prices.
The US Core Bond Index returned 2.78% for the quarter. Investors in TIPS fared better; that category returned 4.25% amid investor expectations for stickier inflation and slower economic growth. Only municipal bond investors saw negative returns.
Yield Curve Continues to Steepen
After un-inverting last year, the Treasury yield curve steepened slightly. The curve is a graphical representation of government bond yields across different maturities, most commonly two-year and 10-year Treasury notes. It’s a measure of how much compensation bond investors expect for the extra risk of having money locked up with the federal government for longer periods.
At the end of the first quarter, the spread between the 10-year and two-year Treasury yields was 0.34 percentage points, up slightly from 0.31 points at the end of the fourth quarter.
U.S. Treasury Yield Curves
Stock and Bond Market Volatility
Stock market volatility rose across the US, developed, and emerging markets in the quarter as investors grappled with an evolving outlook. In the United States especially, stocks have whipsawed daily on developments surrounding tariffs and economic data releases. Meanwhile, bond market volatility was flat compared with the previous quarter as yields remained range-bound.
Commodity Market Performance
With tariffs looming and trade uncertainty persisting, gold prices have lifted. Investors often treat gold as a hedge against economic downturns, geopolitical unease, or stubborn inflation—scenarios that have been top of mind for investors these past few months. Gold futures prices rose 17.45% to record highs over the first quarter.
Copper prices have seen an even more dramatic run amid fears that Trump will impose tariffs on the key industrial material. Copper futures prices rose 25.86% in the quarter.
West Texas Intermediate crude prices—a benchmark for American oil prices—fell slightly as tariff developments dampened global demand and the major oil-producing countries agreed to increase production this year.
Commodity Futures Performance
Cryptocurrency Performance
Bitcoin tumbled in the quarter alongside tech stocks, falling 12.57%, compared with a gain of more than 52% in the last quarter of 2024. Cryptocurrencies and their related financial assets saw a boost after Trump’s election to a second term, but they lost significant ground as investors rotated away from riskier investments and the outlook for growth slowed.
Ether, the second-largest cryptocurrency, fell 45.62% between January and March.
Cryptocurrency Performance
The author or authors do not own shares in any securities mentioned in this article. Find out about Morningstar’s editorial policies.

 United States