This letter was originally published on royceinvest.com by Chuck Royce, Chris Clark, and Francis Gannon.
Why Two Maxims Are Especially Relevant Now
The first six months of 2021 offered an important reminder that the economy and the equity markets—small cap stocks included—advance at their own speeds. The first quarter of 2021 saw economic acceleration in the form of U.S. real GDP growth of 6.3%, a considerable increase from 4Q20’s also strong 4.3% mark. This growth continued into 2Q21, when real GDP came in at 6.5%, both quarters in line with current consensus estimates of 6-7% annual growth. Over the same period, small cap returns, as measured by the Russell 2000 Index, moved at the opposite pace, from 31.4% in 4Q20 to 12.7% in 1Q21, and finally to 4.3% for 2Q21.
Accelerating Economy, Decelerating Market Russell 2000 Index Quarterly Returns vs. U.S. Real GDP Growth (annualized, quarter over quarter) .png?auto=webp&disable=upscale&width=565)
These seemingly disconnected results are actually more closely connected than they appear. They also provide us with the opportunity to remind investors of an important investment maxim: that it often makes sense to discount the relevance of current economic news when thinking about how to invest. The stock market has a well-founded reputation as a forward-looking force, often traveling six to 12 months ahead of economic results. This dynamic highlights why the best returns often come when current economic news seems dire or pedestrian. March 2020 provided just the latest example of this long-running phenomenon. And—as the direction of small-cap’s last three quarterly returns makes clear—the other side of this relationship is also frequently accurate: prospective equity returns can be far more subdued when the economy is most robust. (There is a silver lining for active managers to this market-economy dynamic, but more on that later.) Seen from this perspective, the first half’s simultaneous economic acceleration and small-cap deceleration was, in a period that continues to provide plenty of atypical behavior, reassuringly conventional.
The first half of the year also came to a close with nearly every trend established within the equity markets from the March 2020 troughs still firmly in place. To wit: small cap finished ahead of large cap for the year-to-date period ended 6/30/21, as measured by the Russell 2000 (+17.5%) and Russell 1000 (+15.0%) indexes, thus extending the leadership shift that began more than 15 months ago. Similarly, the Russell 2000 Value Index, which advanced 26.7%, solidified its nascent market cycle advantage over the Russell 2000 Growth Index—which rose 9.0%—following nearly a decade of underperformance—an unprecedented length of time for growth to outpace value since the inception of the style indexes. Also within small cap, cyclical sectors maintained a convincing lead over their defensive counterparts.
Will these trends continue? We think they will. What we flesh out in this letter, then, is our case for extended small-cap leadership and, within the asset class, ongoing outperformance for value. Our research delves into equity returns during previous periods of strong nominal GDP growth, current valuation levels, and historical small cap returns patterns, all of which have given us what we admit is an arguably paradoxical point of view: a strong sense of guarded optimism.
Be Aware of Recency Bias
Some readers may think we are on shaky ground in arguing that small cap’s first-half leadership looks built to last. And there are reasons that might appear to support the notion that leadership has moved back to large caps. After its historic one-year rally through the end of March 2021—which included three consecutive quarters outperforming large caps—small cap’s advance moderated. The Russell 2000 also fell behind its large-cap sibling during the second quarter of 2021, up 4.3% versus 8.5% for the Russell 1000. And while the Russell 2000 established its latest all-time peak on March 15th, the Russell 1000 reached its latest peak as recently as July 26th, after making previous new highs several times toward the end of the second quarter. In this context, we suspect a certain amount of recency bias may be preventing small-cap skeptics from seeing just how strong first-half performance was—and not just for small cap, but for cyclicals, small-cap value, and micro-cap stocks (which rose 29.0%, as measured by the Russell Microcap Index). For example, the Russell 2000’s 17.5% gain was well above the index’s rolling monthly average six-month return of 6.7% since its inception (12/31/78). History also shows that intra-cycle leadership shifts occur with some regularity during market cycles, as do changes in the tempo of performance. For example, after small caps experienced a very strong absolute and relative recovery in 2009, a digestion period followed in which returns were negative over the next six months before the asset class resumed a positive pace and held on to market leadership.
In addition, it’s worth noting that first-half returns being highest for the smallest capitalization asset classes (as well as being significantly in value’s favor) lines up exactly as we would expect during a period of widespread economic recovery. Equally important, we see little on the horizon in the economy, the market itself, or—and this is always most relevant to us—in our analysis of companies and conversations with management teams—to suggest that small cap’s leadership phase has run its course.
Has Small-Cap’s Run Only Just Begun?
The growing economy underpins an important part of our optimism for small cap’s continued leadership over large cap. Notwithstanding ever-present sources of concern, our bottom-up view of the economy, which we glean from analyzing a wide swath of companies, shows that the U.S. in particular continues to skew heavily toward expansion. The U.S. consumer, whose spending comprises roughly 70% of our economy, is financially flush. With notably strong consumer balance sheets and low mortgage rates, the housing market remains healthy while also boasting favorable long-term demographic trends. Retail and restaurant sales are increasing steadily, passenger air travel remains on the rise, and roads and highways are busy. We would also add lower unemployment, and the potential boost—after the requisite political wrangling—of additional fiscal stimulus, much of it in the form of long needed infrastructure spending, to this list of positives.
And while past performance is no guarantee of future results, history is admirably clear about the pattern of U.S. equity leadership when the economy expanded. During prior periods of robust economic growth, small caps have enjoyed a decided performance edge over their large cap siblings. When nominal U.S. GDP growth exceeded 5% in year-over-year periods, the Russell 2000 beat the Russell 1000 65% of the time with an average annual return of 22.1% versus 17.0%. This is especially relevant to the current environment because consensus projections call for nominal GDP growth in the 8-10% range for 2021 and 5-7% for 2022.
Small Caps Have Tended to Outpace Large Caps in Periods of High Economic Growth Russell 2000 vs Russell 1000 Regimes from 6/30/01 to 6/30/21 .png?auto=webp&disable=upscale&width=565)
The state of valuations between small and large caps is also relevant. With more and more market observers expressing concern about share prices in the U.S. market being unsustainably elevated, we looked at the situation by dividing the market by capitalization. To gauge valuations, we used one of our preferred metrics, enterprise value divided by the last 1-year’ earnings before interest & taxes (“EV/LTM EBIT”), excluding companies with negative EBIT. Although small cap delivered a significant outperformance over large cap over the past year (+62.0% vs. +43.1%), small-cap stocks are still relatively undervalued versus large caps when compared against their valuation range over the past 20 years.
Relative Valuations for Small Caps Are Near Their Lowest in 20 Years Russell 2000 vs. Russell 1000 Median LTM EV/EBIT(1) (ex. Negative EBIT Companies) From 6/30/01 to 6/30/21 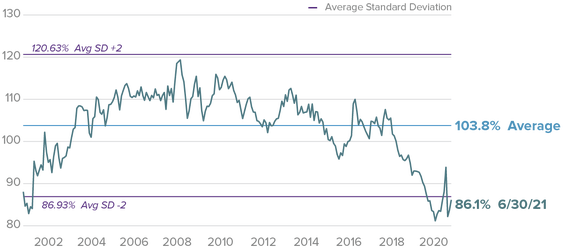
We think that the combination of the asset class’s strong history in growing economies and its more attractive relative valuations make a powerful case for small cap’s ongoing leadership in the U.S. equity market.
Three Charts That Show Small-Cap Value’s Advantage
In addition to looking for small caps to continue posting attractive relative and solid absolute results, we also expect small-cap value to maintain leadership within small cap—and for the same two reasons as small cap’s relative advantage over large caps: 1) Small-cap value has enjoyed a pronounced tendency to outperform small-cap growth when nominal economic growth has been above average and 2) small-cap value’s relative valuation compared with its historic range also looks attractive. The rationale for small-cap value outperforming in periods of high nominal economic growth is rooted in the idea that small-cap value is both more cyclically sensitive than its growth sibling and a greater beneficiary of inflation for relative earnings growth and valuation.
Our research confirmed this relationship as we looked back over the past 20 years and found that in one-year periods with at least 5% nominal GDP growth, the Russell 2000 Pure Value Index outperformed the Russell 2000 Pure Growth Index 68% of the time by an average of 420 basis points. In contrast, when nominal GDP growth fell between 3-5%, the small-cap value index outperformed only 32% of the time and lagged small-cap growth by an average of 100 basis points. As noted earlier, with consensus projections for nominal GDP growth for 2021 and 2022 both in excess of 5%, the future environment seems well suited to continued outperformance for value.
Strong Economic Expansion Has Favored Value Rolling 1-Year Returns for the Russell 2000 Pure Value vs Russell 2000 Pure Growth Indexes from 6/30/01 to 6/30/21 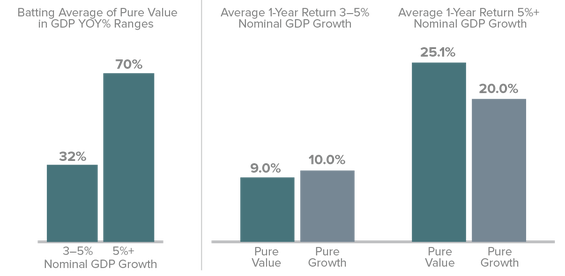
Despite these favorable conditions, some readers, in noting that small cap value has already beaten small-cap growth by a sizable margin over the last year (+73.3% versus +51.4%), may be wondering how much more outperformance value has left. We’d suggest that extending the time periods from the last one year to include the last three and five years reveals a starkly different picture. The Russell 2000 Value lagged its growth counterpart by more than 500 basis points for both the three- and five-year annualized periods ended 6/30/21. Given the depth of value’s underperformance over much of the past five years, then, the idea that value’s run might also be over seems ill founded to us.
Despite Leading from One Year, Value Trails by a Large Margin for Three- and Five-Year Periods Russell 2000 Value vs Russell 2000 Growth Average Annual Total Returns as of 6/30/21 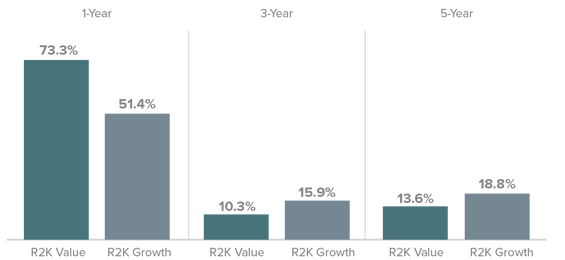
Current valuations add one final piece of the puzzle: just as small cap valuations finished June looking more attractive than those of large cap, small-cap value wound down 2021’s first half looking far more attractively valued than its growth counterpart—based on the same EV/EBIT metric we used above. Indeed, even after accounting for its recent performance dominance, small-cap value stocks are as inexpensive compared to their small-cap growth cousins than at any time in the last 20 years.
Small-Cap Value Sells at Near Its Lowest Valuation to Growth in 20 Years Russell 2000 Value and Growth Shifted Median Relative LTM EV/EBIT(1) Russell 2000 Value/Growth from 6/30/01 to 6/30/21 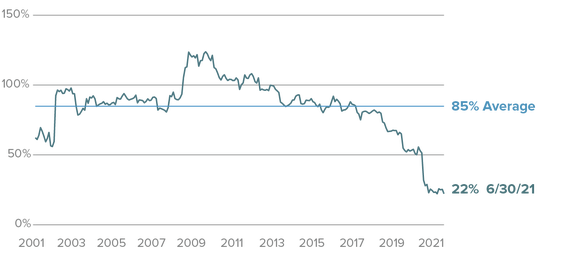
Watching for Clarity amid Mixed Signals
As disciplined investors, it’s important to acknowledge that not all of our research paints an equally positive picture. In addition to the data shown above, we also perform a regular review of certain historical indicators. Three were somewhat mixed at the end of June, though not to the degree that altered our outlook for small cap market leadership or positive long-term results. The gloomiest of these indicators was high-yield spreads, which were near the low end of their historical range at the end of the first half. Low high-yield spreads have historically been a forward indicator for low—at times even negative—small cap returns. The second indicator compared recent long-term performance with long-term historical averages and showed that the annualized three-year return for the Russell 2000 at the end of June was 13.5%, well above its rolling monthly three-year average annual return since inception of 10.3%. Like all asset classes, small caps experience multi-year periods where they post higher-than-average and endure lower-than-average returns. The most recent three-year period being markedly above the asset class’s long-term historical rolling average suggest that we should anticipate some mean reversion in long-term returns. A more positive outlook might be derived from our calculation of the equity risk premium, which we use to evaluate small-cap valuations by taking current, ultra-low interest rates into account. In doing so, we subtract the free cash flow yield (free cash flow divided by enterprise value) from the 10-year U.S. Treasury yield. Based on historical patterns, the small-cap equity risk premium was signaling returns in the range of low double digits.
None of these observations were surprising. With all of the ups and downs the market has experienced since June 30, 2016, many investors may not realize that small caps have more than doubled over that five-year span. A multi-year period of moderately lower returns is to be expected after that high level of performance.
However, we have now arrived at the aforementioned silver lining. The second investment maxim that is especially relevant to the current environment is that, perhaps paradoxically, active small-cap managers have actually added their greatest share of excess return when the Russell 2000 has delivered lower returns—single-digit results over five-year periods to be precise.
Monthly Rolling 5-Year U.S. Small Blend (1) Average Excess Returns During Russell 2000 Return Ranges From 12/31/78 through 6/30/21 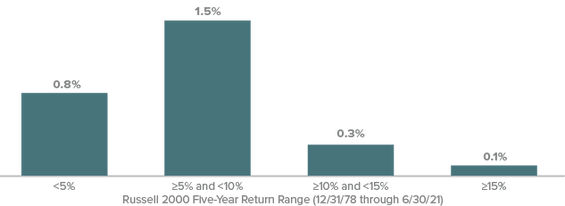
1 There were 514 US Fund Small Blend Funds tracked by Morningstar with at least five years of performance history as of 6/30/21. Past performance is no guarantee of future results. The excess return for a Morningstar category would be the category’s return for the period minus the Index return. Source: Morningstar
The Age of Alpha?
For most of the last decade, simply buying the market worked very well. The conditions were close to ideal for a market cap weighted, index-based approach. Large cap beat small cap, and mega caps beat large caps. The economy grew very slowly and with a good deal of volatility, while 10-year Treasury yields ended the period at less than half of the 3.2% at which they started it. This significant decline in yield fused with the scarcity of economic growth to drive outperformance for duration-sensitive, mega-cap growth stocks. The behemoths in turn drove index returns. We would describe this roughly 10-year period as “the era of beta” because overall market returns were so much higher than economic and profit growth, making it difficult for active strategies to stand out. Yet we believe that what we’re calling the “age of alpha” is in front of us—alpha being the term that describes an investment approach’s ability to beat the market.
As we have outlined, there’s good reason to anticipate a period of above-average economic and profit growth that’s accompanied by more subdued market returns. We believe this kind of environment gives disciplined active managers, especially those with a quality bias, an excellent opportunity to excel. A market in which there will be considerable differentiation is apt to reward the very fundamentals we focus on most. So while we anticipate lower overall U.S. equity returns than what the markets have given investors over the last 12-15 months, we also anticipate positive results—for small caps as an asset class and, more specifically, for small-cap value and select cyclicals.
There are always challenges, of course—and surprises, such as the Dow’s 500-point swoon on July 20th. And small cap will almost definitely be contending with two countervailing forces over the next year or more: their fall through most of June and July notwithstanding, slowly rising rates seem likely to push down on valuations just as many companies are likely to be reporting healthy and growing earnings through at least the end of next year. These forces, however, will not affect all small-cap stocks equally. We believe that we offer our investors the requisite experience, discipline, and expertise to select those companies best positioned to benefit from the more challenging environment we see ahead—one that looks like a promising period for active small-cap management.
Important Disclosure Information
The thoughts concerning recent market movements and future prospects for small-company stocks are solely those of Royce Investment Partners, and, of course, there can be no assurances with respect to future small-cap market performance.
The performance data and trends outlined in this presentation are presented for illustrative purposes only. Past performance is no guarantee of future results. Historical market trends are not necessarily indicative of future market movements.
Cyclical and Defensive are defined as follows: Cyclical: Communication Services, Consumer Discretionary, Energy, Financials, Industrials, Information Technology, and Materials. Defensive: Consumer Staples, Health Care, Real Estate, Utilities.
Beta is a measure of the volatility or risk of an investment compared to the market as a whole. Alpha describes an investment strategy's ability to beat the market.
Sector weightings are determined using the Global Industry Classification Standard ("GICS"). GICS was developed by, and is the exclusive property of, Standard & Poor's Financial Services LLC ("S&P") and MSCI Inc. ("MSCI"). GICS is the trademark of S&P and MSCI. "Global Industry Classification Standard (GICS)" and "GICS Direct" are service marks of S&P and MSCI.
Frank Russell Company (“Russell”) is the source and owner of the trademarks, service marks and copyrights related to the Russell Indexes. Russell® is a trademark of Frank Russell Company. Neither Russell nor its licensors accept any liability for any errors or omissions in the Russell Indexes and / or Russell ratings or underlying data and no party may rely on any Russell Indexes and / or Russell ratings and / or underlying data contained in this communication. No further distribution of Russell Data is permitted without Russell’s express written consent. Russell does not promote, sponsor or endorse the content of this communication. All indexes referenced are unmanaged and capitalization-weighted. The Russell 2000 Index is an index of domestic small-cap stocks that measures the performance of the 2,000 smallest publicly traded U.S. companies in the Russell 3000 Index. The Russell 1000 Index is an unmanaged, capitalization-weighted index of domestic large-cap stocks. It measures the performance of the 1,000 largest publicly traded U.S. companies in the Russell 3000 Index. The Russell Microcap Index includes 1,000 of the smallest securities in the Russell 2000 Index, along with the next smallest eligible securities as determined by Russell. The Russell 2000 Pure Value Index is an unmanaged index composed of securities with strong value characteristics selected from the Russell 2000 Index. Securities are weighted based on their style score. The Russell 2000 Pure Growth Index is an unmanaged index composed of securities with strong growth characteristics selected from the Russell 2000 Index. Securities are weighted based on their style score. The Russell 2000 Value and Growth indices consist of the respective value and growth stocks within the Russell 2000 as determined by Russell Investments. Index returns include net reinvested dividends and/or interest income. The performance of an index does not represent exactly any particular investment, as you cannot invest directly in an index.
For the Morningstar Small Blend Category: © 2021 Morningstar. All Rights Reserved. The information regarding the category in this piece is: (1) is proprietary to Morningstar and/or its content providers; (2) may not be copied or distributed; and (3) is not warranted to be accurate, complete or timely. Neither Morningstar nor its content providers are responsible for any damages or losses arising from any use of this information.
This material is not authorized for distribution unless preceded or accompanied by a current prospectus. Please read the prospectus carefully before investing or sending money. Smaller-cap stocks may involve considerably more risk than larger-cap stocks. (Please see "Primary Risks for Fund Investors" in the prospectus.)


