
Unlock the Potential of Muni CEFs
Munis provide investors with a meaningful tax advantage, and discounts add to the appeal.


Closed-end funds can offer investors a superior way to invest in a diversified basket of tax-advantaged bonds, but the complexity of the CEF wrapper might understandably scare some investors away. This month we will attempt to demystify municipal-bond CEFs so that investors can unlock the potential within.
Investing in municipal bonds is the most common CEF strategy--muni funds constituted nearly one third of total CEF assets as of January 2016. This popularity is no accident. The mutual fund wrapper allows individual investors to enjoy the advantages of owning bonds that pay tax-advantaged income while avoiding many of the pitfalls of direct ownership, such as difficulty in trading and lack of diversification. The CEF wrapper adds the benefit of a closed capital structure, a significant advantage over open-end funds in this particularly illiquid space of the market. This is because CEF managers are not forced to buy or sell based on investor appetite (that is, fund flows) but can instead focus on finding the best opportunities to buy and sell securities. What's more, because CEF managers operate with a relatively constant amount of capital, they can be more fully invested in the strategy.
Why Muni Bonds? Before we dive into CEFs, a quick refresher on why investors should consider muni bonds is warranted. The distinguishing feature of muni bonds is the tax status of their interest payments. Although municipal-bond coupon payments may appear low at first glance, most yields are exempt from federal taxes. In addition, most states and municipalities do not tax their residents on in-state and local muni debt income, and some states disregard muni taxation altogether. As a result, investors--especially those in high-income tax brackets--can usually receive higher aftertax income through munis than they can through taxable bonds that have larger published yields. For this reason, it is important to calculate a tax-equivalent yield for muni bonds (and funds) before comparing yield to that of taxable bonds (and funds). This goes for open-end, closed-end, and exchange-traded funds investing in muni bonds. The formula for tax-equivalent yield is below:
× = total yield/(1-tax rate)
Investing in Muni-Bond CEFs Because we are talking about CEFs, we must consider both the distribution rate at share price and at net asset value (NAV). CEFs publish a distribution rate based on its underlying NAV, but investors will receive the distribution rate based on the price they paid for the shares. Historically, muni CEFs have sold at a discount, which means the share price is below NAV. This is advantageous for income-oriented investors because it boosts the distribution rate an investor receives, before any tax considerations. The formula to calculate this increase in payment is below:
× = distribution rate at NAV/(1-discount)
For a fund paying a 5% distribution at NAV and trading at a 10% discount, for instance, the enhancement to the distribution rate based on the discount is 5.56%, or a 56-basis-point increase in payout. This is often called "yield enhancement."
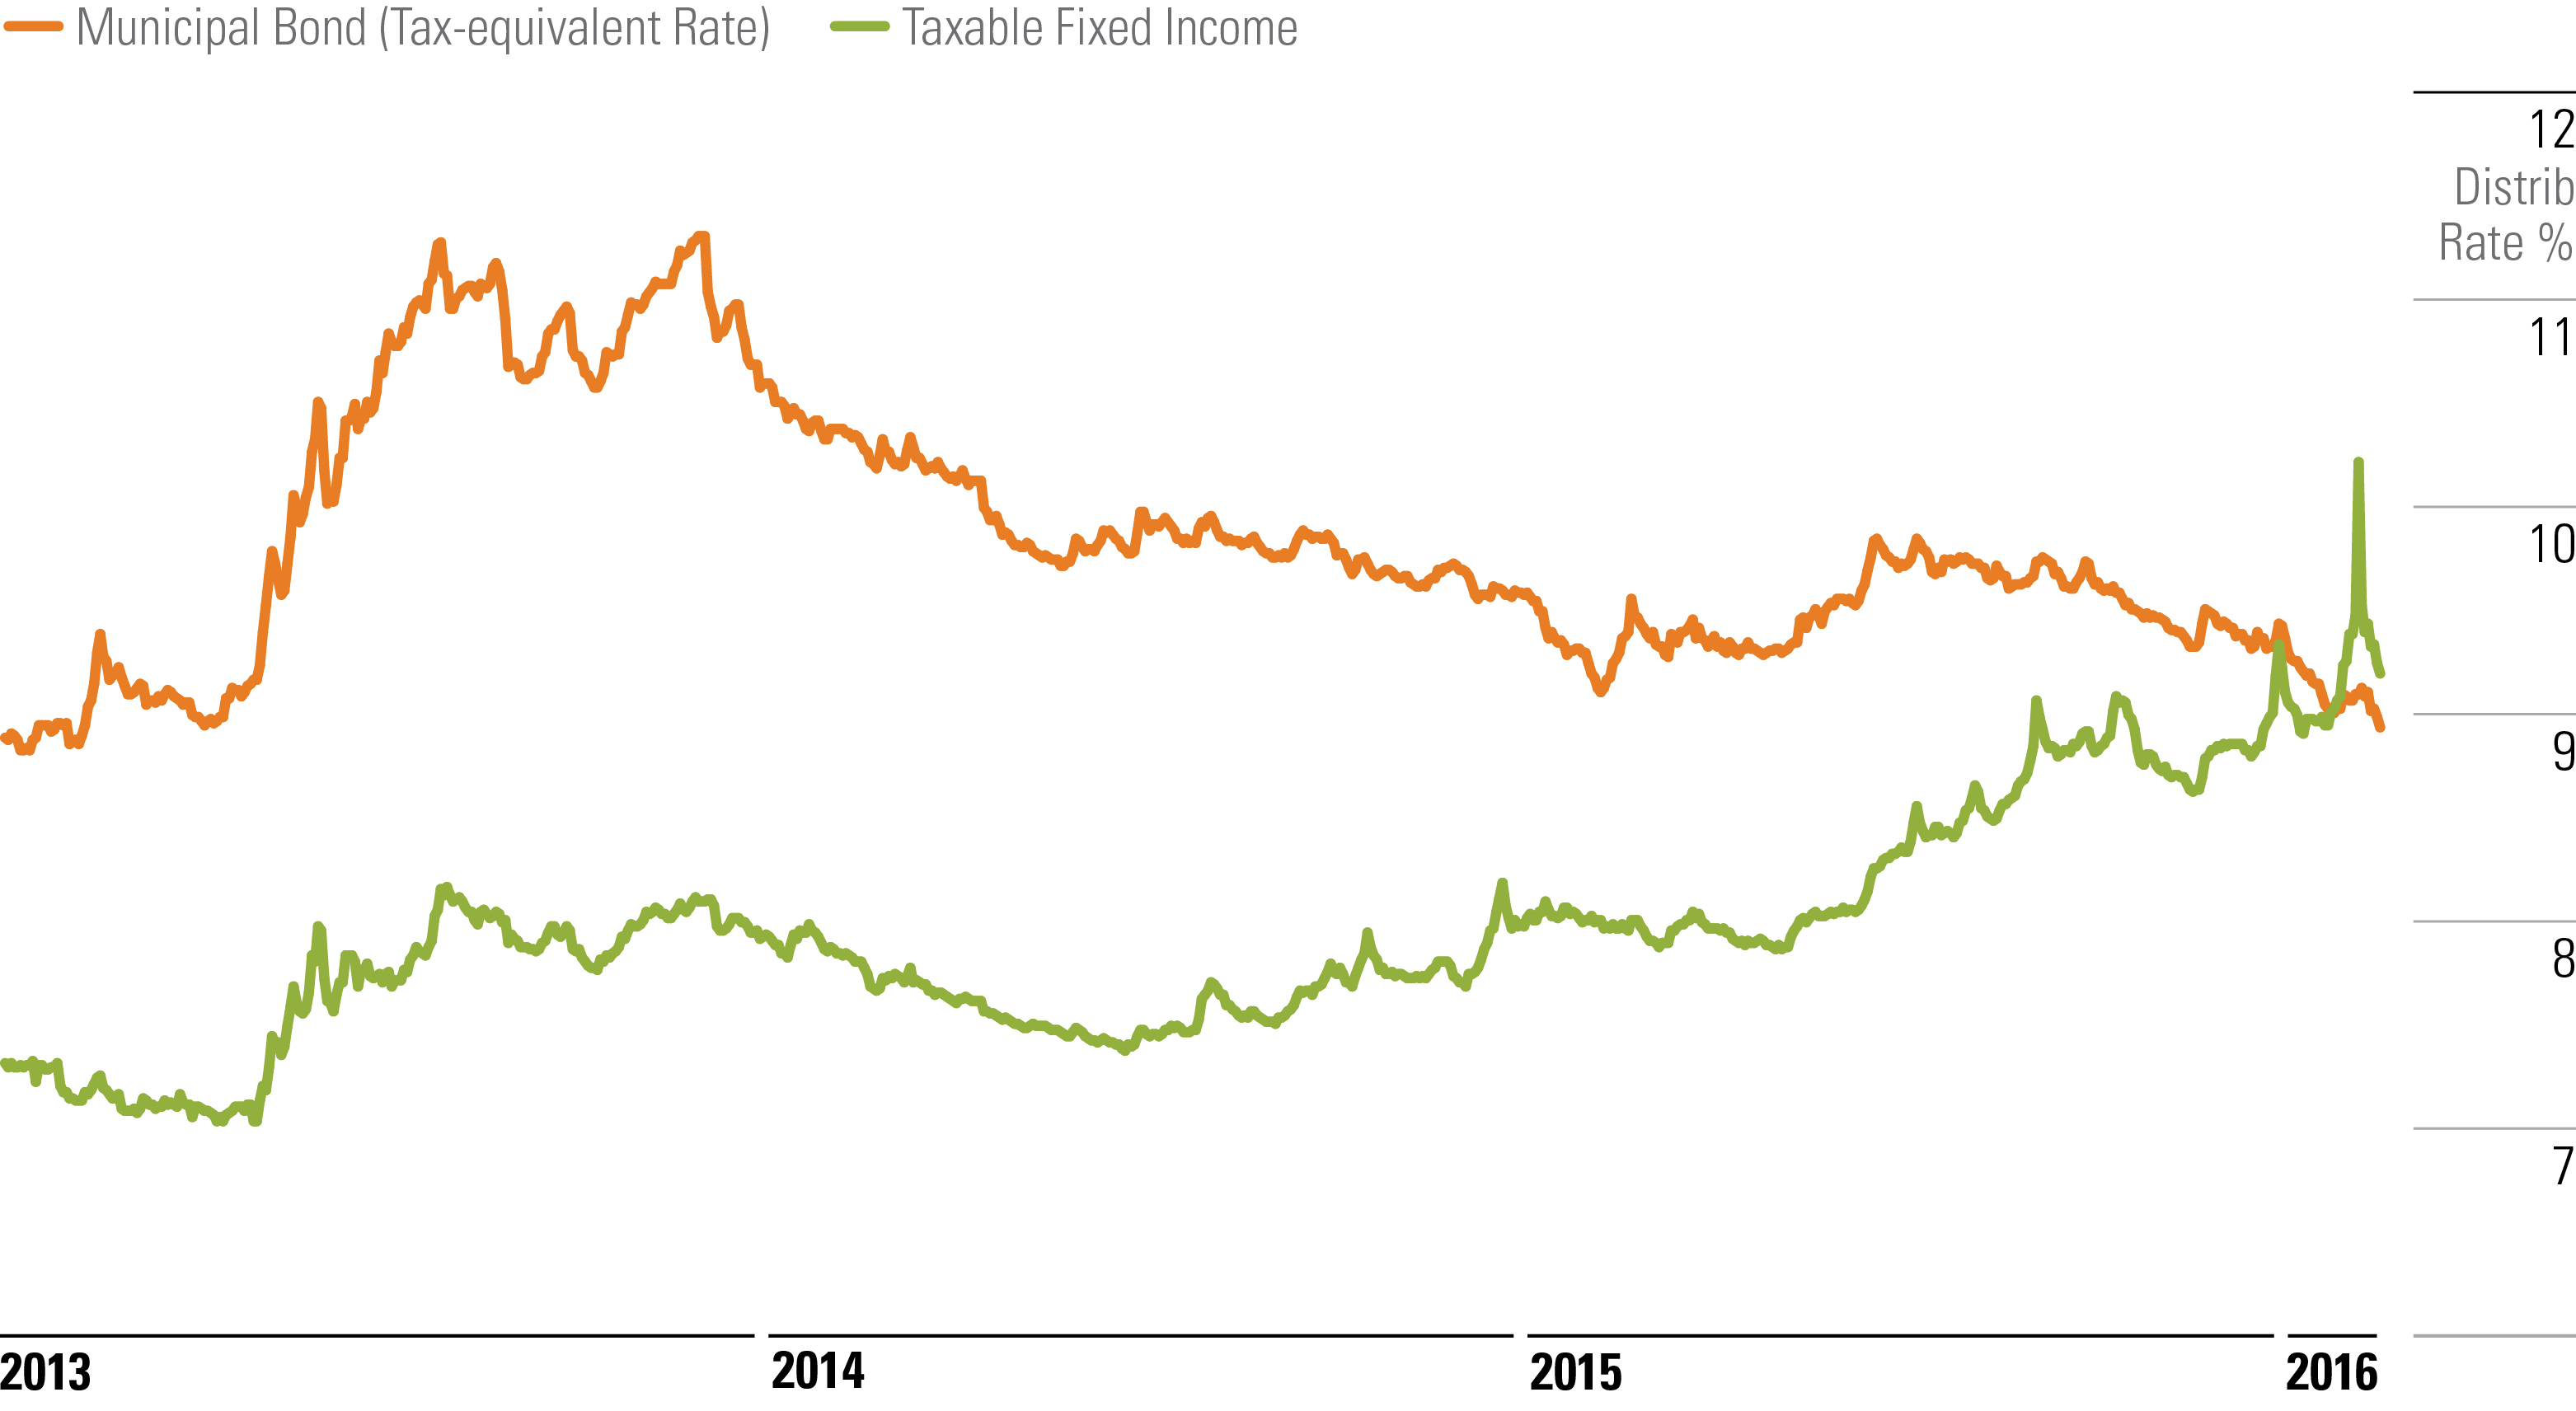
Exhibit 1: Taxable and Tax-Equivalent Total Distribution Rates at Share Price
Source: Morningstar Direct.
Compared with taxable-bond CEFs, muni CEFs tend to pay higher distribution rates at both share price and NAV once taxes are taken into account. But the recent rally in muni bonds, which coincided with a sell-off in riskier credits (that is, many taxable-bond funds), caused the average taxable-equivalent distribution rate (based on share price) of muni-bond CEFs to fall below that of taxable-bond CEFs for the first time in three years. The chart above shows those distribution rates, assuming the investor is in the highest income tax bracket (39.6%), during the last three years through January 2016. A spike in distribution rate at share price for the average taxable-bond CEF happened in mid-January, when the average taxable-bond CEF's discount widened to nearly 11%, pushing the average distribution rate above 10%.
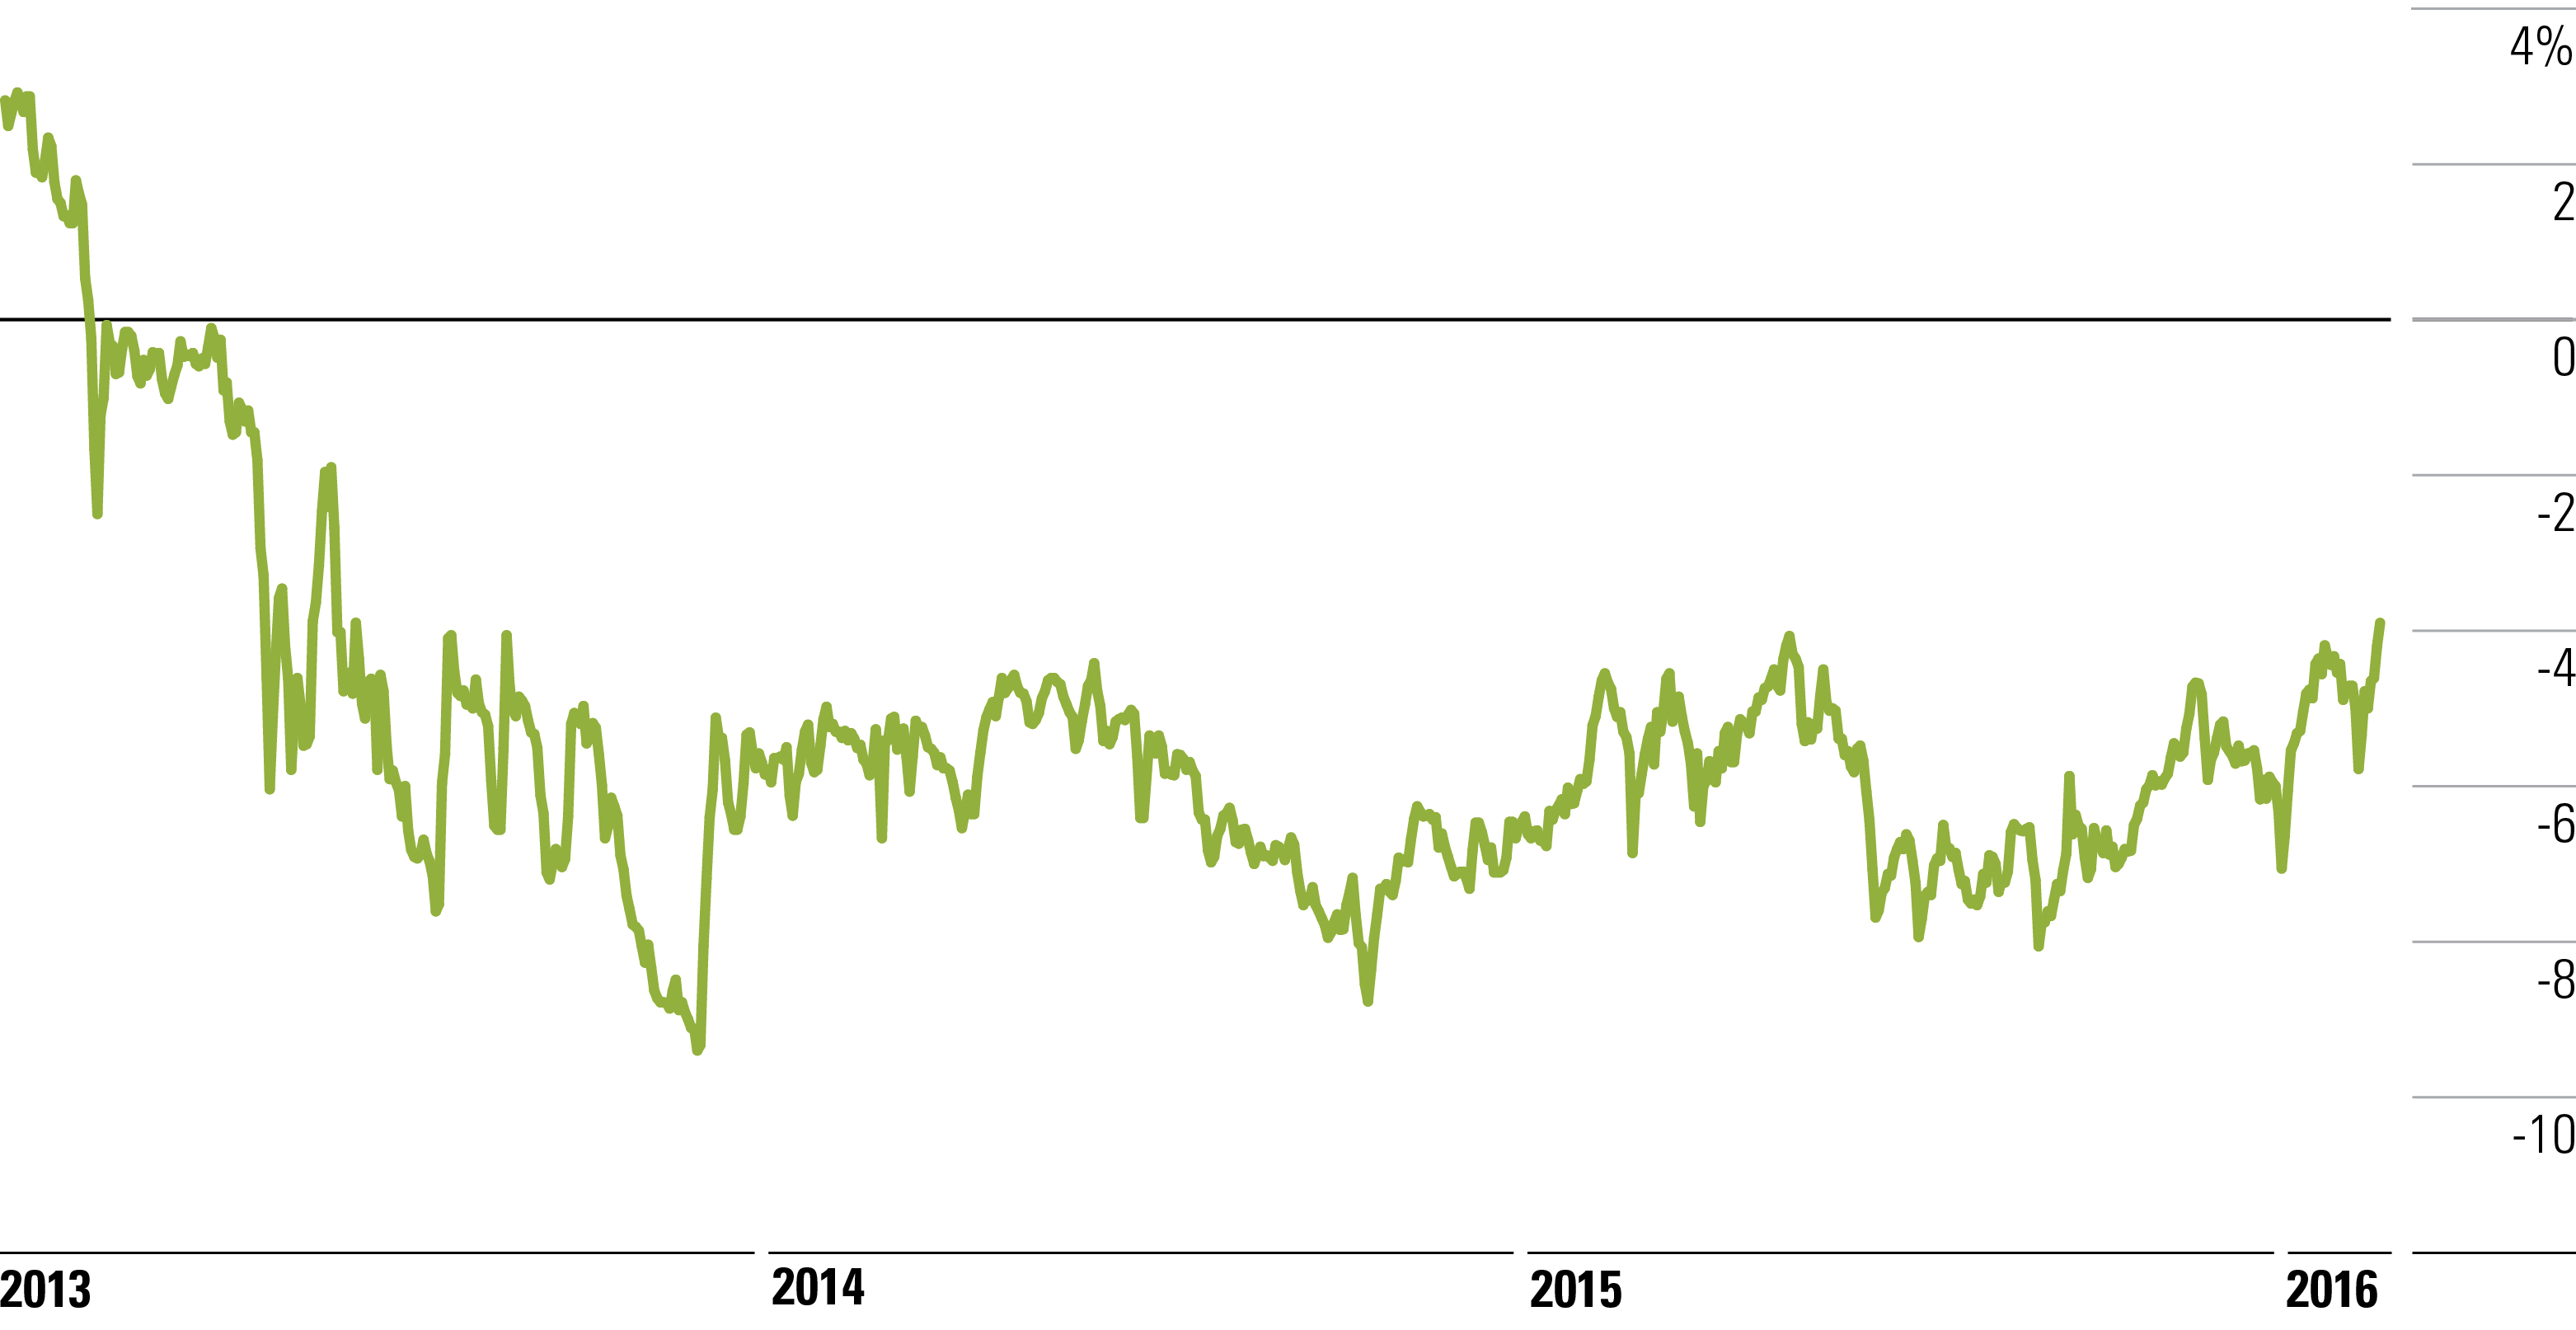
As with all CEFs, a widening discount, which could lead to lower price appreciation, is a potential concern. However, this is a larger consideration for short-term investors looking to sell their shares in the near future than for long-term investors seeking tax-advantaged income. As of January 2016, the average muni CEF was trading at a discount of more than 4% to its NAV compared with more than 8% for the average taxable-bond CEF. The chart below shows the three-year average discount for muni CEFs.
Exhibit 2: Average Discount for Municipal-Bond CEFs
Source: Morningstar Direct.
Leverage Another factor that CEF investors must consider is leverage. Of the 180-plus national muni CEFs, 95% use some form of leverage. Most of the unleveraged funds are very small and tend to be single-state funds, which means nearly all of the largest national muni funds are leveraged. Leverage use varies to a great degree among funds, but as of January 2016, the average leveraged muni fund had a leverage ratio of 1.44 (total assets/net assets).
Leverage allows a fund to pay a higher distribution rate than a similarly invested unleveraged fund. For example, the average distribution rate at NAV for leveraged muni CEFs was just over 5% at the end of January while the average for unleveraged CEFs was under 3%. (Remember those distribution rates are before the funds' share prices and tax advantages are considered.)
Leverage should also translate to higher absolute returns over the long run, and, in practice, this has been the case. Surprisingly, risk-adjusted returns (as measured by the Sharpe ratio) during the past 10 years, which includes the 2008 financial crisis, have also been better for the average CEF than its unleveraged open-end counterpart. The table below shows the returns of two of the largest muni-bond Morningstar Categories (CEF and open-end) during the past three years and 10 years through January as well as three- and 10-year Sharpe ratios.
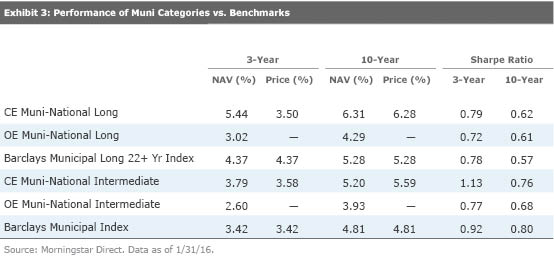
This strong performance can largely be attributed to the positive slope of the muni yield curve. CEF managers can borrow money, issue preferred shares, or sell inverse-floating-rate securities, all of which are tied to short-term rates, and reinvest in the higher long-term rates paid by the longer-term muni bonds. Because munis are considered very likely to follow through on their long-term debt obligations given the relatively strong credit profiles, they are useful securities for taking advantage of the yield curve via a "carry trade."
Along with the potential for higher long-term returns because of the use of leverage, there are important risks to consider. First, although beneficial when the yield curve slopes positively, this carry trade exposes funds to short-term interest-rate risk. If the curve flattens or becomes negative, funds would see diminished or negative returns on leverage. Second, leverage amplifies share-price volatility, which means CEFs' returns are generally more volatile than similarly invested open-end funds. In fact, during the 10 years through January, the CEF muni-national long Morningstar Category (the largest category for muni CEFs) had an average standard deviation of 9.0%, nearly twice that of the open-end category's average standard deviation of 5.5%.
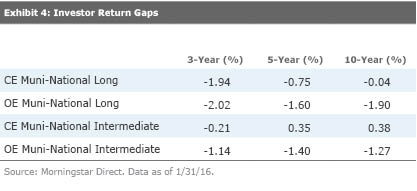
Generally, the more volatile an investment, the harder it is for investors to use it properly, though this wasn't the case for muni-bond funds over the trailing three- and 10-year periods. Morningstar measures how well investors use a fund by the "return gap," which is the difference between a fund's actual returns and the average investor's returns. To find the average investor returns, Morningstar looks at monthly fund flows and returns and then weights those by asset size to come up with an estimate of investor returns. Because CEFs don't have monthly flows, instead we can use the difference between a fund's NAV return and share-price return. The share price reflects investor sentiment by fluctuating around the NAV--when buyers are more motivated than sellers, shares trade at a premium and vice versa. Comparing these two measures of return gap, CEF investors actually captured more of the NAV return than open-end fund investors during the time periods analyzed. The table below shows the results.
Choosing a Muni CEF So, how do investors interested in the tax advantages of muni CEFs choose among the many options? First and foremost, a consideration of the fund's process (Is it a national muni fund or focused on a single state? Does it hold mostly investment-grade bonds or junk-rated bonds? How much leverage does it use, and what is the cost of that leverage?) as well as the tenure of the management team and its expenses is extremely important before considering a purchase of shares.
Following such evaluations, investors should be cautious to never chase high distribution rates. A big distribution, while alluring, is not very useful unless the fund can maintain it. Appraisal of a muni CEF should focus on its ability to pay stable distributions out of income earned from its underlying investments. Recurrent returns of capital and frequent distribution reductions are major red flags (this information can be found on the CEF quote pages on Morningstar.com for all CEFs). If a fund receives less in income (or realized capital gains, though this is a less likely scenario for muni CEFs than equity CEFs) than it intends to pay in distributions, it is faced with two options: return capital to investors or lower the distribution rate. Occasional return of capital is not necessarily harmful, especially taken with the investment environment. An unusually poor quarter, for example, might not be indicative of a fund's performance. Dipping into its capital base to maintain consistency can still be part of a good long-term management strategy because distribution cuts tend to cause a fund's share price to drop, which hurts long-term investors. That said, using this tactic with any sort of regularity is unsustainable and can be an indicator of either poor management or a forthcoming distribution cut. Investors should also note that income derived from realized capital gains is not exempt from federal taxes. Certain states, however, do not tax municipal capital gains on their own bonds.
Another important factor for CEF investors is valuation. A handy tool for evaluating whether or not a CEF's share price is trading at an attractive price is the z-statistic. The z-statistic measures how many standard deviations a fund's discount/premium is from its three-year average discount/premium. For instance, a fund with a z-score of negative 2 would be two standard deviations below its three-year average discount/premium. Funds with the lowest z-scores are classified as "relatively inexpensive," while those with the highest z-scores are considered "relatively expensive." We consider funds with a z-score of negative 2 or lower to be statistically undervalued and those with a z-score of 2 or higher to be statistically overvalued.
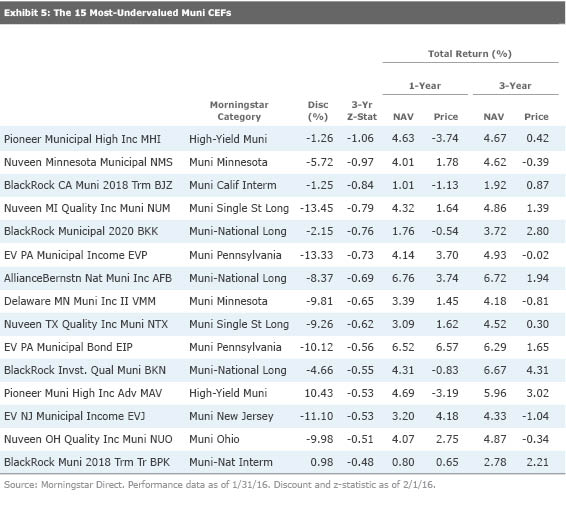
The table above lists the 15 most-undervalued muni CEFs as of Feb. 1 based on the three-year z-statistic. Although none of those funds is a screaming buy, their valuations are still fairly attractive given the uncertainty in the global marketplace and the steady tax-advantaged distributions.
A final consideration before buying (or selling) shares of a muni CEF is the generally very light trading volume. This is an issue for all CEFs but particularly important for muni CEFs, which tend to be small and even more thinly traded than some of the larger, more popular CEFs. Because of this, we recommend using limit orders to buy or sell shares.
Overall, investing in muni CEFs requires some leg work in terms of understanding discounts, distribution rates, and leverage, but over the long term, tax-sensitive investors can benefit from an allocation to these types of funds.
Emory Zink contributed to this article.

 United States