
A Calm Quarter for Closed-End Funds
Low market volatility leads to a benign start to the year for CEFs.

/s3.amazonaws.com/arc-authors/morningstar/af89071a-fa91-434d-a760-d1277f0432b6.jpg)
It was a relatively quiet quarter for closed-end funds as stock market volatility remained low and the Fed's interest-rate hike was widely anticipated. There were three CEF IPOs in the first quarter of 2017, and each was a term fund with windup provisions in 2022. In sum, those three funds (all falling into the high-yield bond Morningstar Category) raised less than $600 million in assets. Below, we provide an overview of the quarter for the bond and equity markets followed by performance, discount, and valuation data for CEFs.
Market Overview: Bonds The riskiest bonds outperformed sharply in the first quarter, with particularly strong performances coming from funds in the emerging-markets bond and emerging-markets local-currency bond categories. Gains in the Mexican peso, which had struggled since 2015 and plunged following the U.S. election, helped buoy many funds despite continued tension between Mexico and the United States. Other key emerging markets, including Brazil--which has encouraged investors with recent reforms--and Russia, also surged. World-bond funds with significant exposure to emerging-markets debt benefited from that strength. Corporate debt was another winner for the quarter. The convertibles category flourished thanks in part to solid returns in the equity markets. Meanwhile, despite a modest loss in March, the high-yield bond category enjoyed healthy gains as default rates continued to decline.
By the time the Federal Reserve hiked rates in March, the markets had widely priced in the move and, as a result, the reaction was relatively muted. Notably, yields on intermediate- and long-term bonds barely budged over the quarter after seeing a sharp increase in the second half of 2016 that accelerated in the weeks after the election. The yield on the 10-year finished the quarter at 2.4%, down just a few basis points from where it finished 2016. That, combined with an increase in short-term yields, which are most sensitive to Fed policy, led to a flattening of the yield curve. Relatively stable rates supported modest gains for many investment-grade bond categories. The Bloomberg Barclays U.S. Aggregate Bond Index returned 0.8% for the quarter. Funds with sizable allocations to credit (including non-investment-grade bonds, which the index does not hold), and even non-U.S.-dollar currencies, flourished.
Municipal-bond funds were among the biggest losers in the fourth quarter of 2016 but turned in a solid opening quarter in 2017 against the backdrop of limited supply. Those gains came despite continued uncertainty for municipal investors surrounding tax reform, which could include changes to tax rates.
Market Overview: Equities U.S. stocks continued their march higher during 2017's first quarter: The S&P 500 was up 6.3%, while the Russell 2000 Index was up 2.2%. For most of the quarter, investors remained upbeat about pro-growth policy changes from the White House, though doubts began mounting after a failed effort to reform U.S. healthcare in late March. Economic data--including employment reports and consumer confidence--was generally strong during the first quarter. Large-cap funds outperformed their smaller-cap counterparts in the first quarter. One of the best-performing CEF categories for the quarter was technology, a sector within the broad Russell 3000 Index that gained 12%.
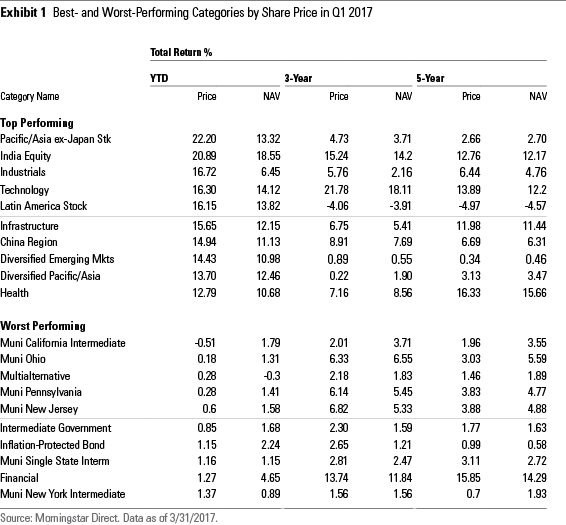
International equity markets, to a large degree, saw a reversal of some influential trends that had worked against funds investing in those markets in the fourth quarter of 2016. Most noticeable was the broad decline of the U.S. dollar. The dollar had risen in the fourth quarter, especially after the U.S. election results, as investors reasoned that the new administration's policies would attract investment to the United States and boost the dollar (as would the expected continuing increases in U.S. interest rates). That dollar rise damped fourth-quarter returns for funds that do not hedge currency risk, and the reversal helped those funds in 2017's first quarter. The diversified emerging-markets category, for example, gained 14% on share price last quarter.
Another positive reversal occurred in India. That market took a hit in the fourth quarter of 2016 after the government suddenly withdrew popular currency denominations from circulation. But evidence surfaced early this year that the impact of that move had not been as harmful to the economy as many had feared. Then, the governing party won an important state election. As a result, Indian stocks jumped. The India equity category gained 21% on share price last quarter and was the second-best-performing CEF category.
Exhibit 1 above lists the best- and worst-performing CEF categories for the first quarter of 2017, ranked by share price return.
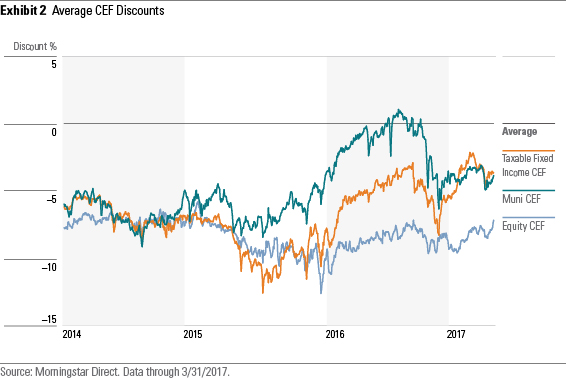
CEF Discount Trends The discounts of the two bond closed-end asset classes moved mostly in lock step during the first quarter, with taxable bonds trading at a slight premium to their municipal counterparts by quarter-end. Their average discounts converged for a brief two-week period at the end of February through the first week of March. By the end of March, each group's discount hovered around 4%, not too far from the start of the year. Equity funds, which began the year with an average discount of about 9.5%, finished the quarter with an average discount of 7.0%, near the group's average three years ago.
Exhibit 2 shows the average discounts for the three major CEF asset classes for the trailing three-year period.
Valuations We use a z-statistic to measure whether a fund is "cheap" or "expensive." As background, the z-statistic measures how many standard deviations a fund's discount/premium is from its three-year average discount/premium. For instance, a fund with a z-statistic of negative (positive) 2 would be two standard deviations below (above) its three-year average discount/premium. Funds with the lowest z-statistics are classified as relatively inexpensive, while those with the highest z-statistics are relatively expensive.
We consider funds with a z-statistic of negative 2 or lower to be "statistically undervalued" and those with a z-statistic of positive 2 or higher to be "statistically overvalued." Typically, we prefer to use the three-year z-statistic, which shows the funds that are most heavily discounted relative to their prices over the past three years. At the end of March, there were few bargains to be found among CEFs. Exhibit 3 shows the 10 most overvalued CEFs based on three-year z-statistics.
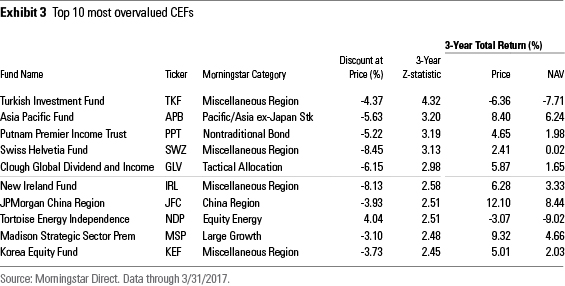
The most overvalued CEF on the list is an example of why investors shouldn't blindly follow z-statistics to make buy and sell decisions. The Turkish Investment Fund TKF, for example, is trading at a significantly low discount compared with its three-year average of 12%, but that's because the CEF is in the process of liquidating its assets to return the net asset value to shareholders. If the CEF is able to liquidate its holdings at the current NAV, investors will gain a further 6% return from the convergence of share price and NAV.
In all, the first quarter was a good one for CEFs with most categories posting positive returns on both share price and NAV. After an eventful fourth quarter of 2016, the relatively benign first quarter was a welcome respite.
Alaina Bompiedi contributed to this article.
/cloudfront-us-east-1.images.arcpublishing.com/morningstar/BNHBFLSEHBBGBEEQAWGAG6FHLQ.png)
/d10o6nnig0wrdw.cloudfront.net/05-02-2024/t_60269a175acd4eab92f9c4856587bd74_name_file_960x540_1600_v4_.jpg)
/cloudfront-us-east-1.images.arcpublishing.com/morningstar/5WSHPTEQ6BADZPVPXVVDYIKL5M.png)
:quality(80)/s3.amazonaws.com/arc-authors/morningstar/af89071a-fa91-434d-a760-d1277f0432b6.jpg)