
Municipal CEFs: Hold the Door
The threat of rising rates caused a brief sell-off in municipal bond CEFs in May. Plus, muni CEFs aren't as expensive as they look.


In February, we conducted a deep dive into the potential of municipal bond closed-end funds, which at the time were trading at significant discounts to their underlying net asset values. Since then, the CEF share prices have staged a strong rally and now trade at almost par. A short-lived sell-off in May, however, served as a stark reminder of how quickly interest-rate fears can drive prices.
Until the end of May, it was a fairly tranquil year for muni CEFs. Even with gloomy headlines about Puerto Rico's continued struggles to pay back its muni debt, demand has been strong for tax-advantaged bonds. Open-end muni-bond funds have had seven straight months of inflows through the end of April, according to Morningstar data. That's pushed muni bond prices higher as issuance of new bonds hasn't kept up pace with demand from income-seeking investors. Falling interest rates, which are inversely correlated to bond prices, have provided another source of returns, as 10-year Treasury yields have fallen from 2.24% at the start of the year to 1.84% at the end of May. That's driven the net asset value of the average muni national long CEF, which is where the majority of muni CEF assets are, to a 4% return for the year through the end of May.
As shares of CEFs trade on an exchange continually throughout the day, that steady demand has been reflected in the narrowing of the spread between the fund's share price and net asset value. Before the streak of inflows started last October, the average muni CEF was trading at a 7.3% discount to its NAV. By mid-May, the average discount had all but disappeared, giving shareholders an extra boost to returns from the convergence. The average market price return, which is what CEF shareholders actually experience, is 8% this year through the end of May.
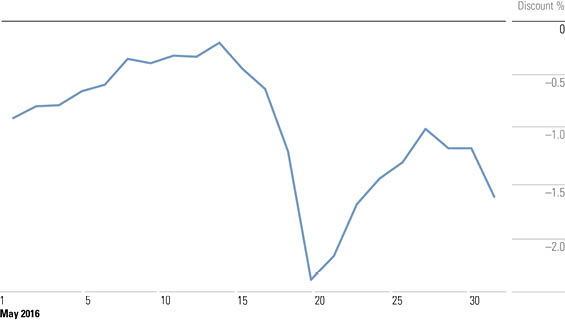
In late May, however, the minutes of the Fed's April meeting minutes were released and strongly suggested a rate hike was in play for June, assuming there were no big surprises in economic data (as May's weak job report ended up being). Two-year Treasury bill rates jumped 27%, to 92 basis points from 72 basis points in two weeks, and it sent jitters through muni CEF share prices. Exhibit 1 shows the average discount for muni- and taxable-bond CEFs throughout the month of May.
- Source: Morningstar Analysts
As the chart shows, the average muni CEF went from trading at near par to more than a 2% discount in a week. At first glance, a 2% loss in one week might not seem steep, but considering the underlying bonds barely flinched during that time period (the Barclays Municipal Index lost just 14 basis points), it's worth noting how finicky shareholders can be when confronted with the possibility of rising interest rates, particularly when shares are trading near par. In December, when the Fed actually did raise short-term interest rates by 25 basis points, the average discount for these funds was close to 7% and narrowed after the hike to finish 2015 at an average discount of less than 5%.
Investors should expect more volatility in share prices to come this year if signals start to point toward another rate hike. As the past six months have shown, wide discounts in muni CEFs don’t tend to persist. With that, long-term investors should do their best to ignore the noise or view it as a potential buying opportunity.
Morningstar currently recommends one muni CEF for long-term shareholders.
Gauging Muni CEF Prices One tool investors can use to gauge whether a fund's shares are attractively priced relative to its net asset value is the z-statistic. The z-statistic measures how many standard deviations a fund's discount/premium is from its three-year average discount/premium. For instance, a fund with a z-statistic of negative 2 would be two standard deviations below its three-year average discount/premium. Funds with the lowest z-statistics are classified as relatively inexpensive, while those with the highest z-statistics are relatively expensive. We consider funds with a z-statistic of negative 2 or lower to be "statistically undervalued" and those with a z-statistic of 2 or higher to be "statistically overvalued." That said, the z-statistic does have its flaws. It's important for investors to understand the economic environment and any fund-specific issues, such as a manager change, that could lead to wider-than-usual discounts or premiums.
Given the rally in share prices across the muni CEF space from August through May, most options look expensive now compared with short-term history. BlackRock MuniYield Quality III, for example, has a three-year z-statistic of 2.07, which would indicate it's trading at a relatively expensive price.
That said, the last three years have been somewhat unusual for muni CEFs. In 2013, muni CEFs were clobbered along with other fixed-income vehicles when long-term interest rates jumped a full percentage point in two months over fears that the Fed would begin to raise rates. The average muni CEF went from trading at par to an average discount of 10%, which is the widest the discount has been since the financial crisis.
Over the longer term, however, the BlackRock CEF doesn't look as expensive. Its five-and 10-year z-statistics of 1.17 and 1.32, respectively, certainly don't scream "Shut up and take my money!" but they show that fund is trading within a reasonable range. It’s a similar situation across the muni CEF spectrum. Exhibit 2 shows the average discount and z-statistic for the broader municipal Morningstar Category during the three-, five-, and 10-year periods ended May 31, 2016.

- Source: Morningstar Analysts
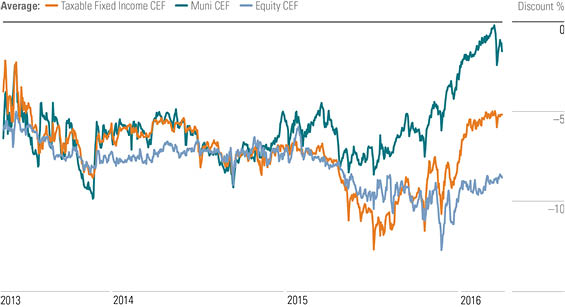
Discount Trends While muni CEFs have had a strong rebound in share prices year to date through May, in spite of the brief hiccup, taxable-bond CEFs and equity CEFs have not performed as well. The average taxable-bond CEF share price has narrowed to a 5% discount relative to par from an 8% average discount at the start of 2016. Taxable-bond CEFs tend to be heavy on credit exposure so the average discount tends to grow along with economic uncertainty. During the market volatility in January, for example, the average discount got as wide as 10% for this category. Equity CEFs have historically had the widest discounts of the three broad categories, mainly because of the volatility of the underlying holdings. The average equity CEF was trading at an 8.67% discount at the end of the month, slightly narrower than the 9.59% average discount at the start of the year.
Exhibit 3 shows the three-year average discount for taxable-bond, equity, and muni CEFs.
- Source: Morningstar Analysts
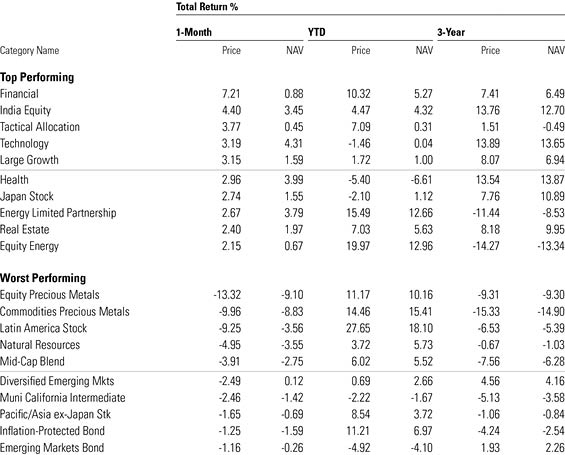
Best- and Worst-Performing CEF Categories Munis weren't the only asset class affected by the possibility of rising interest rates. Funds that invest in precious metals, like gold, and companies with strong ties to them saw the steepest sell-off in May. Gold, and to a lesser extent other precious metals like silver, platinum, and palladium, is sought after as a store of value in times of economic depressions. For that reason, precious metals have been top performers this year as investors sought to store value amidst a growing number of negative interest rates in developed countries. Potentially higher rates in the United States, however, take some of the shine off the metals' appeal. Gold fell from almost $1,300 an ounce at the start of May to $1,200 an ounce at the end of the month. Both the equity precious metals category, which consists of CEFs that invest primarily in companies related to the mining and distribution of precious metals, and the commodities precious metals category, which consists of CEFs that invest directly in the metals, saw large declines in both NAV and share price as strong selling pressure outpaced the falling asset prices.
Rates rising wouldn't be bad for every asset class. Financials sector equity CEFs saw a large jump in share prices as investors anticipated higher rates would be a tailwind for the sector. The average share price rose 7% compared with a NAV return of less than 1%.
Exhibit 4 shows the best- and worst-performing CEF categories in May.
- Source: Morningstar Analysts
Conclusion May's short-lived sell-off of muni CEFs is a reminder of the extra complexity inherent in CEFs compared with open-end funds. Not only do investors need to keep a keen eye on the performance of the underlying investments, but also how demand--or lack thereof--is affecting the share price. The good news is that this extra complexity can create opportunity for attentive long-term investors when market volatility is short-lived.
Kathryn Wing contributed to this article.

 United States