
Active Funds Trailed Passive Peers in 2024
Investors can use long-term trends to choose where to go active or passive.

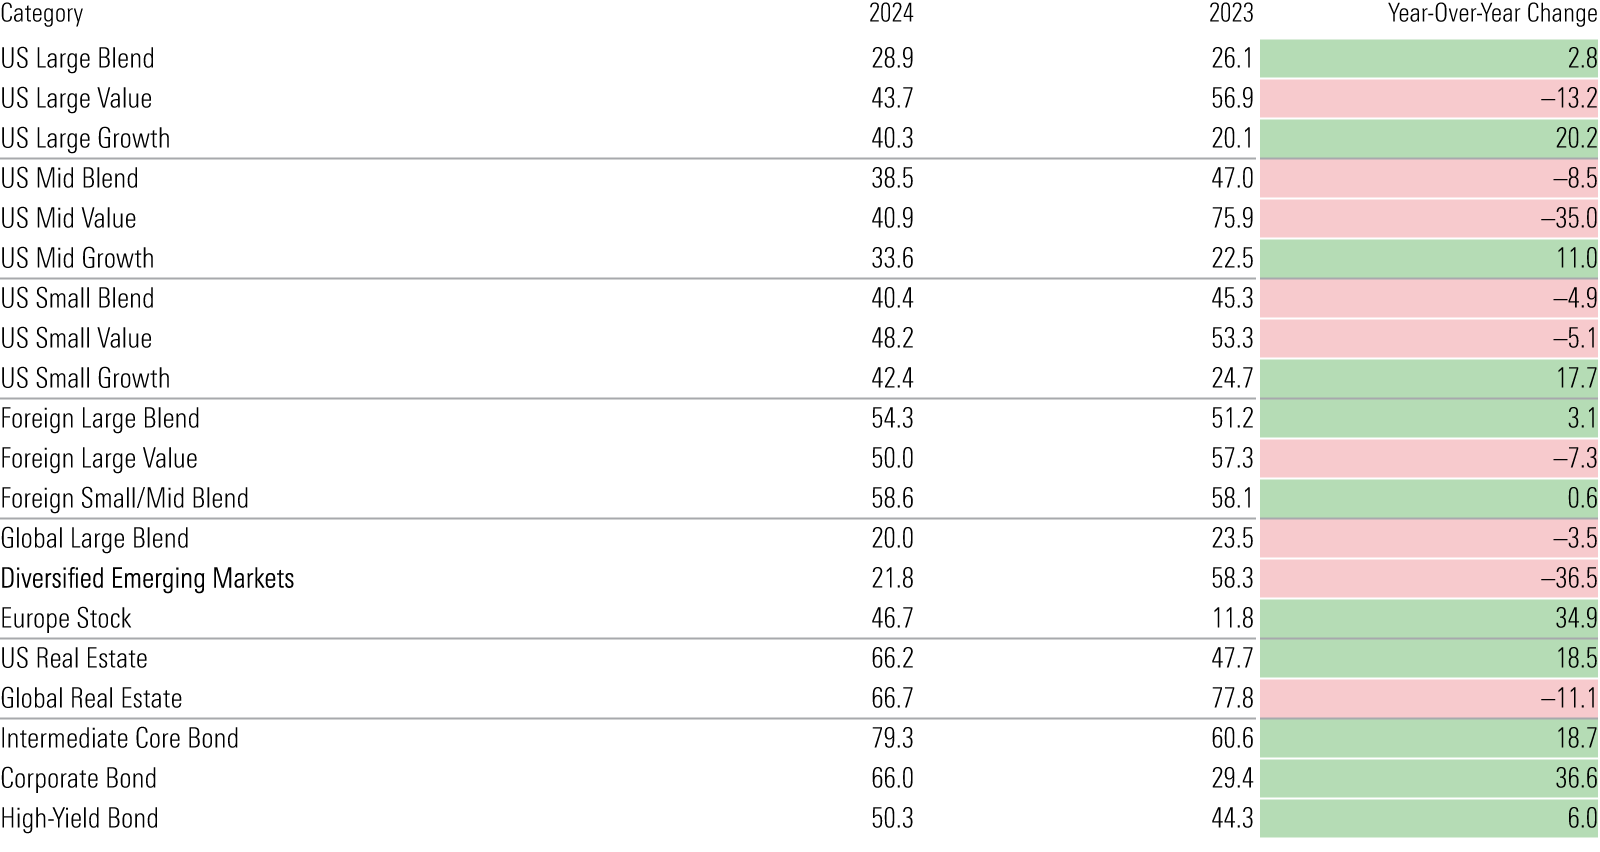
A strong year for stocks left little room for active managers to carve out an edge in 2024, while active bond managers benefited from taking on credit risk.
Of the 3,200 active funds included in our analysis, 42% survived and outperformed their average passive peer in 2024.
We further analyze these findings in the year-end 2024 installment of the Morningstar Active/Passive Barometer, a semiannual report that measures the performance of US active funds against passive peers in their respective Morningstar Categories. The Active/Passive Barometer spans over 9,200 unique funds that accounted for approximately $23 trillion in assets, or about 68% of the US fund market, at the end of 2024.
New Methodology, Similar Results
This year, we overhauled the Active/Passive Barometer benchmark by which active funds are compared. While active funds were previously tested against an equal-weighted average of their passive peers, the passive benchmark will be asset-weighted going forward.
We made this change because asset-weighting better reflects the alternatives an investor would consider when choosing between going active or passive in a specific Morningstar Category. New index funds are increasingly tracking niche strategies and making targeted bets rather than providing the broad market exposure of their predecessors. In contrast, new active funds are taking lower active risk.
We also adopted a buy-and-hold methodology for the passive composite, which better reflects the experience of real investors. The weightings of the passive benchmark are set at the start of the period, and the composite subsumes any fund closures proportionate to the starting weights to encapsulate investors’ options at the start of the period.
This methodology change led to mixed results, but long-term trends stayed mostly the same. I compared 2023’s 10-year success rates using the old and new methodologies and found that:
- Active funds in US stock categories largely saw their success rates decline year over year, while managers of foreign strategies received an uptick.
- Success rates for active high-yield and corporate bond managers flipped, with active high-yield managers gaining ground that corporate bond managers gave up.
- Overall, 10-year success rates for all active funds included in the study fell 3 basis points to 22% as a result of the methodology change.
Most Active Managers Failed to Capitalize in 2024
When viewed as a whole, active funds had less than a coin-flip’s chance of surviving and outperforming their average passive peer in 2024, although results varied widely across asset classes and categories.
Active fixed-income and real estate funds had a strong year, but their success was weighed down by foreign stock-pickers’ declining performance. That group notched a success rate of 37% in 2024, versus success rates above 60% for fixed income and real estate managers in aggregate.
Active bond funds continued their comeback from a rough 2022, improving 20 percentage points since then. Each fixed-income category included in our report saw its one-year success rate increase by 6 percentage points or more in 2024. This trend aligns with active managers’ willingness to take on more credit risk than market-value-weighted passive peers. Tightening credit spreads worked in active managers’ favor for the second year in a row, while widening spreads hurt in 2022.
Year-Over-Year Change in Active Funds' One-Year Success Rate by Category (%)
But one year isn’t a sufficient time horizon from which to draw conclusions. Success rates can fluctuate wildly from year to year, depending on what’s going on in markets.
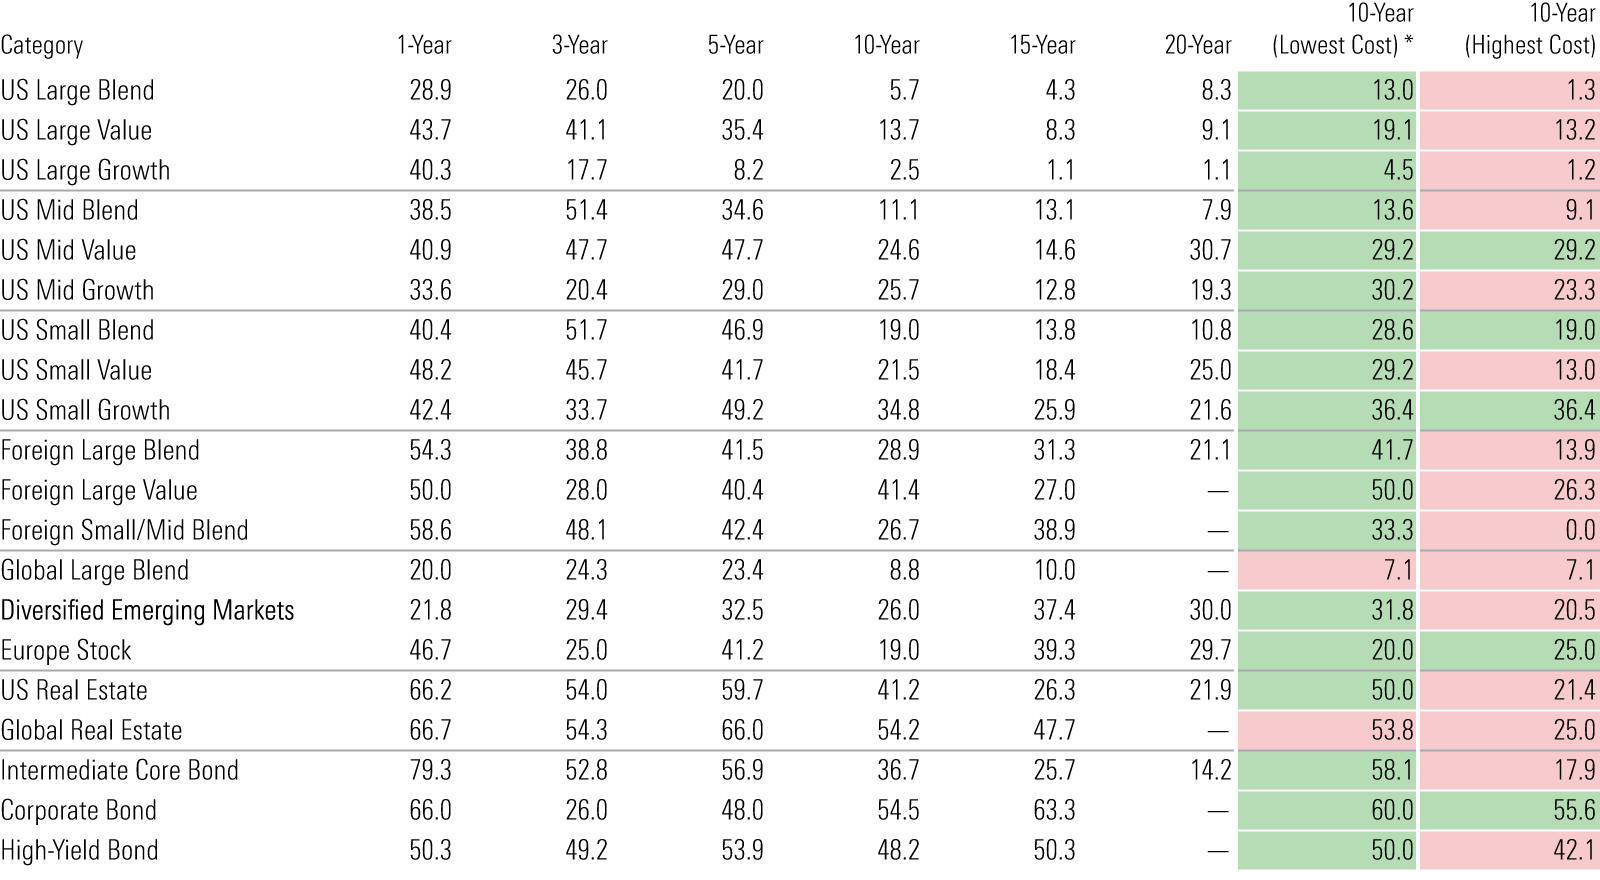
Longer horizons provide stronger signals that investors can incorporate in their selection process. In general, actively managed funds have failed to survive and beat their benchmarks, especially over longer time horizons. Less than one out of every four active funds topped the average of their passive rivals over the 10-year period ended December 2024.
But success rates vary across categories. Long-term success rates were highest among bond and real estate funds, where active management may hold the upper hand. Investors can use this data to identify areas of the market where they have better odds of picking winning active funds.
Active Funds' Success Rate by Category (%)
Sizing Relative Performance of Passive and Active Investing
Success rates alone only tell half the story. The other half is the prospective payoff for choosing a winning fund versus the penalty for picking a loser.
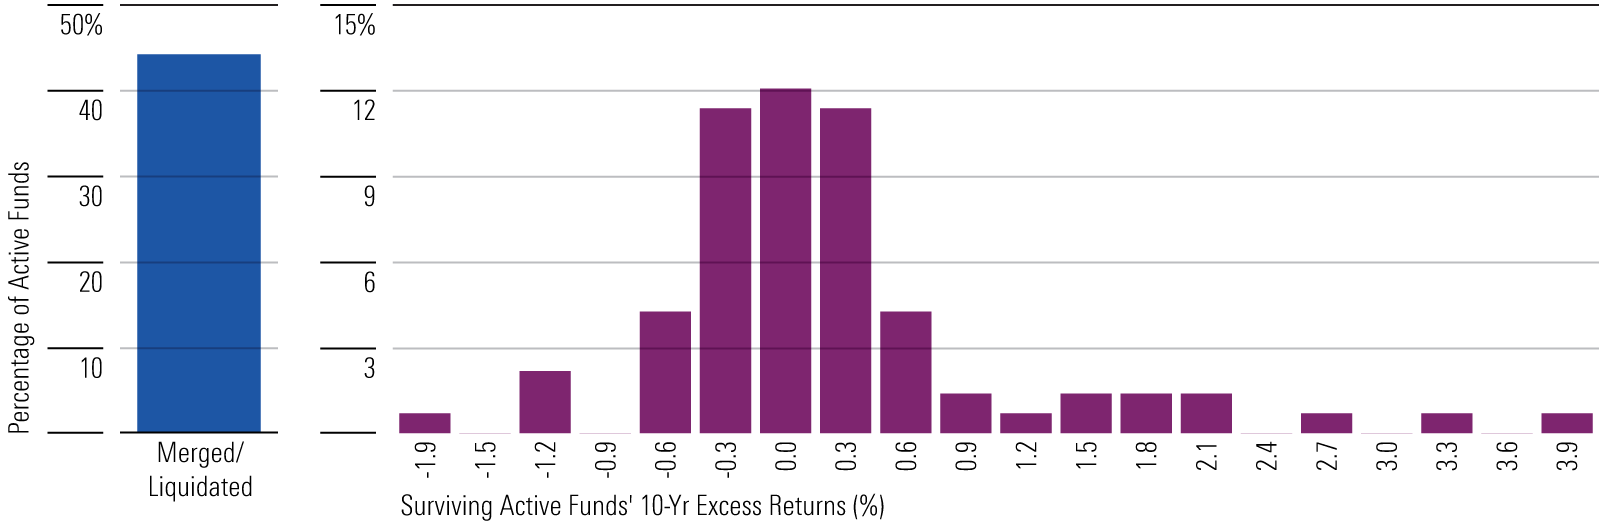
The Active/Passive Barometer plots this information in the form of the distribution of 10-year excess returns for surviving active funds versus the average of their passive peers.
Much like success rates, these distributions vary by category. In the case of US large-cap funds, the distributions skew heavily negative. This paints a bleak picture for active funds in these categories. They have low long-term success rates and penalties can be high for picking a loser.
The opposite tends to be true of fixed-income and real estate categories, where long-term success rates have generally been higher and excess returns among surviving active managers have skewed positive over the past decade. The charts below show the distributions of excess returns for surviving active funds from the large-blend and intermediate-core bond categories.
Mortality and Distribution of 10-Year Annualized Excess Returns for Surviving Active Large-Blend Funds
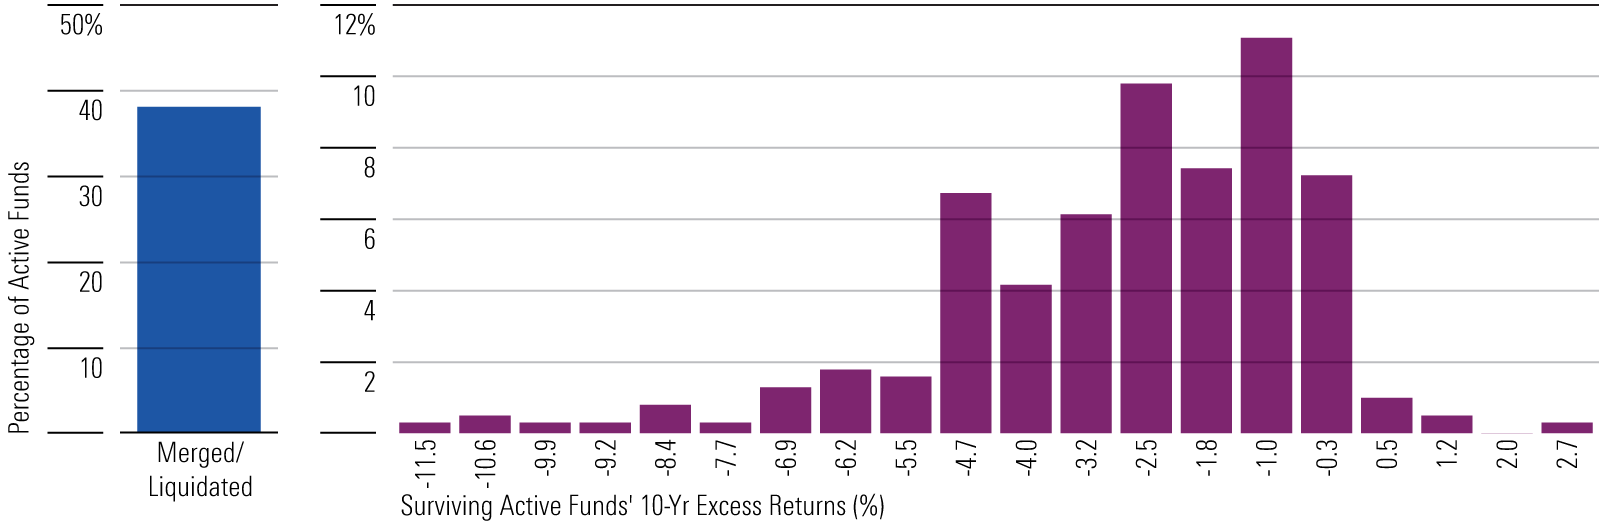
Mortality and Distribution of 10-Year Annualized Excess Returns for Surviving Active Intermediate Core Bond Funds
Costs Matter for Both Passive and Active Strategies
A signal that rings loud and clear in this dataset is that fees matter.
Funds in the cheapest quintile succeeded more often than funds in the priciest one (28% success rate versus 17%) over the 10 years through 2024.
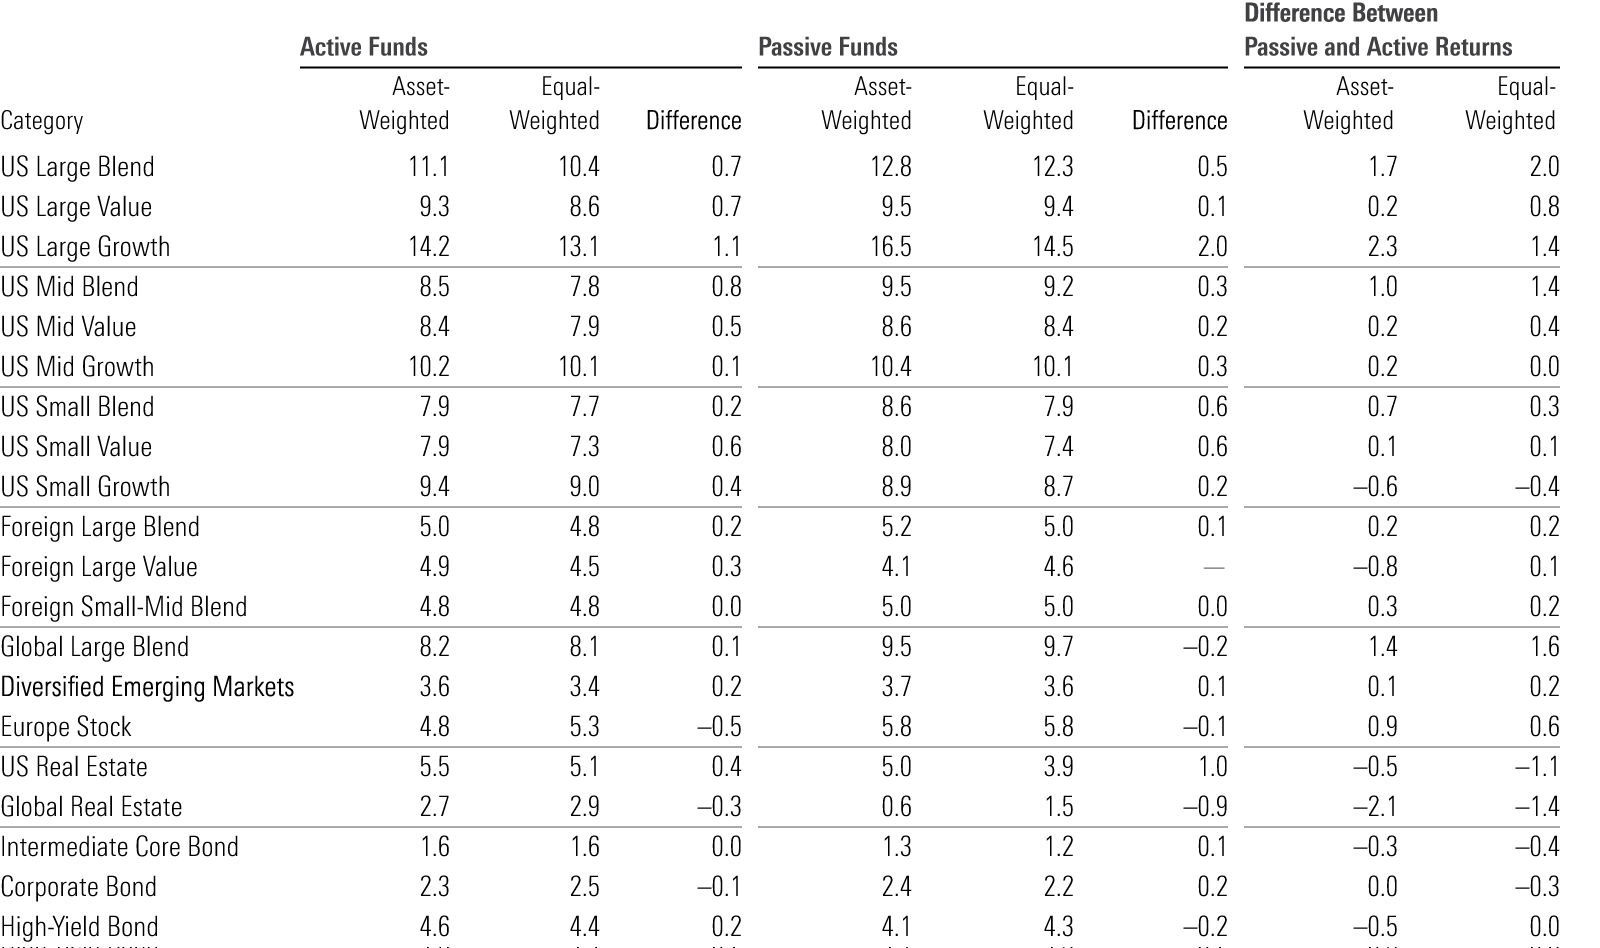
Investors have caught on to this trend. Over the past 10 years, the average dollar invested in active funds (asset-weighted average return) outperformed the average active fund (equal-weighted average return) in 16 of the 20 categories examined. That implies investors have found cheaper, higher-quality strategies.
Comparison of Asset- and Equal-Weighted 10-Year Returns (%)
The author or authors do not own shares in any securities mentioned in this article. Find out about Morningstar’s editorial policies.

 United States