
The Shifting Tides of World Growth
As U.S. growth remains relatively anemic, the rest of the world is looking slightly better.

Editors' note: Robert Johnson was traveling on Friday, but the 2.6% growth in GDP for the second quarter was in line with his expectations and recent trends.
This week's economic releases were consistent with recent trends and were, on balance, slightly more positive than expectations. New-home sales, wholesale and retail inventories, durable goods, and net export data were all more positive than expected.
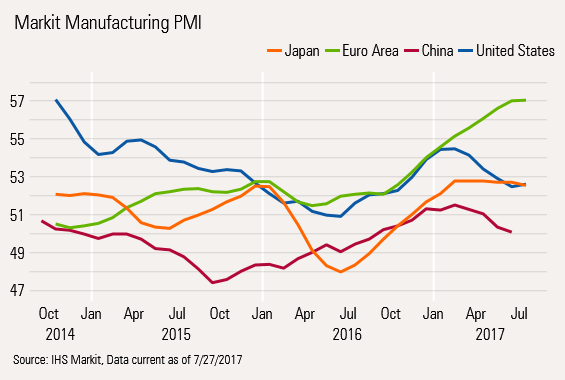
World purchasing manager data was relatively neutral, with relatively high readings maintained but not showing much acceleration. Consistent with recent results, Europe's manufacturing reading remained considerably better than those in the U.S. and Japan.
The only real disappointment for the week was existing-home sales, which were down month to month, as low inventories and high prices continued to weigh on sales.
Rolled together, the key takeaway is that U.S. growth remains relatively anemic while the rest of the world does slightly better. In fact, U.S. growth would look modestly worse if not for rising exports and basically flat imports.
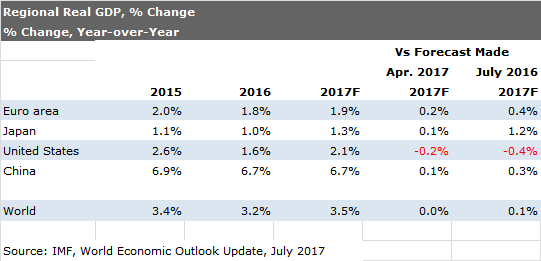
The IMF agreed with our assessment this week, reducing the U.S. GDP growth forecast from 2.3% to 2.1%, while raising Europe's growth rate for 2017 from 1.7% to 1.9%. Even China's growth forecast was raised modestly from 6.6% to 6.7%. Overall, the world GDP growth rate was left unchanged at 3.5%, which is higher than the 3.2% reading recorded in 2016.
The relatively anemic U.S. growth is not because anything is falling apart, but because demographic and labor shortages continue to press on growth rates. Perhaps this is most apparent in the housing sector. Plagued with labor shortages (along with lack of well-located land), it could be doing noticeably better with more skilled construction workers.
IMF Leaves World Growth Forecast Unchanged at 3.5% for 2017 In its quarterly economic forecast the IMF left its GDP growth forecasts for 2017 and 2018 at 3.5% and 3.6%, respectively, compared with 3.2% in 2016. The better forecast is the result of a combination of better reported economic performance in the first half, improved trade data, and higher commodity prices (which will boost some emerging-markets economies, such as Russia and Brazil).
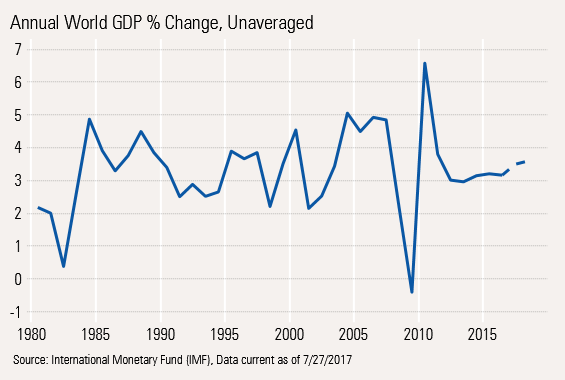
After a nice bounce following a worse-than-typical recession, world growth has struggled to get back to long-term averages. Demographics (slower population growth as well as an aging population) seem to be limiting growth not only in the U.S., but also around the world.
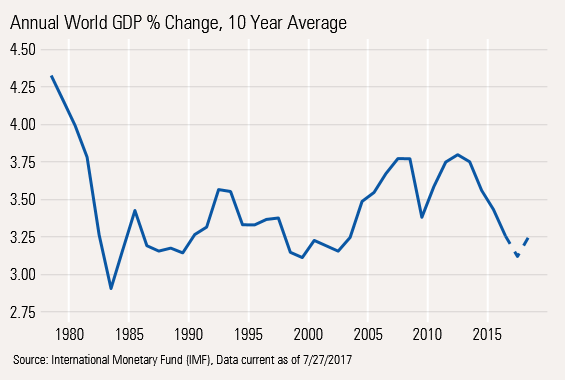
Even 10-Year Averaged Data Doesn't Look Much Better On a 10-year averaged basis, growth was generally on a downward track since the baby boomers reached maturity in the 1960s and 1970s. World growth stepped out of its rut in the late 1990s and early 2000s as China's growth accelerated with new government policies.
Not only did China grow rapidly but it represented an increasingly large portion of GDP. China's large demand for raw materials also stimulated the economies of a lot of other emerging-markets countries. However, as China's growth slowed and became less commodity focused, world economic activity entered another languid growth phase in 2011.
Mix of Regional Growth Rates Undergoing a Shift Since its last update in April, the IMF has increased its growth rate expectations for Europe, Japan, and China, while it reduced its forecast for the United States. This mainly reflects reported first-half growth that was stronger than the IMF had been forecasting, except in the United States.
It noted the completion of elections in most of the developed world and put to rest some of the uncertainty that had so spooked the IMF earlier. However, it mentioned that some of the election uncertainty has been replaced by worries about if (or when) new stimulus and other policy changes would be implemented in the United States.
The shifts in regional expectations are even more dramatic when compared with the IMF of July 2016. In fairness, that forecast was produced just after the Brexit vote. The IMF slammed its growth rates for Europe itself and a lot of its trading partners, while boosting its growth rates for the U.S., which appeared well on the way to electing Hillary Clinton.
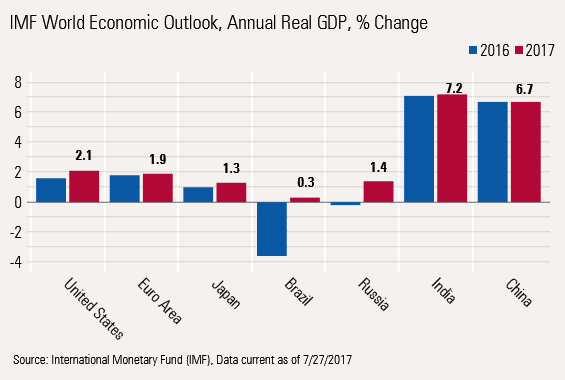
Commodity Producers, Including Brazil and Russia, Are Expected to Do Better in 2017 As world growth picked up (except in the U.S.) and OPEC demonstrated some production discipline, commodities began to act at least a little better, which has improved growth in commodity-related economies, primarily emerging-markets economies.
World PMI Data Showing Similar Improving and Shifting Growth Trends It is not just the IMF data that is showing a generally improving world economy and shifting regional growth trends. Flash purchasing manager data from Markit demonstrated very similar trends. PMI data bottomed around the world in July 2016. Since then, Europe has shown the most improvement and the U.S is not growing as fast as it was at the beginning of the year. Chinese data still looks a bit soft, but we won't have Chinese data for another week. We note that Chinese and U.S. data are still up from year-ago levels, though are not as strong as they were earlier in the year.
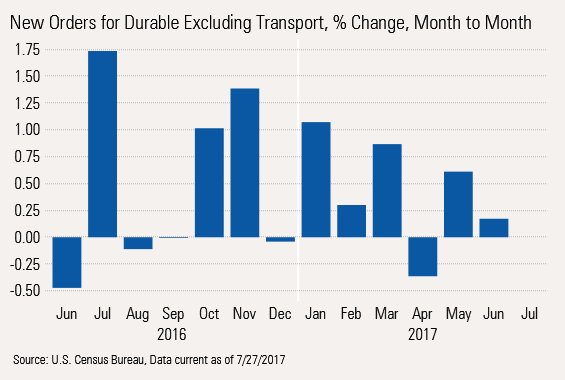
U.S. Durable Goods Orders Indicate Participation in World Trade/Manufacturing Rebound While the Markit data for the U.S. is not robust, we note that in this week's durable goods report, new durable goods orders, excluding the volatile transportation sector, have been up in five of the past six months. We have found the new orders report a more reliable predictor of production activity than either of the two major purchasing manager reports.
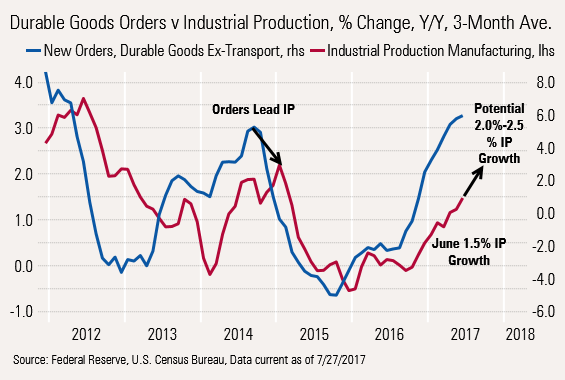
New Orders Seem to Indicate More Potential Increases in Industrial Production New-order growth for durable goods is now well over 6% on an averaged, year-over-year basis. The last time durable goods order growth hit 6%, industrial production was over 2%. With new-order growth now above 6%, we suspect that industrial production growth, currently at 1.5%, has the potential to move to 2.5% growth over the next several months.
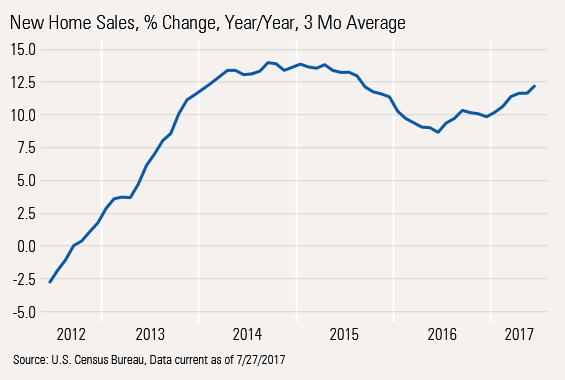
New-Home Sales Up Five of the Past Six Months New-home sales increased again June, maintaining its general upward trend. Respectable inventory levels, improving incomes, demographics, and more emphasis on lower-priced homes have kept sales from sagging like existing-home sales have.
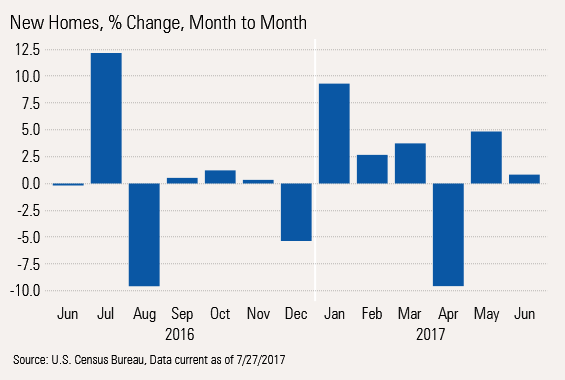
Year-Over-Year, Average New-Home Data Remains Remarkably Stable On a year-over-year basis, we are incredibly impressed with the very narrow range of new-home growth, with perhaps some slight improvement in recent months. New-home sales are increasing at a 12.5% annual rate. Unfortunately, given labor issues and higher prices, we aren't sure new-home sales growth can accelerate from here. Rising lumber costs won't help matters, either.
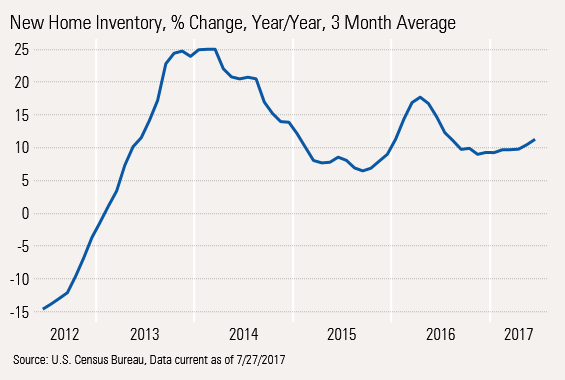
Inventories Remain in Goldilocks Territory: Not too Hot and Not too Cold Inventories have been a huge issue for existing-home sales. Homebuilders have stepped up their building rates so that inventory growth rates are very, very close to current sales growth rates. That is extremely healthy.
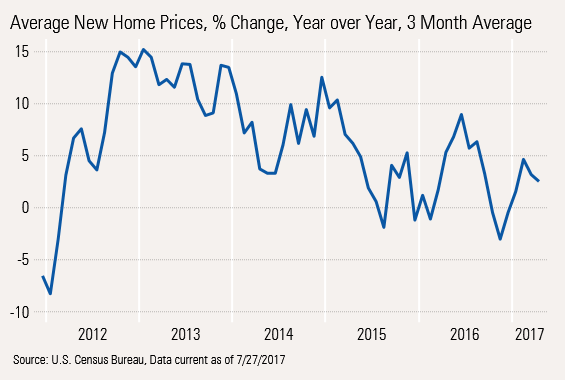
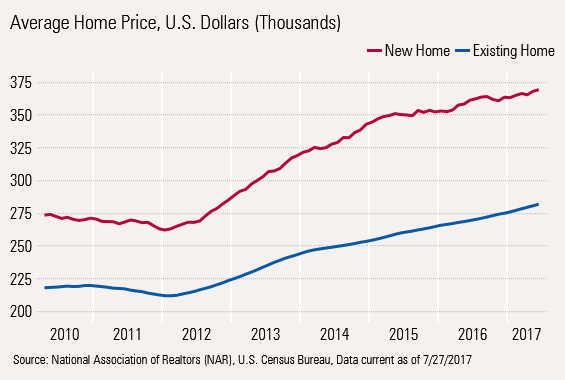
New-Home Prices Drop Because of Mix Shift Part of the reason for stronger unit growth is a shift to more lower-priced homes. With average prices up only 3%, and construction price inflation running over 5%, the homes being built are clearly smaller or less featured.
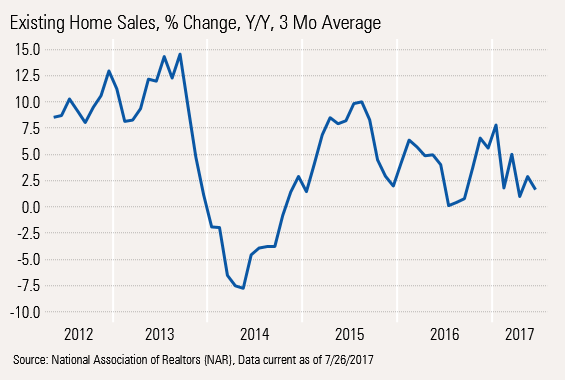
Existing-Home Sales Data Disappoints, Again Monthly existing-home sales were down again between May and June and have been down three of the past five months, almost the reverse of what is happening in the new-home market.
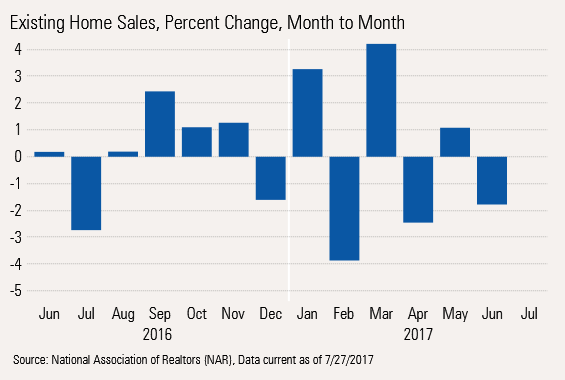
Even the Year-Over-Year Trend Is Faltering To put the monthly data in some perspective, year-over-year unit existing-home sales are up a measly 2.5% compared with the 12.5% growth we saw in the tract home market.
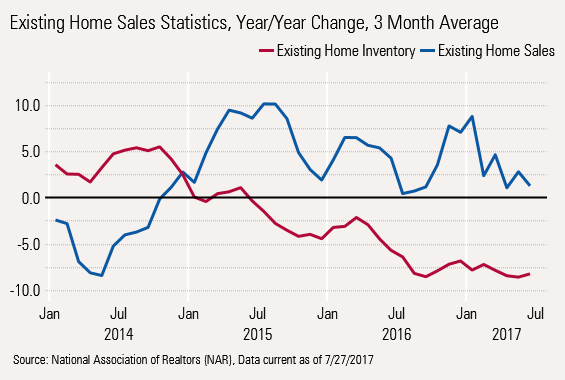
Low Inventories Remain the Heart of the Problem The graph below compares year-over-year existing home inventory growth rates and existing home sales growth rates. Slowing inventory growth rates and eventually outright inventory declines have slowly but surely tugged down the growth rate in existing home unit sales rates. Though faster closings and selling cycles delayed the inevitable deceleration in sales, the long-term impact of inventory levels is clear.
Exactly why those inventory levels have fallen is a confluence of many factors. Those include demographics, which limits the number of people leaving their homes every year (via death or new living arrangement). A vicious circle pattern is also at work. Since finding a new trade up home is so difficult, and such a hassle, potential sellers are reluctant to put their homes on the market. So, potential sellers aren’t putting their homes on the market because there is nothing to buy. Furthermore, there is also generally less population mobility, and job mobility in particular, which limits the number of forced sellers. That is, those forced to sell their homes to take a better job in another location.
Existing-Homes Still Struggling Despite a Widening Price Gap With New Homes Despite the gap between new and existing-home pricing, existing-home sales can't seem to catch a break.
/cloudfront-us-east-1.images.arcpublishing.com/morningstar/GJMQNPFPOFHUHHT3UABTAMBTZM.png)
/cloudfront-us-east-1.images.arcpublishing.com/morningstar/ZYJVMA34ANHZZDT5KOPPUVFLPE.png)
/cloudfront-us-east-1.images.arcpublishing.com/morningstar/LDGHWJAL2NFZJBVDHSFFNEULHE.jpg)