
Which Has It Right, the Stock Market or the Bond Market?
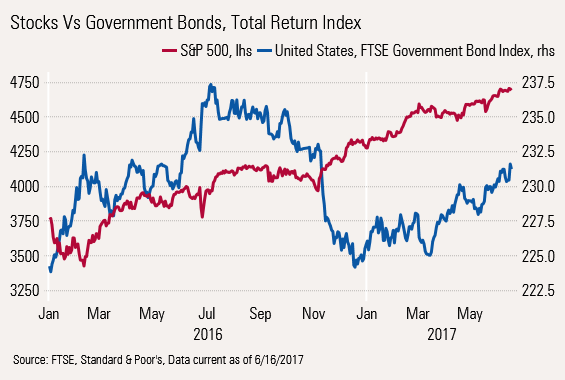
Since the beginning of the year, bonds have risen at the same time that equities have continued to gain.

Immediately after the election, U.S. government bonds got crushed. Meanwhile, stocks rallied as both asset classes reacted to the potential for higher growth and higher inflation. However, since the beginning of the year, bonds have risen and interest rates declined; at the same time, equities continued to gain, a highly unusual state of affairs. Since the beginning of the year, government bonds are up about 2.5% and U.S. equities are up almost 10%. It would appear that equities are anticipating improving economic and profit growth while the bond market is fearing the worst.
This week's economic data could support either conclusion. Month-to-month data continued to look terrible across the board. Falling industrial production, another bout of deflation, declining housing permits, and falling retail sales all turned up in this week's data, topping off anemic employment numbers, motor vehicle data, and construction statistics. Year-over-year, averaged data was much more benign, not showing much change from previous levels of modest but uninspiring growth.
We have been warning for the past year and reiterated in last week's column that key growth sectors of the economy had been quietly eroding. Also, the demographics of a smaller working-age population and a higher percentage of low-spending, recently retired baby boomers would provide some fierce headwinds for growth.
The hope is that at least modest wage growth, high consumer asset levels, and improved business capital spending will keep things afloat, but the possibility of a downside, external shock upsetting the apple cart is increasing day by day. And there are plenty of potentials out there, including North Korea, another downside oil shock, Washington politics and investigations, and a potential budget stand-off, to mention just a few of the risks.
Our GDP forecast remains modest and unchanged for the full year at 1.75%-2.0%, behind the U.S. Federal Reserve's new, just-raised forecast of 2.1% growth. We had modest expectations for a second-quarter bounce in GDP to 2.5%-3.0%. That was lunatic-fringe negative just a month ago, but the GDPNow mechanical forecast has dropped from over 4% to just 2.9% on Friday.
This week we are focusing our text on the Fed announcement and changes in inflation. There was a lot of other very important data this week including housing permits, retail sales, and industrial production. We cover those topics with just brief commentary and our usual graphs.
However, we are reducing our inflation outlook (Consumer Price Index), fourth quarter to fourth quarter, from a range of 2.0%-2.2% to a new range of 1.8%-2.0%. Mechanically, falling gasoline prices and a collapse in the calculated cost of cellphone service is behind our new, lower forecast. The cellphone adjustment took almost 0.2% off our year-over-year forecast. Our new forecast assumes that gasoline prices will be little changed for the rest of the year. If gasoline prices fall further, we will need to revisit this forecast.
Our first forecast for CPI-W for the third quarter suggests that Social Security payments will go up 1.8%-2.0% in 2018, better than last year's 0.4% but not as strong as we might have expected given two years of almost no increases. However, these are very preliminary estimates and could still swing significantly.
Stock and Bond Markets Disagree, and That Could Put the Fed in a Pickle The Fed did raise the short-term federal-funds rate for the second time this year at its June meeting and the third time in seven months. Because of all the public posturing and positioning for this rate increase, it couldn't really back away from an increase despite a bevy of weaker economic indicators.
We wonder if it really believes that all the poor economic data is transitory, or if it just didn't want to spook the markets. If it had it to do over, I suspect it wishes it could have started working on deleveraging the Fed balance sheet at this meeting and put off the short-term interest rate increase until later. By increasing the short-term rate and the fact that the market determined long-term rates created a problem the Fed was trying to avoid. A low spread between short and long-term rates discourages bank lending and hurts bank profits. This low spread is also viewed by many as an indicator of a shrinking economy.
Despite the two interest rate increases this year, the rate on 10-year Treasuries has fallen from 2.6% at year-end to 2.2%. The Fed has also announced that sometime this year it will stop reinvesting every dime of maturing long-term bonds that it owns. At first, that could amount to as little as $10 billion a month with a long-term goal of reducing reinvestment by $50 billion a month (or $600 billion a year), which would make a very serious dent in the Fed's current $4 trillion-plus portfolio over a five-year period.
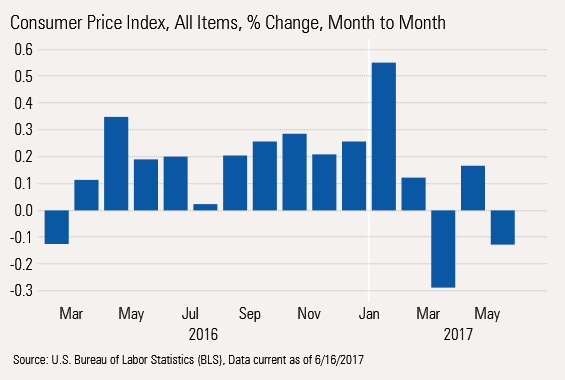
Consumer Prices Down Two of the Past Three Months A lot of the commentary surrounding the release of the CPI for May focused on the month-to-month data and the fact that headline inflation was indeed down for two of the past three months. It has not increased at an annualized rate of 2%, the Fed's target, for four consecutive months. There are a lot of quirky factors in the monthly data, but the fact that this low inflation rate has persisted for four months is at least a little troublesome.
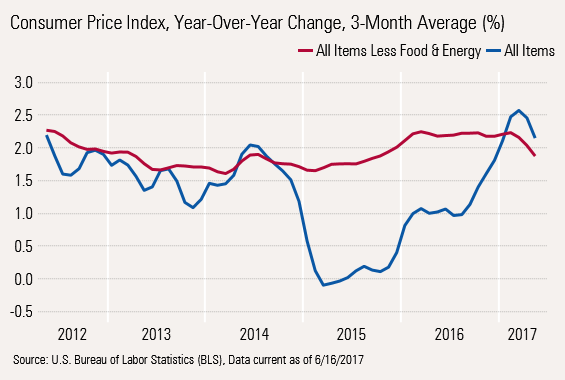
Even Year-Over-Year Inflation Rates Are Slowing Based on our preferred year-over-year averaged data on both core (excluding food and energy) and headline (all items), inflation has slowed. Looking at single-month data and the prospect of flat to down energy prices both three-month averages could fall further. Plus, the huge gap between core and headline inflation has largely closed. As we noted in our introduction, we suspect that three-month averaged inflation could fall from 2.6% this spring to 1.8%-2.0% by December.
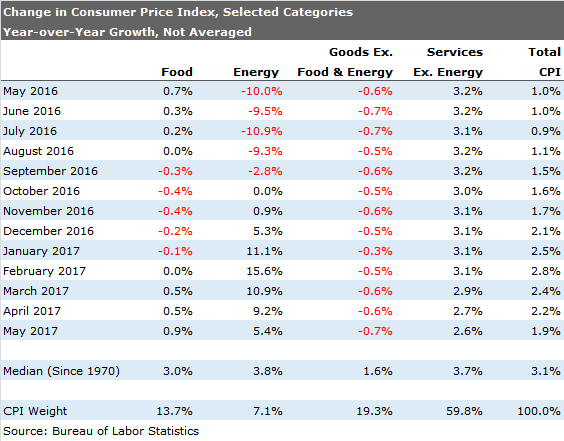
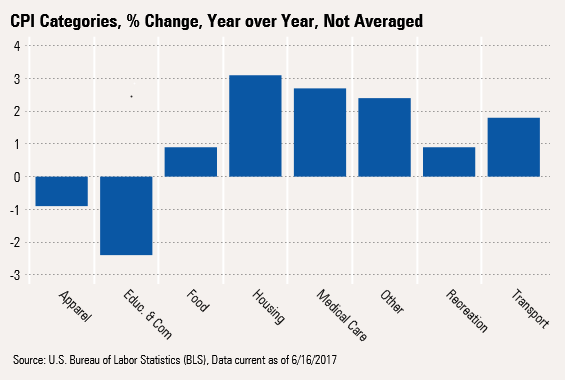
Broad Category Inflation Data Shifting By major category, on a single-month basis, the key drivers are slowly shifting. Food prices, while no longer falling, aren't likely to go on a rampage, either, given abundant inventories and satisfactory weather conditions. Of course, that can all change with a few poorly timed thunderstorms.
Some of the wilder swings in energy prices also appear to be behind us, though gasoline price increases will likely accelerate a bit this summer even if prices stay at current levels. That is because gasoline prices collapsed last summer.
Offsetting higher year-over-year gasoline prices will the lapping of a large spike in natural gas prices last summer and fall. Natural gas price increases will likely fall sharply from the 10%-15% increases that have been the norm recently.
Pressure on physical goods remains intense, with a still relatively strong dollar and poor demand. More recently, used cars and new cars have begun to weigh heavily on this category, precipitated by a huge acceleration in the number of vehicles that are coming off lease. Unfortunately, the problem will worsen over the next year.
The fall in services prices is probably the biggest surprise in the data, falling from 3.2% last May to 2.6%, the opposite of what we had expected. As we have discussed in previous columns (and even mentioned by Janet Yellen in her press conference), 0.2% of the decrease was because of the artificial fall of cellphone service prices (more data, some monthly billing rate). The calculated price drop was so sudden that cellphones will have an impact on year-over-year inflation data through next spring. (Cellphone prices dropped about 12.5% this spring and account for 1.5% of the CPI calculation.)
Faulty seasonal factors also kept the price of some healthcare services down. That is likely to correct itself in a single month when we are all least expecting it. Doctors' bills were up less than 1% year over year in May even as hospital bills were up 5%.
Gasoline Continues to Have an Outsize Impact on Inflation We mentioned earlier that gasoline had been doing funky things to the CPI for some time, while things other than gasoline have been remarkably stable, even on a year-over-year single-month basis. That nongasoline rate has ranged from 1.7% to 2.0%. The large drop in cellphone service prices pushed the nongasoline number down this spring.
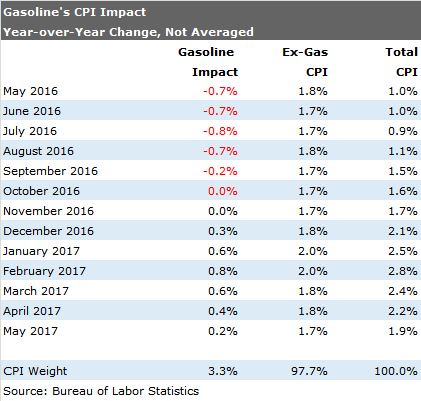
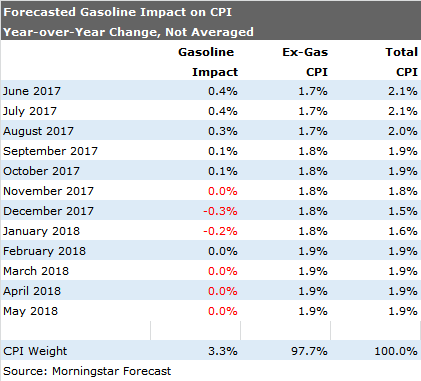
Combination of Gasoline and Falling Cellphone Service Prices Force Us to Reduce Our Inflation Outlook We constructed our current inflation outlook by adding together a gasoline and nongasoline forecast. We assumed that seasonally adjusted gasoline prices go up 3% over the summer then remain unchanged though next summer. We assume that the nongasoline-related CPI increases at the same rate as in May but increases a bit as doctors' bills resume their more normal trajectory and food prices go up a little. Then in 2018 the big cellphone price decline drops out of the data. Single-month inflation for December could get as low as 1.5%.
Still, Inflation Isn't Dead Yet as Labor-Dependent Categories Rise We caution that housing and medical-related expenses continue to run high and that the lowest of the food prices may be behind us. Also, a lot of labor-intensive categories continued to show significant increases. Repair services, private lessons and instruction, hospitals, lawn services, tax prep, legal fees, and cable services were all up in the 3%-6% range.
Inflation and Wage Growth Both Falling, Still Leaving Consumers in a Bad Place We have spoken a lot about consumers losing ground over the past year as wages continued to increase near recent averages while we have moved from deflation to inflation. For a brief moment this spring the gap almost disappeared. With this month's deflation report, the gap has widened just a little. But I am afraid that only heavy cellphone users will see much of that benefit.
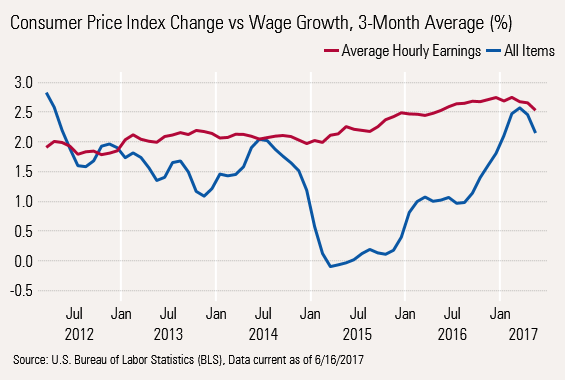
Subtracting the wage growth from the CPI growth, real wage growth has steadily fallen this year with a small reprieve provided by the telephone companies.
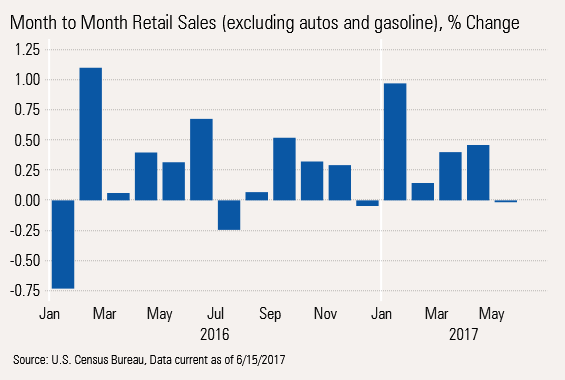
Net, Real Hourly Wages Are Still Anemic As we have shown in the past, real wage growth in 2015 was a real boon to retail sales. Now as real wage growth has slowed, retail sales growth has suffered some of the collateral damage.
Retail Sales Disappoint, Though Deflation Distorts the Data
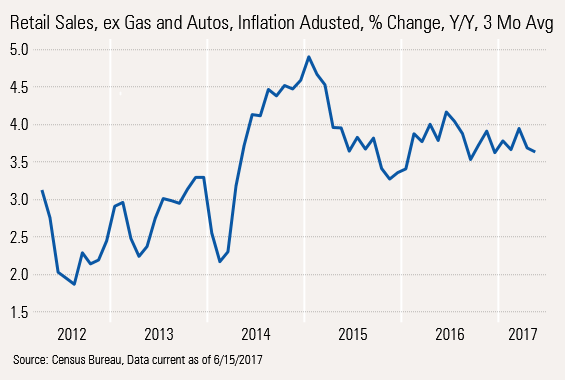
The Year-Over-Year Retail Data Stagnates at a Mediocre Level
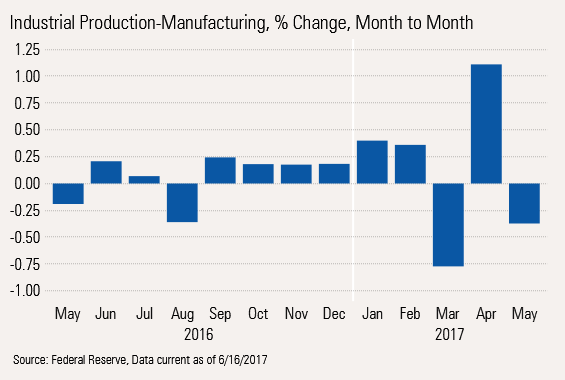
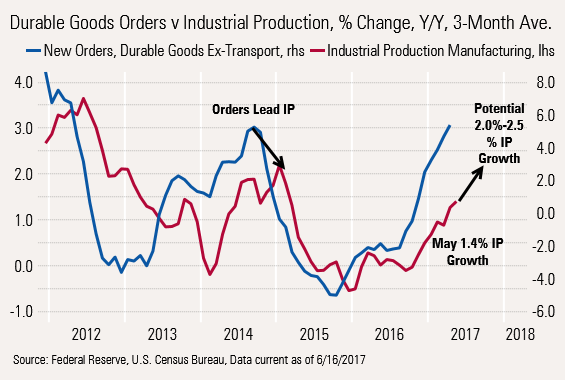
Manufacturing Doing Better, Despite Sloppy May Reading
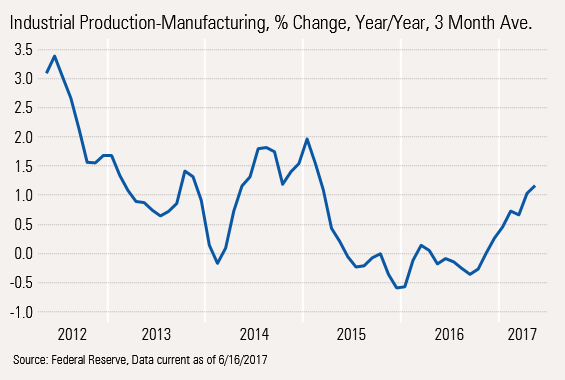
Year-Over-Year Production Data Is Improving
And Even More Improvement Is Possible, Based on Order Data
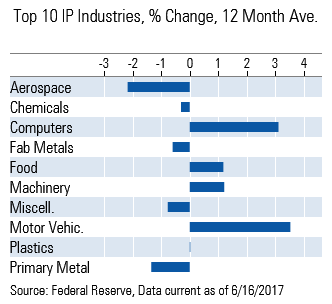
Though Category Data Still Suggests Lopsided Manufacturing Results
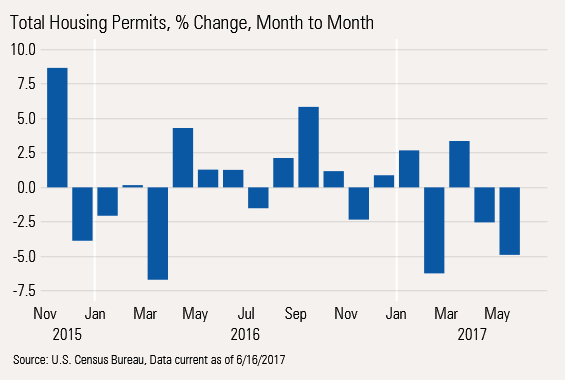
Housing Permits Data Suggest Housing Is OK for Now, Despite May Slip
Year-Over-Year Data Still in Acceptable Range ...
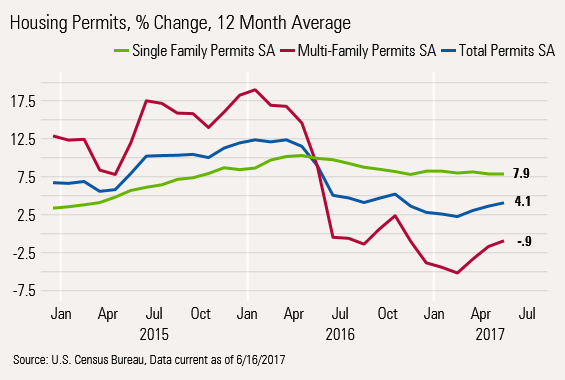
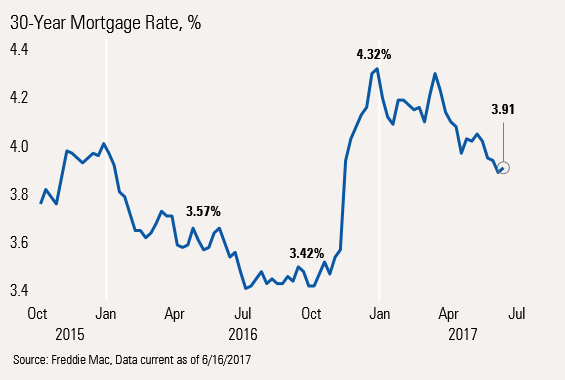
... And Lower Mortgage Rates Provide a Reason for Hope
/cloudfront-us-east-1.images.arcpublishing.com/morningstar/GJMQNPFPOFHUHHT3UABTAMBTZM.png)
/cloudfront-us-east-1.images.arcpublishing.com/morningstar/ZYJVMA34ANHZZDT5KOPPUVFLPE.png)
/cloudfront-us-east-1.images.arcpublishing.com/morningstar/LDGHWJAL2NFZJBVDHSFFNEULHE.jpg)