
Is the End of Recovery Nearer Than Believed?
Sector-level economic data suggests U.S. growth is less than robust, says Morningstar’s Bob Johnson.

We were out of the office traveling for most of the week. Fortunately, the amount of economic data was extremely limited. The Job Openings and Labor Turnover report was the only U.S. item of much consequence this week. That report suggested that slow employment growth is more likely the result of a lack of workers and very discouraged employers rather than a lack of jobs. Please see our video here.
The Year of the Discouraged Employer Our fears, not entirely substantiated, suggest that in a world where it is hard to increase prices, at least some employers are reluctant to boost wages to attract new workers because of the potential impact on their cost structures. Furthermore, this raises nasty human-resource conundrums about what to do about the wages of those already employed. I believe that in their situation of high uncertainty and limited ability to raise prices, at least some businesses are offering substandard wages and willingly accepting the lower growth and higher turnover they might engender. For now, that's just an unproven thesis.
Microeconomic Sector Data Suggests U.S. Economic Growth Less Than Robust With little current data to write about, we decided to review some of our slowing economic sectors that were key drivers to this recovery. Frankly, industry-specific slowdowns combined with exceptionally low unemployment levels suggest that we may be closer to the end of this economic cycle than many believe. Without more workers, sustaining economic growth may prove difficult. While we spend a lot of time discussing macroeconomics such as interest rates and fiscal stimulus, microeconomic issues often get short shrift.
In conjunction with our year-end 2016 economic package, we began to publish a graph that showed how some of the key economic drivers of this recovery were beginning to fade. Six months later, that fading process has yet to reverse itself, with the possible exception of oil and gas.
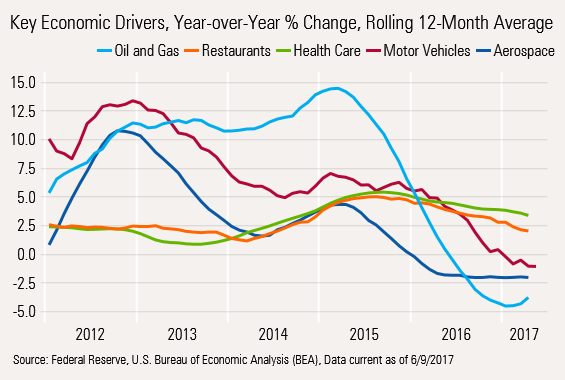
Motor Vehicles, Housing Normally Kick-Start Economic Recovery As you might recall, most recoveries feature big, bold rebounds in auto and housing due to lower interest rates. Growth in these two labor-intensive sectors, where consumers can leverage their purchases, helps raise overall levels of economic activity and acts to jump-start economic activity in other sectors.
During this recovery, tight mortgage credit has caused a slower (but perhaps longer) recovery for the housing sector. Motor vehicle credit, because of a better delinquency track record compared with mortgages, has flowed much more easily, leading to a more typical auto recovery.
This Recovery Had Different Early Drivers
Still, this recovery was based on the dynamics of a number of sectors not normally thought of as key economic drivers. Specifically, a huge ramp-up at
New Oil, Gas Technologies Were Big Help This Time Also, the revolution in technologies enabling more U.S. production of oil and gas, which previously experienced more than two decades of production declines, was a new dynamic for the economy. While the graph above features oil and gas production levels, the spending on the equipment and materials to produce that oil was even more dramatic and began even earlier.
Motor Vehicle Recovery More Dynamic, Favoring North American Producers We mentioned that motor vehicles had their normal recovery bounce. However, even that recovery was bigger and more dynamic than the unit data above might suggest. Because of U.S. tariffs on light trucks (which include minivans, SUVs, and pickups), more of the U.S. sales went to U.S. producers. And light trucks are substantially more expensive than sedans (mid-$20s for a sedan, mid-$30s for a light truck overall, and mid-$40s for a pickup).
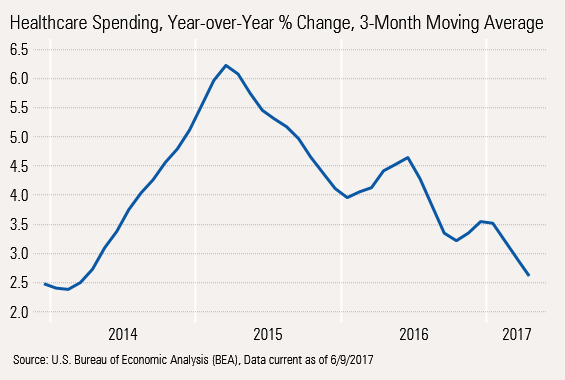
Normal Stalwarts Healthcare, Restaurant Sales Have Larger-Than-Normal Midcycle Bounce The combination of an aging population, new technologies, and industry pricing power has generally made healthcare an important contributor to economic growth, especially as government programs to pay for healthcare have been expanding for more than 50 years. Healthcare growth got an extra shot as the Affordable Care Act extended Medicare to an additional 15 million, with most of those recipients added between 2014 and 2016. We believe spending by these additional participants caused the big bounce (big by healthcare standards, anyhow) from less than 2% growth to more than 5%.
Restaurant Sales Unusually Strong Later in This Recovery Many things can change the dynamics of restaurant spending. However, we think employment growth is probably one of the main factors. Recall that improved investment spending (airplanes, shale oil production equipment) drove a lot of the early recovery, and that employment growth healed a bit later than normal. Restaurant sales were quite good albeit not stupendous early in the recovery. Demographics of more young workers certainly helped. However, the acceleration in employment growth after 2012 and wage growth after 2014 helped jump-start restaurant sales. Lower-cost restaurant space, resulting from the closure of a lot of big-box stores, also fueled the supply side of the equation.
Almost Every One of These Key Drivers Has Petered Out; Fortunately, Not All at Once Automobile and aerospace growth rates peaked in late 2012. Fortunately, this was about the same time that healthcare and restaurant sales began to move out of their periods of more-staid-than-normal growth. And in 2014 there was another spike in oil and gas production, helping maintain overall economic growth rates. However, by early 2015, all five of what we viewed as the major growth drivers were in retreat.
On this graph, we have narrowed the time range and changed to a more sensitive three-month average to highlight the peaks.
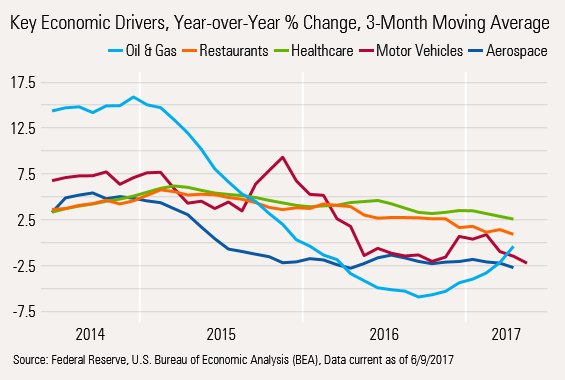
Each sector peak has its own story. The oil and gas industry, after years of investment spending, produced a boom in production that turned into a glut. In return, prices and industry profitability fell, which caused less investment spending and the shutting down of some of the least profitable drilling sites. That decreased investment and the shut-ins caused the light blue line above to dip briefly into negative territory.
With last year's OPEC production curtailment, prices and production were back in positive territory, although a much bigger base of production and stodgy demand are likely to mean overall oil and gas production will never get to half of its old high of over 15% (as measured by the Federal Reserve's Industrial Production report). Achieving just half of the prior high could prove to be a major challenge.
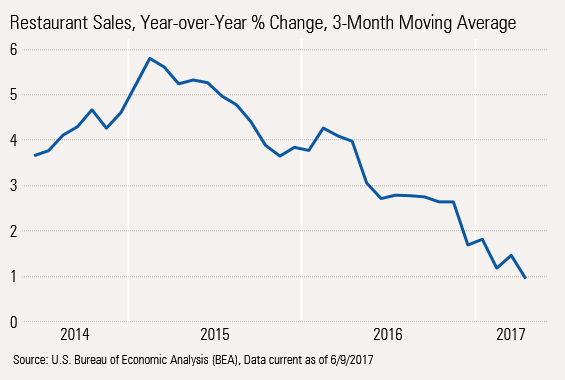
Slower Employment Growth, Higher Wages, Higher Menu Prices Hurt Restaurants Restaurant sales are also experiencing some headwinds. The trends we discuss in this column have caused economic growth to sputter a bit, and employment growth has slowed dramatically (from 2.1% to 1.5%), which also doesn't do wonders for restaurateurs.
Furthermore, in one of the most unexpected trends of 2016 and early 2017, grocery store prices collapsed, led by a dramatic fall in beef prices. At the same time, prices of restaurant meals were increasing by 3%, driven by increased wage expenses caused by higher minimum wages and tighter labor markets. That combination of cheaper groceries and higher restaurant prices has caused restaurant sales to slow from almost 5% to a measly 1% on an inflation-adjusted basis.
Medicaid Healthcare Bubble Over, Even Before Potential Repeal of Affordable Care Act Healthcare spending, which was already doing quite well, got a real boost from the 15 million-person increase in Medicaid recipients as a result of the Affordable Care Act. That increase had most of its positive impact in the two-year period eligibility was expanded. From early 2014, when eligibility was expanded, growth soared from 2.5% to almost 6%. However, the mouse-through-the-python flow of enrollees has ended, and most newly eligible enrollees are signed up, so growth is returning to more "normal" levels.
Perhaps this should serve as a cautionary tale: New government spending can provide a blip to growth, but in most cases those high initial growth rates are hard to sustain.
Auto Industry Faces Saturation, Shifting Consumer Tastes, Inventory Issues Auto industry dynamics formed the basis of an above-average recovery immediately after the recession. Manufacturers were able to lower cost structures dramatically during the recession because of labor concessions and bankruptcies. Easy credit compared with many other sectors and aging fleets of cars all helped demand. Then, lower fuel costs and a shift to highly profitable light trucks provided a secondary boomlet for motor vehicles.
However, the industry is now back to previous high sales rates, cars continue to last longer, and city dwellers have more options for transportation (think Uber and Zipcar). Sales are plateauing if not in outright decline. Morningstar auto analyst David Whiston was a bit lonely when he was projecting down motor vehicle sales earlier this year. Now most industry analysts have joined him in thinking that auto sales would dip from 17.54 million units in 2016 to 17 million-17.5 million in 2017. In fact, even some of the more normally rosy trade rags were whispering about a potentially lower-than-17-million-unit level for 2017. Certainly no disaster, but no longer much of a source of growth.
Sources of Potential Growth--Aside From New Government Stimulus--Are Not Apparent Admittedly, we cherry-picked items to talk about as they were the categories we have featured in our columns during the recovery. However, what will replace these items is not entirely clear.
Certainly, the shift to grocers from restaurants is helping the food production industry. Believe it or not, the food industry is the largest "manufacturing" industry in the United States at close to 15% of the manufacturing sector. In terms of production, the food industry has seen a bump to 3% growth. Over a long period of time, that number has never been much higher than 1%. Unfortunately, the restaurant industry employs 11.7 million workers, while just 1.6 million work in food-related manufacturing.
Technology-related consumption and production are also bright spots. Unfortunately, this is a small sector, with about 1 million tech-related manufacturing jobs. And even as tech production pushes above 4%, we note that tech employment is down year over year. We love the higher productivity, but better results won't necessarily help overall employment and put more dollars in consumers' pockets.
/cloudfront-us-east-1.images.arcpublishing.com/morningstar/T5MECJUE65CADONYJ7GARN2A3E.jpeg)
/cloudfront-us-east-1.images.arcpublishing.com/morningstar/VUWQI723Q5E43P5QRTRHGLJ7TI.png)
/d10o6nnig0wrdw.cloudfront.net/04-22-2024/t_ffc6e675543a4913a5312be02f5c571a_name_file_960x540_1600_v4_.jpg)