
Upward GDP Revision Shouldn't Raise Investor Hopes
A revision in first-quarter GDP from pathetic growth to merely bad is no sign that the economy is picking up steam.

The GDP report for the first quarter was revised upward from a meager 0.7% to a merely soft 1.2% this week. The good news is that the higher growth rate will make it mathematically easier to hit our 1.75%-2.0% growth forecast for 2017.
But the widely anticipated rebound in the second quarter might be smaller than previously believed. GDPNow from the Atlanta Fed used a combination of trend line and recently released actual data to predict GDP growth of a whopping 3.7% for the second quarter. Still, that is down from last week's 4.3% forecast and is likely to fall further with the release of motor vehicle sales (which are likely to be flat between April and May) and next week's consumption report. We are sticking with our second-quarter forecast of 2.5%-3.0% sequential annualized growth and 1.75%-2.0% for the full year, both lower than consensus estimates.
Just like last week, this week housing- and manufacturing dominated U.S. economic reports. And just like last week, the data was mixed, with month-to-month data looking rather dour while year-over-year data didn't show much change in generally slow-moving trends. Housing will continue to do relatively well (growth in the 8%-10% range for real residential investment). However, it will still be hard-pressed to contribute any more to GDP growth than it did last year, with slowing existing-home sales and apartment construction.
Following last week's strong month-to-month industrial production report, a soft durable goods orders report for April splashed at least a little cold water on last week's strong-looking industrial production report. We speculated last week that the industrial production report was not as strong as it looked on the surface. We still believe that the longer-term new orders picture will support 2.0%-2.5% industrial production growth in 2017 (fourth quarter to fourth quarter), which is still better than the 0.9% figure reported for 2016 and approaching longer-term averages of about 2.5%. With a lot of things going soft in 2017 (healthcare, inflation-adjusted retail sales, auto sales, and restaurant sales) manufacturing and housing are two relatively bright spots, at least for now.
First-Quarter GDP Revised Higher for the Right Reasons, From 0.7% to 1.2% Following the usual seasonal pattern, the first estimate of first-quarter GDP growth was just 0.7%. Continuing the usual pattern, the estimate was revised from the pathetic 0.7% to the merely bad 1.2%. Keep in mind that the average, even for this slow-growth economy, has been 2.1%. Still, weather and the needed but complicated seasonal adjustments are every statistician's nightmare, especially in the first quarter. Getting the first-quarter figure right based on actual data is almost as complicated as making the original forecast.
In any case, the upwardly revised first-quarter result still shows the same broad trends: a softening consumer, weak government spending, an uptick in corporate investment, and a nasty-sized inventory adjustment (inventories took more than 1% off GDP calculation, more than estimated in the advance release). Besides inventories, business equipment was the only other major negative revision. On the positive side, intellectual property, state and local government spending, and consumer services were revised higher.
Nevertheless, the first quarter represents quite a change from recent quarters when consumption dominated the positive contributions to GDP, as shown below.
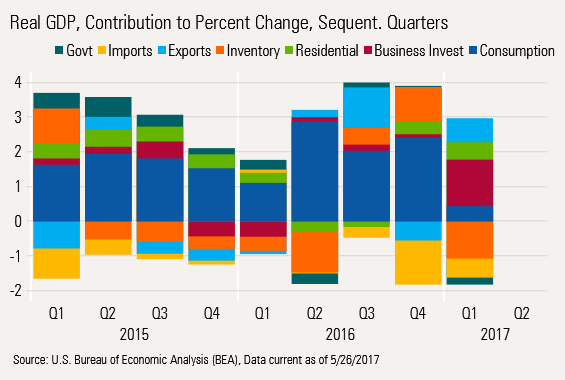
A much smaller blue bar (consumption) along with the large orange inventory bar and another negative dark green bar for government explain most of the quarter's bad news. Business investment (the unusually large red bar), mainly due to oil-patch improvements, kept the first quarter from being even worse.
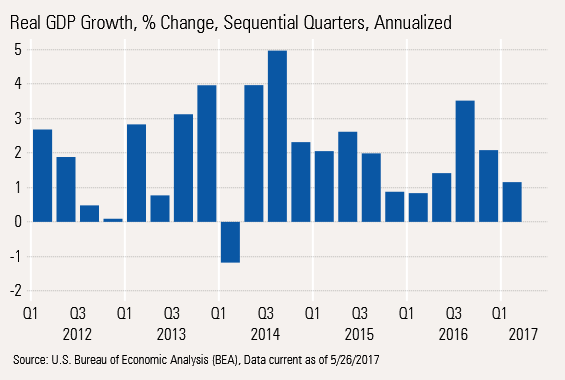
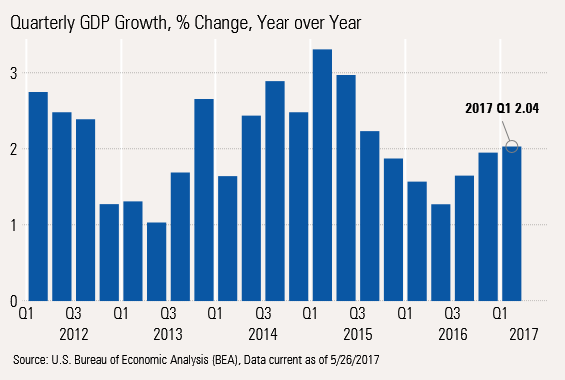
No Need to Despair Over the Sequential GDP Numbers Below, we provide three ways of looking at GDP data: quarterly sequential annualized (the widely reported GDP number); same quarter over same quarter growth rate (which reduces the impact of seasonal adjustment factors); and rolling four-quarter data (which does an even better job of reducing seasonal and weather factors, at the expense of a little less timeliness).
Sequential Data Shows an Inaccurate Picture of Volatility and Continuing Slowing
Year-Over-Year Quarterly Data Showed a Drop in Growth That Has Now Reversed
The Rolling Four-Quarter Growth Rate Has Stabilized at 1.73%, With Signs of Improvement
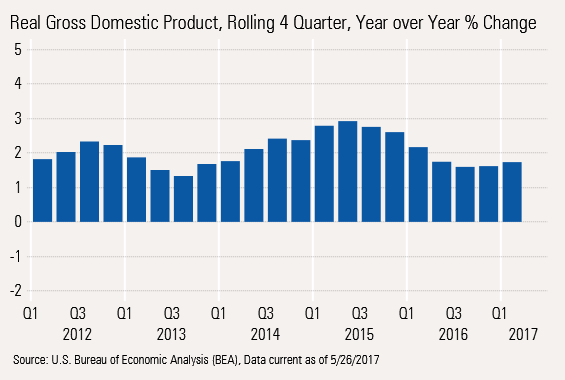
The last two graphs, by accident, happen to bracket our full-year GDP forecast of 1.75%-2.0% growth. As we noted in our introduction, a lot of economists are blowing off the first-quarter GDP as a complete statistical accident, with growth in the second quarter likely to offset first-quarter problems. Though not as high as the GDPNow forecast of 3.7%, the consensus forecast is still for second-quarter GDP growth of 3.1%, in a range of 2.5%-3.6%. If the first-quarter inventory adjustment of 1.1% were to go away, in the second quarter GDP would be back to 2.3% or so. We could agree with that much of the argument for a really strong second quarter.
We are more concerned that net exports will turn back to being a problem in the second quarter after providing some help in the first quarter. Some preliminary data for April--on the goods side of the equation--supports that conclusion. We don't think business investment growth will look as strong, either.
We don't expect the bounce in the consumer sector to be as big as expected, which is where we differ most from the consensus. Auto sales and utility sectors were both big anchors on first-quarter consumption growth. Nevertheless, odd weather patterns have limited the big expected bounce in utilities. Preliminary data from WardsAuto suggests that although auto sales weren't down like they were in April, they won't be up very much--if at all--in May despite some strong incentives.
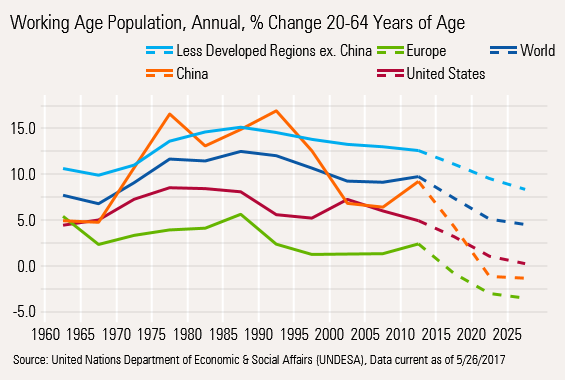
Besides this category analysis, relatively modest--if any--wage gains versus inflation will keep a lid on consumer spending, from a macroeconomic point of view. And, of course, there are the ongoing demographic headwinds of fewer potential workers, low unemployment, and an aging population that tends to spend less and in different categories, all of which will continue over the next five years or more. These will tend to limit the potential to grow GDP at 3% or more on a sustainable basis over the longer term. That lack of workers will show up around the globe, not just in the United States.
One Month of Poor Durable Goods Orders Is No Reason for Panic Economists this week were none too happy about the decline in durable goods orders from March to April. As always, our analysis excludes transportation equipment (airplanes and motor vehicles).
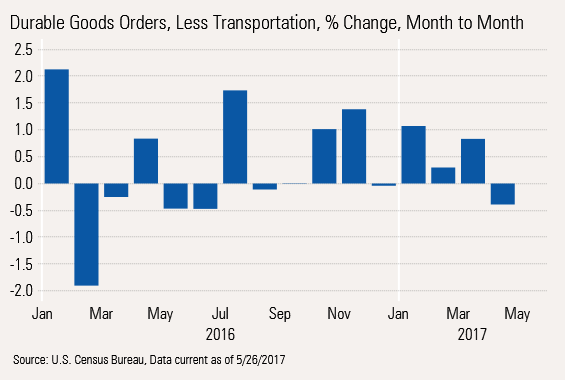
After three relatively good months, April's 0.4% decline is nothing to get particularly concerned about. The month-to-month decline and the breadth of that decline probably mean we shouldn't expect a great acceleration in the manufacturing sector in the short run, though. Five of the six major sectors showed down orders for April. Only the computers and electrical components sector managed to show an increase in orders. We mentioned the tech sector improvement in last week's column, and it continues to help mark up prices of tech-related businesses.
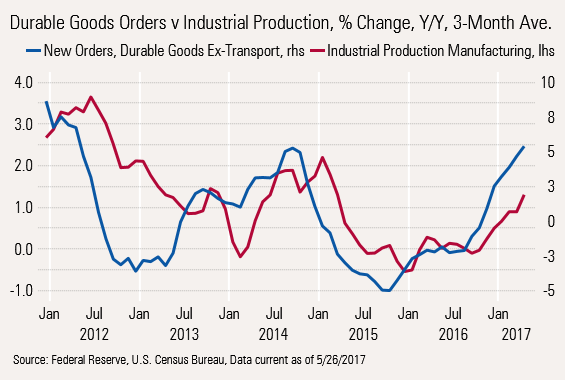
Year-Over-Year Orders Data Still Improving Manufacturing data tends to be a bit volatile and is subject to a lot of day count, seasonal, and quarter-end issues that make single-month readings less than optimal. Also, the order data is not adjusted for either increasing or decreasing prices. The year-over-year order data, on either an averaged or unaveraged basis, is still hovering around 5%. Based on past data, that order rate is consistent with industrial production growth 2.0%-2.5% (IP is effectively adjusted for price, orders are not, accounting for higher order growth). Given that the long-term average is just about 2.4%, this is a satisfactory result, especially compared with last year's 0.9% growth. As of the April reading, manufacturing industrial production is increasing at a 1.3% annual rate, so there is still some headway for growth if the new order data proves to be a reliable indicator.
New Homes and Tract Homes Continue to Look Good as Existing Homes and Apartments Falter We covered this week's housing data in a video, with graphs, that you can find here.
While the month-to-month data on new home sales (which measures tract homes) and existing homes faltered in April, the year-over-year trends were relatively stable. New home sales remain high even as existing-home sales growth remains low and is moving modestly lower. As we describe, a lot of this shift is due to very low and shrinking inventories of existing homes. Meanwhile, new home inventory growth is keeping pace with sales. Poor existing-home inventories continue to drive prices higher. The latest FHFA reports continue to show annual home price growth of more than 6% with the geographic breadth of the increases continuing to spread.
/cloudfront-us-east-1.images.arcpublishing.com/morningstar/GJMQNPFPOFHUHHT3UABTAMBTZM.png)
/cloudfront-us-east-1.images.arcpublishing.com/morningstar/ZYJVMA34ANHZZDT5KOPPUVFLPE.png)
/cloudfront-us-east-1.images.arcpublishing.com/morningstar/LDGHWJAL2NFZJBVDHSFFNEULHE.jpg)