
Falling Real Wage Growth Could Pose Big Problems
Rising inflation and stagnant wage growth are combining to reduce consumer spending power.

Our focus this week is on the employment report, which was disappointing yet consistent with relatively slow GDP growth. In fact, we won't be changing or full-year employment growth rate or GDP forecast of 1.75%-2.0%.
Still, first-quarter GDP growth will now be lucky to hit our 1% target. Furthermore, we still worry deeply that hourly wage growth is not accelerating more in light of the gains in inflation and at least some worker shortages. Vehicle sales for March were disappointing, too, and will likely hurt first-quarter GDP growth.
On the other hand, net trade data looked quite good, with goods exports growth now approaching 5% and imports running at 3% or so. We believe that shifts in consumer tastes (favoring services and U.S. goods), not increased competitiveness, are responsible for the improvement.
A lot of this week's market moves were unrelated to our economic data. News from the U.S. Federal Reserve minutes suggesting that it could reduce its bondholding by year-end caused quite a reversal in equity markets. More worries about how long it would take to pass a new tax bill also surfaced this week. And of course, there were the U.S. retaliatory strikes against Syria to deal with later in the week.
Employment Boom Yet to Appear The monthly employment came as a big disappointment to many economists. The headline job growth was below the consensus estimate of 185,000 jobs, the ADP forecast of 262,000 jobs, and even the 12-month average of the prior 12 months of 187,000 jobs. Our most recent forecast, which projected the addition of 220,000 jobs, was also wide of the mark.
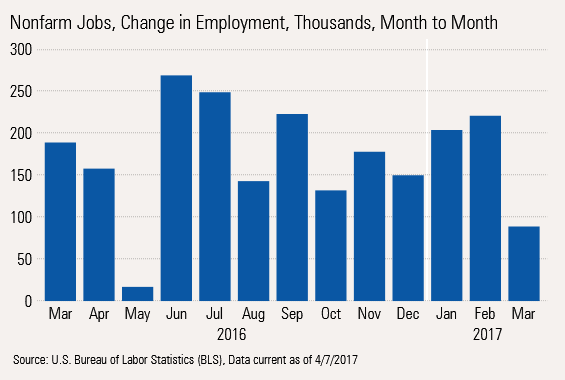
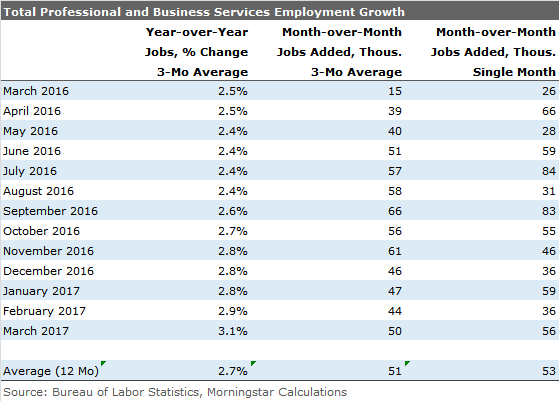
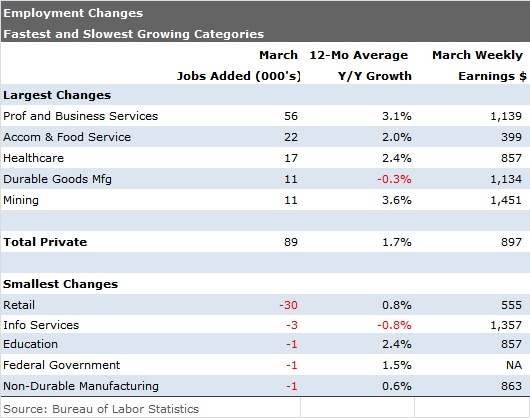
To make matters worse, the prior two months of employment data were revised lower by 38,000, the number of hours worked remained on a downward trajectory, and hourly wage growth is failing to accelerate despite a favorable shift to higher-paying jobs. By category, only professional business services--mostly white-collar jobs--showed any kind of notable strength. This is the largest employment category and one of the best-paying, so it is a sector that we like to see do well.
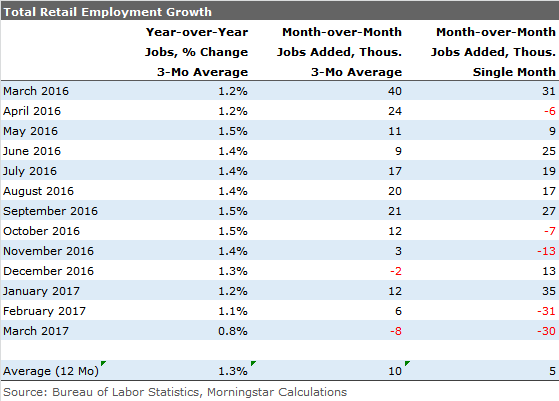
Meanwhile, the hard-pressed retail sector has now managed to lose 30,000 jobs for two months in a row. As retailers appear to be at the early stage of shuttering stores, we suspect this sector will continue to put pressure on total employment numbers over the past year.
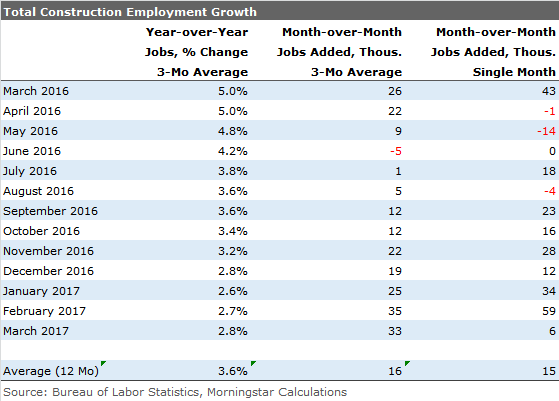
We had hoped that seasonal factors and the positive data in the ADP employment report would enable the monthly employment data to remain above the 200,000 job additions for one more month before settling back to the 190,000 jobs per month we are forecasting for all of 2017. However, the weather gods moved the weather-dependent construction sector from 59,000 job additions in February to just 6,000 jobs in March, dashing our hopes of one more decent month of construction data. Nevertheless, averaging three months of job growth still shows a decent and rising trend in recent months.
Putting in the obligatory analysis of the volatile monthly data, our year-over-year averaged data continues to slow. While the monthly additions for March were basically half of their average rate, private sector employment growth has fallen just over 30% from its 2015 high. The good news is that the year-over-year growth rate has at least stabilized at 1.7%, a level that has persisted since December. Note: the graph below is a bit overdramatized. To make the picture more visible and to fit the text, we zoomed into a very narrow range of growth rates.

To keep our analysis consistent, here is the same private-sector data in tabular form.
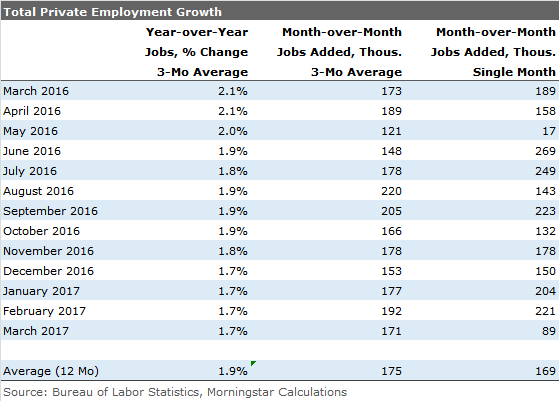
The first column of data, the year-over-year averaged rate, is what appears in our graph. We also included the averaged monthly gains, in the second data column, to show that even the month-to-month data shows more consistency than we might have expected. The final column is the widely reported monthly data that is so volatile it's nearly worthless.
Total Wage Growth Stable; Inflation-Adjusted Data Still a Big Problem While we all love to look at the total employment level and changes, what's more important is total wages across the economy. That analysis includes not only the widely publicized jobs number, but also hours worked and hourly pay rates. Rolling all of those together and throwing in the impact of inflation for good measure provide a better picture of total wages and consumer spending capabilities.
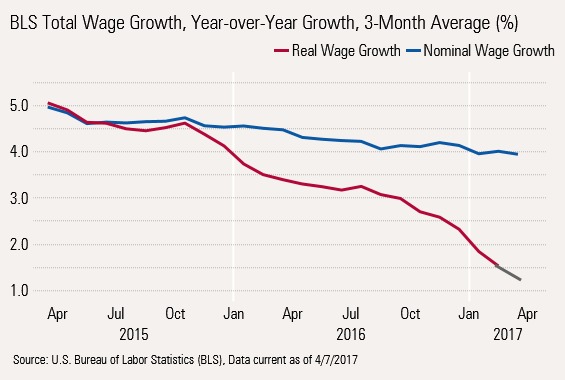
While the nominal number has shown modest deterioration, from 5% to 4%, the inflation-adjusted data has dropped from the same 5% to just 1.5% through February. If the March inflation data stays relatively constant compared with February, that could drop to 1.3%, shown by the gray line segment above. That is why we continue to worry about consumer spending in 2017. Even if the nominal number holds steady at 4% for the rest of the year and inflation drops back to around 2% (our current thinking), real-wage growth would only get back to 2%, hardly anything to get too excited about.
We started with our conclusion on total wages, inflation-adjusted. As usual, we are providing a quick look at the components of that wage growth.
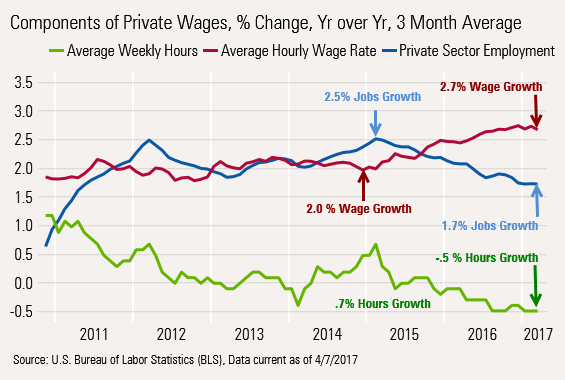
From the graph, one can see that the improvement in hourly wage growth in the past year has roughly offset the change in the jobs growth rate, with the decline in hours worked pulling down the combined total.
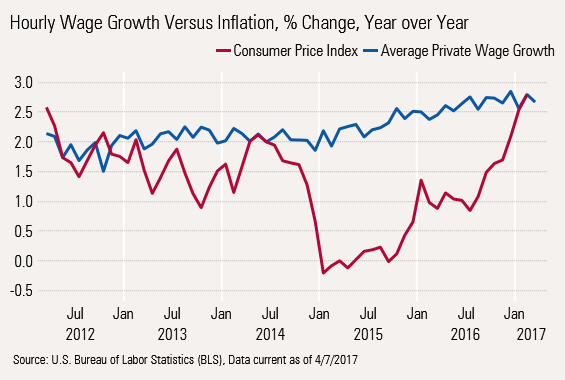
While a lot of folks seem impressed by the hourly wage growth data, it looks much less impressive compared with the recent increases in inflation, as shown below. Inflation and hourly wage growth are now running neck and neck.
Peeling the Onion: Some of the Wage Growth Is Due to Better Job Growth in Higher-Paying Sectors Recent sector data provides good news and bad news. The good news is that relatively well-paying jobs are dominating the employment leaderboard. The bad news is that any given individual might not be doing as well as the data suggests.
Let's take a quick look at some of the leaders and laggards in the March employment report:
Comparing Hours Worked to GDP Doesn't Paint a Hopeful Picture We also like to keep a watchful eye on total hours worked and GDP growth, to help gauge the potential room for improvement in employment growth.
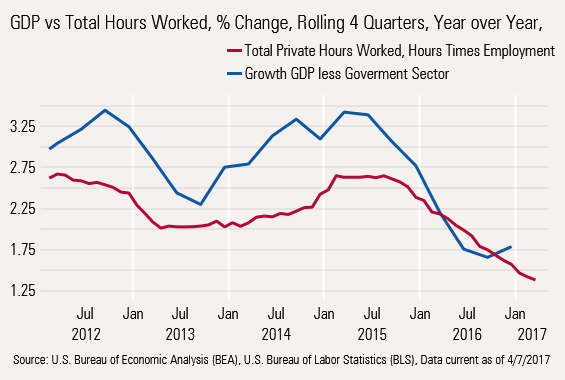
Until 2016, GDP growth remained comfortably above the growth rate of hours worked. However, as GDP slowed and employers clung to workers, that gap disappeared. With hours-worked growth trending down and rolling four-quarter GDP likely to trend up, the gap is moving toward normalization. However, the still-tight spread (1.6% hours growth and maybe a 2.0% rolling four-quarter GDP growth rate) suggests that employment growth is going nowhere fast. Recent history shows a normal spread of 0.5%–1.0%.
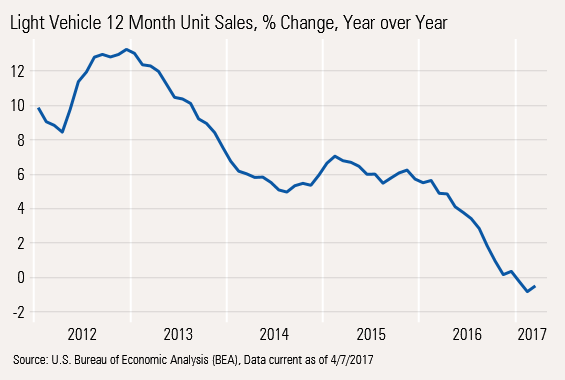
Auto Sales Will Not Save the Economy, at Least Not in the First Quarter Auto sales, like this month's employment data, had an unusual spike down on a month-to-month basis. Seasonally adjusted quarterly unit sales are likely to be down in the first quarter compared with the fourth quarter, pushing many analysts to move their first-quarter GDP forecasts down.
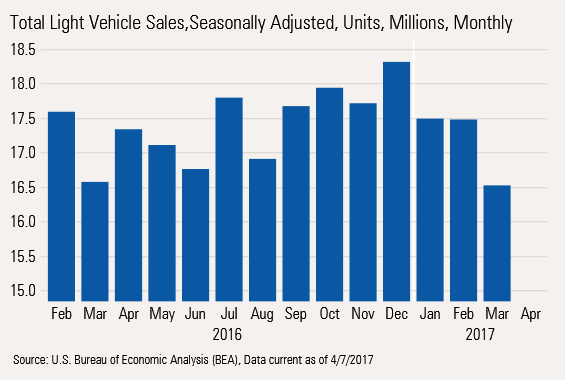
Still, a shift to higher-priced vehicles is likely to keep auto sales from being a complete disaster for first-quarter GDP. While the light truck-SUV crossover category has done quite well, the growth rate is no longer accelerating even as sedan sales continue to deteriorate.
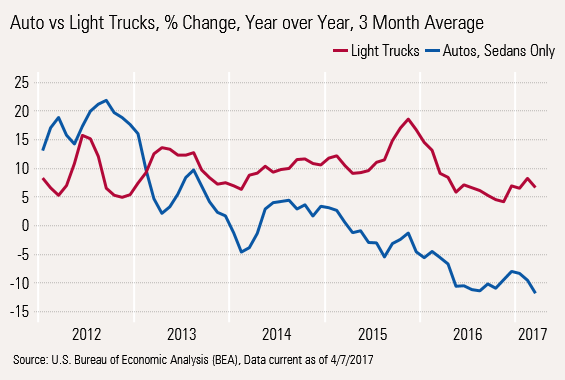
On a Rolling 12-Month Basis, Unit Sales Growth Below Zero
Trade Picture Improving Month-to-month trade data looked better on a month-to-month basis in February, but we're more impressed with the inflation-adjusted year-over-year data that showed exports up about 5% and imports a more modest 3%.
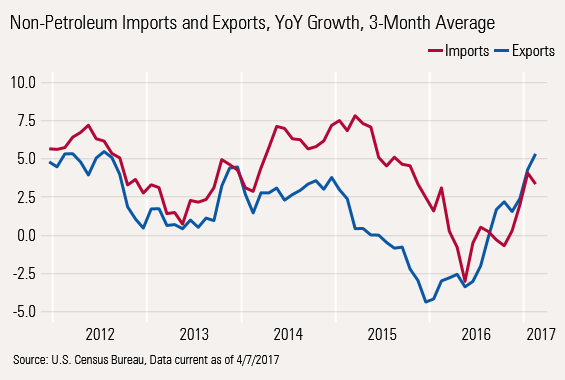
U.S. consumers are showing less interest in physical goods, including imported automobiles, and cellphone growth is showing signs of saturation, both of which have kept a lid on import growth. We also worry a bit that the Chinese holiday schedule could be messing with the data, too. Export growth in excess of import growth is almost unheard of, especially with a relatively strong dollar and cheap prices. The recent data suggests that trade won't help or hinder the first-quarter GDP calculation.
/cloudfront-us-east-1.images.arcpublishing.com/morningstar/T5MECJUE65CADONYJ7GARN2A3E.jpeg)
/cloudfront-us-east-1.images.arcpublishing.com/morningstar/VUWQI723Q5E43P5QRTRHGLJ7TI.png)
/d10o6nnig0wrdw.cloudfront.net/04-22-2024/t_ffc6e675543a4913a5312be02f5c571a_name_file_960x540_1600_v4_.jpg)